What Is a Shooting Star?
A bearish candlestick with a lengthy upper shadow, little or no lower shadow, and a tiny actual body close to the day's low is referred to as a shooting star. It shows up following an upward trend. A shooting star, to put it another way, is a sort of candlestick that develops when a security opens, makes a considerable rise, and ends the day around the open once again.
For a formation to be recognized as a shooting star on a candlestick chart, it must occur during an upward movement in price. Also, there must be a gap between the highest price of the day and the beginning price more significant than twice as wide as the body of the shooting star. There ought to be little or maybe no shadow underneath the body.
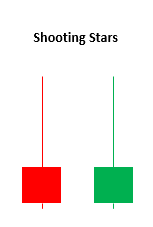
The Shooting Star: What Does It Mean?
The appearance of shooting stars points to a possible price peak and subsequent reverse. When three or more successive rising candles with higher highs precede it, the shooting star candle will develop at its most potent. It's also possible to happen when prices are generally going up, even if some of the most recent candles have shown a negative trend.
A shooting star appears after the advance and then makes a rapid ascent throughout the day. This demonstrates the same intense purchasing pressure seen over the last several weeks. Nevertheless, as the day proceeds, the sellers step in and bring the price back down to roughly where it was when it opened, thereby wiping out any profits made earlier in the day. This demonstrates that buyers lose power at the end of the day, and sellers may take over the market. The extended upper shadow represents the customers who made purchases throughout the day but are now in the red since the price has returned to its opening level.
The shooting star candle is validated by the candle that develops following the shooting star. The high point of the next candle must remain lower than the high point of the shooting star, and it must then close lower than the shooting star's close point. The candle that follows the shooting star should, in theory, gap lower or open close to the previous close and then go down on significant volume. Following a shooting star with a down day helps reinforce the price reversal and signals that the price may continue to decrease.
The price range of the shooting star may still serve as a barrier if the price goes up after a shooting star. For instance, the price may settle in the vicinity of the shooting star. If, in the end, the price continues to increase, this indicates that the uptrend is still active.
The Shooting Star's Capabilities and Limitations
In a strong rise, the significance of a single candle is little. Because prices constantly fluctuate, it's possible that the sellers who take control for a portion of one period—like a shooting star—won't be all that important in the end.
This is the reason why confirmation is necessary. Even with a guarantee, there is no certainty that the price will continue to fall or how far it will fall. Therefore, selling may take place after the shooting star. The price may continue to rise with the longer-term increase after experiencing a temporary drop.
Consider using candlesticks in combination with many other methods of analysis as well. If a candlestick pattern appears close to a price level identified as significant by different types of technical analysis, the importance of the pattern may increase.
Technical analysis with moomoo
Moomoo stock trading app provides free advanced stock charting tools to help various investors to analyze trends and patterns with 60+ technical indicators and add visuals to charts using 38+ drawing tools. Sign up and download the moomoo app today to access these charting tools!
This presentation is for informational and educational use only and is not a recommendation or endorsement of any particular investment or investment strategy. Investment information provided in this content is general in nature, strictly for illustrative purposes, and may not be appropriate for all investors. Read more
Recommend
What Is Commodity Channel Index?
What Is Technical Analysis of Stock Market?
What Is a Pivot Point in Stock Market

Top Trading Tools Traders Should Know
What Is the Price Channel Indicator
What Is Volume of Trade?
What Is a Harami Cross?
What Is the Rate of Change (ROC)?
What Is the Pattern of Inverted Hammer Candlesticks?
What Is the Price Percentage Oscillator?
What Is the Parabolic SAR Indicator?
What Is the Directional Divergence Index?
What Is the Ichimoku Kinko Hyo?
What Is the Average True Range (ATR)
What Is a Bearish Harami?
What Are the Three Black Crows?
What Is Turnover?
What Is a Morning Star?
What Is a Detrended Price Oscillator (DPO)?
What does Williams %R mean?
What Is a Three Outside Up and Down?
What Is a Shooting Star?
What Is an Evening Star?
What Is a Bullish Harami?
What Is Three Inside Up and Three Inside Down?
What Is Bullish and Bearish Breakaway Candlestick Pattern?
What Is a Detrended Price Oscillator?
What Is Keltner Channel?
What Is the Separating Lines Candlestick Pattern?
What Is a Hammer Candlestick?
What Is Bull Bear Ratio?
What is the Exponential Moving Average (EMA): Usage and Limitations
How Stock Charting Tools Can Help Investors in the Stock Market
What Is Bias Ratio?
What Does the Directional Movement Index (DMI) Indicate?
Everything About Stock Heatmaps That Investors Should Know
What Is an Oscillator
What Is a Doji?
What Is Parabolic Stop and Reverse (SAR)
Triple Exponential Average (TRIX): What Does That Mean?
What Is Three White Soldiers Candlestick Pattern?
What Is a Volume Moving Average (VMA)
What Is a Bullish Engulfing Pattern?
What Is a Psychological Line
What Is Commodity Channel Index?
What Is Technical Analysis of Stock Market?
What Is a Pivot Point in Stock Market
Top Trading Tools Traders Should Know
What Is the Price Channel Indicator
What Is Volume of Trade?
What Is a Harami Cross?
What Is the Rate of Change (ROC)?
What Is the Pattern of Inverted Hammer Candlesticks?
What Is the Price Percentage Oscillator?
What Is the Parabolic SAR Indicator?
What Is the Directional Divergence Index?
What Is the Ichimoku Kinko Hyo?
What Is the Average True Range (ATR)
What Is a Bearish Harami?
What Are the Three Black Crows?
What Is Turnover?
What Is a Morning Star?
What Is a Detrended Price Oscillator (DPO)?
What does Williams %R mean?
What Is a Three Outside Up and Down?
What Is a Shooting Star?
What Is an Evening Star?
What Is a Bullish Harami?
What Is Three Inside Up and Three Inside Down?
What Is Bullish and Bearish Breakaway Candlestick Pattern?
What Is a Detrended Price Oscillator?
What Is Keltner Channel?
What Is the Separating Lines Candlestick Pattern?
What Is a Hammer Candlestick?
What Is Bull Bear Ratio?
What is the Exponential Moving Average (EMA): Usage and Limitations
How Stock Charting Tools Can Help Investors in the Stock Market
What Is Bias Ratio?
What Does the Directional Movement Index (DMI) Indicate?
Everything About Stock Heatmaps That Investors Should Know
What Is an Oscillator
What Is a Doji?
What Is Parabolic Stop and Reverse (SAR)
Triple Exponential Average (TRIX): What Does That Mean?
What Is Three White Soldiers Candlestick Pattern?
What Is a Volume Moving Average (VMA)
What Is a Bullish Engulfing Pattern?
What Is a Psychological Line