What Is a Psychological Line
For investors to better comprehend the mentality of other stock market participants, the psychological line may be utilized to determine if investors have a bullish or bearish outlook on the market. A psychological line is a tool that may determine if an investor is more likely to be a buyer or a seller based on their psychological makeup. It assesses if an overvalued or oversold situation exists in the stock market.
Definition
The psychological line may be considered a popularity indicator; it is calculated by dividing the total number of up days by the total number of down days in the market index. Its purpose is to track the psychological movement of investors so that it may use that information as a point of reference when buying and selling.
Formula
PSY = Number of Days When the Stock Price Rose in N days / N * 100%
PSYMA = M-day average of PSY
Due to the prevalence of short-term investment in China, the 13-day psychological line is used as the benchmark for judgment indicators.
How to make use of it
An overbought region has a value of 75 or higher, while an oversold area has a value of 25 or below.
A fluctuation between 25 and 75 is considered typical and falls within the normal distribution range.
10 and below is considered a highly oversold region.
A reading of 90 or above shows investors have a highly positive outlook, which points to a highly overbought position.
An overbought situation is indicated when the PSY is more than 92.31 (having risen continuously for 12 days). This implies that investors have an excessively positive outlook on the market.
When the PSY falls below 7.69, it represents a decline that has been ongoing for 12 days. This implies a highly negative outlook and that the market is oversold.
Features
The psychological line evaluates investors' bullish or negative emotions according to the days the stock price increases, thus determining whether the share market is overheated or oversold. This is done by counting the number of days that the stock price rises. One sort of popularity measure is referred to as the psychological line.
The stock market in China has a limit up/down of 7%, which ensures that the up-and-down oscillation of the stock price has a fixed range to adhere to. The psychological line's accuracy has also been significantly enhanced.
Investors can subjectively determine if the stock market is overbought or oversold, thanks to the combination of short-term and medium-term psychological lines. For instance, the 13-day and 25-day psychological lines may be combined to form a single trading strategy.
Investors can observe bullish or bearish sentiment in the stock market and the accumulation or dispersal of funds when the psychological line is used in conjunction with other technical indicators such as VR (volatility ratio). This helps investors determine whether the market is in the head or bottom zone.
Since the construction of the psychological line uses only two variables (up and down), it may not accurately represent all of the changes in the stock price.
The psychological line does not show a clear trading signal and only displays the highest and lowest end of the market's pricing range.
If the stock price is wildly fluctuating, the psychological line will not be as accurate since the number of days the stock price goes up and down will not be able to represent the wild swings in price.
When used with the candle chart, the psychological line may provide a more unambiguous indication of whether the stock market is overbought or oversold.
Technical analysis with moomoo
Moomoo stock trading app provides powerful stock charting tools to meet various investors' technical analysis needs and help to make investing decisions. Moomoo stock charting tools consist of 63+ technical indicators, 38 types of charts, support for saving and synchronization of charts, and customized color patterns, etc. Download the moomoo app today to get access to these free charting tools!
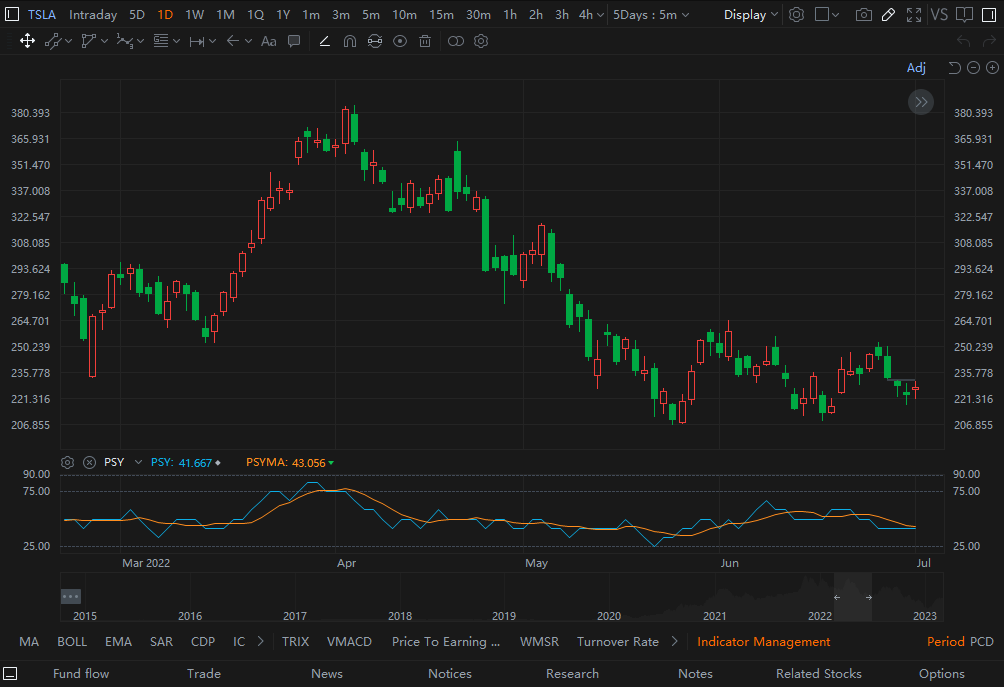
Images provided are not current and any securities are shown for illustrative purposes only.
This presentation is for informational and educational use only and is not a recommendation or endorsement of any particular investment or investment strategy. Investment information provided in this content is general in nature, strictly for illustrative purposes, and may not be appropriate for all investors. Read more
Recommend
What Is Commodity Channel Index?

What Is Technical Analysis of Stock Market?

What Is a Pivot Point in Stock Market

Top Trading Tools Traders Should Know
What Is the Price Channel Indicator
What Is Volume of Trade?
What Is a Harami Cross?
What Is the Rate of Change (ROC)?
What Is the Pattern of Inverted Hammer Candlesticks?
What Is the Price Percentage Oscillator?
What Is the Parabolic SAR Indicator?
What Is the Directional Divergence Index?
What Is the Ichimoku Kinko Hyo?
What Is the Average True Range (ATR)
What Is a Bearish Harami?
What Are the Three Black Crows?
What Is Turnover?
What Is a Morning Star?
What Is a Detrended Price Oscillator (DPO)?
What does Williams %R mean?
What Is a Three Outside Up and Down?
What Is a Shooting Star?
What Is an Evening Star?
What Is a Bullish Harami?
What Is Three Inside Up and Three Inside Down?
What Is Bullish and Bearish Breakaway Candlestick Pattern?
What Is a Detrended Price Oscillator?
What Is Keltner Channel?
What Is the Separating Lines Candlestick Pattern?
What Is a Hammer Candlestick?
What Is Bull Bear Ratio?
What is the Exponential Moving Average (EMA): Usage and Limitations
How Stock Charting Tools Can Help Investors in the Stock Market
What Is Bias Ratio?
What Does the Directional Movement Index (DMI) Indicate?
Everything About Stock Heatmaps That Investors Should Know
What Is an Oscillator
What Is a Doji?
What Is Parabolic Stop and Reverse (SAR)
Triple Exponential Average (TRIX): What Does That Mean?
What Is Three White Soldiers Candlestick Pattern?
What Is a Volume Moving Average (VMA)
What Is a Bullish Engulfing Pattern?
What Is a Psychological Line
What Is Commodity Channel Index?
What Is Technical Analysis of Stock Market?
What Is a Pivot Point in Stock Market
Top Trading Tools Traders Should Know
What Is the Price Channel Indicator
What Is Volume of Trade?
What Is a Harami Cross?
What Is the Rate of Change (ROC)?
What Is the Pattern of Inverted Hammer Candlesticks?
What Is the Price Percentage Oscillator?
What Is the Parabolic SAR Indicator?
What Is the Directional Divergence Index?
What Is the Ichimoku Kinko Hyo?
What Is the Average True Range (ATR)
What Is a Bearish Harami?
What Are the Three Black Crows?
What Is Turnover?
What Is a Morning Star?
What Is a Detrended Price Oscillator (DPO)?
What does Williams %R mean?
What Is a Three Outside Up and Down?
What Is a Shooting Star?
What Is an Evening Star?
What Is a Bullish Harami?
What Is Three Inside Up and Three Inside Down?
What Is Bullish and Bearish Breakaway Candlestick Pattern?
What Is a Detrended Price Oscillator?
What Is Keltner Channel?
What Is the Separating Lines Candlestick Pattern?
What Is a Hammer Candlestick?
What Is Bull Bear Ratio?
What is the Exponential Moving Average (EMA): Usage and Limitations
How Stock Charting Tools Can Help Investors in the Stock Market
What Is Bias Ratio?
What Does the Directional Movement Index (DMI) Indicate?
Everything About Stock Heatmaps That Investors Should Know
What Is an Oscillator
What Is a Doji?
What Is Parabolic Stop and Reverse (SAR)
Triple Exponential Average (TRIX): What Does That Mean?
What Is Three White Soldiers Candlestick Pattern?
What Is a Volume Moving Average (VMA)
What Is a Bullish Engulfing Pattern?
What Is a Psychological Line