What Is Bias Ratio?
The bias ratio is a statistical tool that finance professionals use to make informed decisions. It compares and evaluates the performance of several asset classes over time to calculate the level of risk associated with an investment. It helps to determine the expected decline or rise in asset value.
The bias ratio is computed by subtracting the return of a benchmark index, such as the S&P 500, from the average return of an asset class over a specified period. After that, the result is split by the asset class's return standard deviation.
An asset class with a high bias ratio has excelled in its benchmark throughout the specified period. On the other hand, an asset class with a low bias ratio has underperformed. If the bias ratio is negative, the asset class has depreciated compared to the benchmark.
Finance experts can use the bias ratio to determine which assets are more likely to produce positive returns and which are more likely to face value losses by using this tool. Investors can manage their resources more wisely if they know the risk involved in a particular investment.
One can calculate the Bias ratio by using the formulae given below:
Bias Ratio = (Average return of asset class – Return of benchmark index) / Standard deviation of asset class’s returns
Hypothetical:
For instance, suppose you're thinking about investing in a start-up tech firm. You want to use the bias ratio to guide your decision-making because you are aware of how volatile the tech industry has been previously.
You can determine the bias ratio for the technology sector by subtracting the return of the S&P 500 from the average return of tech companies over the previous five years. The value, thus, obtained is then divided by the returns on the tech stock's standard deviation.
The bias ratio for the technology industry is calculated to be 1.2. This indicates that tech stocks, on average, have outperformed the S&P 500 by 1.2% during the previous five years. The higher standard deviation, however, shows that they have also been more volatile.
This information could help you identify the risks associated with the tech sector and shift your focus. However, one should always be aware that past performance is not indicative of future results.
Technical analysis with moomoo
Moomoo stock trading app provides powerful stock charting tools to meet various investors' technical analysis needs and help to make investing decisions. Moomoo stock charting tools consist of 63+ technical indicators (like BIAS), 38 types of charts, support for saving and synchronization of charts, and customized color patterns, etc. Sign up and download the moomoo app today to get access to these free charting tools!
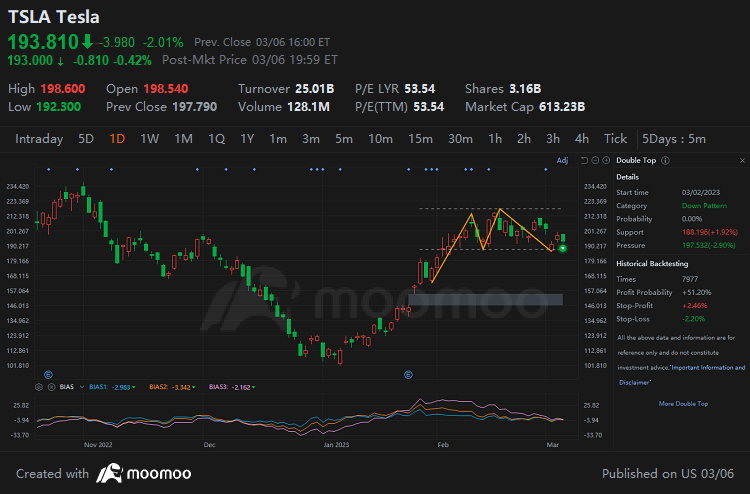
Images provided are not current and any securities are shown for illustrative purposes only.
*This article discusses technical analysis, other approaches, including fundamental analysis, may offer very different views. The examples provided are for illustrative purposes only and are not intended to be reflective of the results you can expect to achieve. Specific security charts used are for illustrative purposes only and are not a recommendation, offer to sell, or a solicitation of an offer to buy any security.
This presentation is for informational and educational use only and is not a recommendation or endorsement of any particular investment or investment strategy. Investment information provided in this content is general in nature, strictly for illustrative purposes, and may not be appropriate for all investors. Read more
Recommend
What Is Commodity Channel Index?
What Is Technical Analysis of Stock Market?
What Is a Pivot Point in Stock Market

Top Trading Tools Traders Should Know
What Is the Price Channel Indicator
What Is Volume of Trade?
What Is a Harami Cross?
What Is the Rate of Change (ROC)?
What Is the Pattern of Inverted Hammer Candlesticks?
What Is the Price Percentage Oscillator?
What Is the Parabolic SAR Indicator?
What Is the Directional Divergence Index?
What Is the Ichimoku Kinko Hyo?
What Is the Average True Range (ATR)
What Is a Bearish Harami?
What Are the Three Black Crows?
What Is Turnover?
What Is a Morning Star?
What Is a Detrended Price Oscillator (DPO)?
What does Williams %R mean?
What Is a Three Outside Up and Down?
What Is a Shooting Star?
What Is an Evening Star?
What Is a Bullish Harami?
What Is Three Inside Up and Three Inside Down?
What Is Bullish and Bearish Breakaway Candlestick Pattern?
What Is a Detrended Price Oscillator?
What Is Keltner Channel?
What Is the Separating Lines Candlestick Pattern?
What Is a Hammer Candlestick?
What Is Bull Bear Ratio?
What is the Exponential Moving Average (EMA): Usage and Limitations
How Stock Charting Tools Can Help Investors in the Stock Market
What Is Bias Ratio?
What Does the Directional Movement Index (DMI) Indicate?
Everything About Stock Heatmaps That Investors Should Know
What Is an Oscillator
What Is a Doji?
What Is Parabolic Stop and Reverse (SAR)
Triple Exponential Average (TRIX): What Does That Mean?
What Is Three White Soldiers Candlestick Pattern?
What Is a Volume Moving Average (VMA)
What Is a Bullish Engulfing Pattern?
What Is a Psychological Line
What Is Commodity Channel Index?
What Is Technical Analysis of Stock Market?
What Is a Pivot Point in Stock Market
Top Trading Tools Traders Should Know
What Is the Price Channel Indicator
What Is Volume of Trade?
What Is a Harami Cross?
What Is the Rate of Change (ROC)?
What Is the Pattern of Inverted Hammer Candlesticks?
What Is the Price Percentage Oscillator?
What Is the Parabolic SAR Indicator?
What Is the Directional Divergence Index?
What Is the Ichimoku Kinko Hyo?
What Is the Average True Range (ATR)
What Is a Bearish Harami?
What Are the Three Black Crows?
What Is Turnover?
What Is a Morning Star?
What Is a Detrended Price Oscillator (DPO)?
What does Williams %R mean?
What Is a Three Outside Up and Down?
What Is a Shooting Star?
What Is an Evening Star?
What Is a Bullish Harami?
What Is Three Inside Up and Three Inside Down?
What Is Bullish and Bearish Breakaway Candlestick Pattern?
What Is a Detrended Price Oscillator?
What Is Keltner Channel?
What Is the Separating Lines Candlestick Pattern?
What Is a Hammer Candlestick?
What Is Bull Bear Ratio?
What is the Exponential Moving Average (EMA): Usage and Limitations
How Stock Charting Tools Can Help Investors in the Stock Market
What Is Bias Ratio?
What Does the Directional Movement Index (DMI) Indicate?
Everything About Stock Heatmaps That Investors Should Know
What Is an Oscillator
What Is a Doji?
What Is Parabolic Stop and Reverse (SAR)
Triple Exponential Average (TRIX): What Does That Mean?
What Is Three White Soldiers Candlestick Pattern?
What Is a Volume Moving Average (VMA)
What Is a Bullish Engulfing Pattern?
What Is a Psychological Line