How to Decode Inflation: CPI, PCE, and PPI
Policymakers and businesses pay close attention to inflation, which refers to the overall rise in prices for goods and services. While a certain level of inflation is generally associated with economic expansion, excessive inflation can be detrimental to financial stability.
Investors are also keeping a close eye on inflation, which can significantly impact the performance of capital markets.
So, what are the indicators that reflect inflation? The most important are CPI, PCE, and PPI.
You’ve probably seen these acronyms thrown around in the news, but what do they mean, and how can we interpret them?
Takeaways:
CPI is widely used internationally, while the Fed prefers PCE for its comprehensive approach
PPI provides early signals of inflation by tracking producer costs
Core indicators exclude volatile items for a stable, long-term view
1. Consumer Indicators: CPI and PCE
Both CPI and PCE are key players in gauging consumer spending.
Consumer Price Index (CPI) is the most widely used international measure of inflation. It tracks the overall price changes paid by consumers for goods and services.
Imagine shopping at the supermarket, tossing various items into your cart, and then heading to the checkout. CPI is like that, but on a massive scale, tracking price changes across different sectors such as food, housing, energy, and medical care.
Statisticians survey consumers to estimate spending proportions in these categories, assigning weights to each to reflect their importance.
Personal Consumption Expenditures (PCE) is a U.S.-specific indicator. While it also reflects consumer and household spending, it takes a broader approach by including data from businesses and the government, providing a more comprehensive picture.
Due to different calculation methods, there are differences in weightings; for example, housing holds more weight in CPI, while medical care is far more significant in PCE.
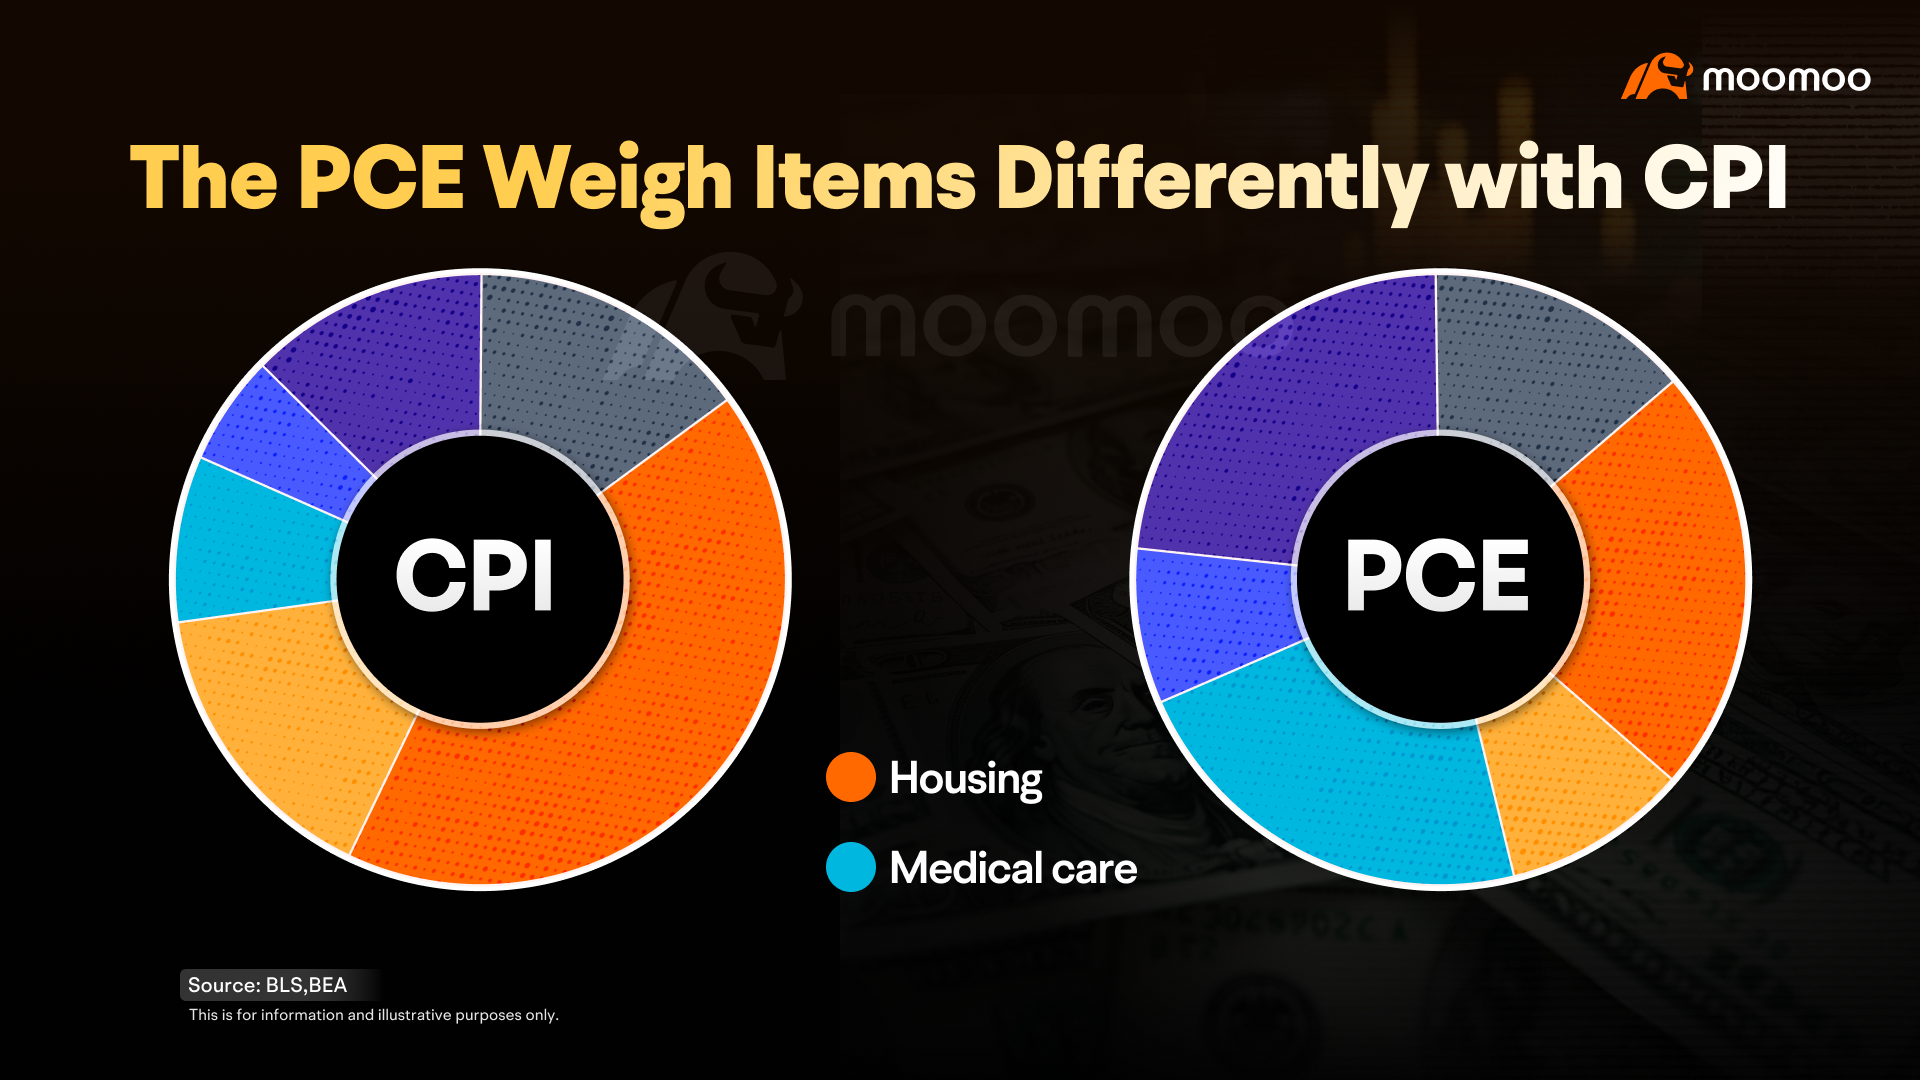
CPI updates its weights every two years, whereas PCE tweaks them quarterly, offering a timelier reflection of spending shifts. When making policy decisions, the Federal Reserve prefers PCE.
So why not just focus on PCE? Not so fast!
The market still leans heavily on CPI for several reasons. CPI is widely used globally, making international comparisons easier. When you hear "inflation rate" in the news, it's usually referring to CPI.
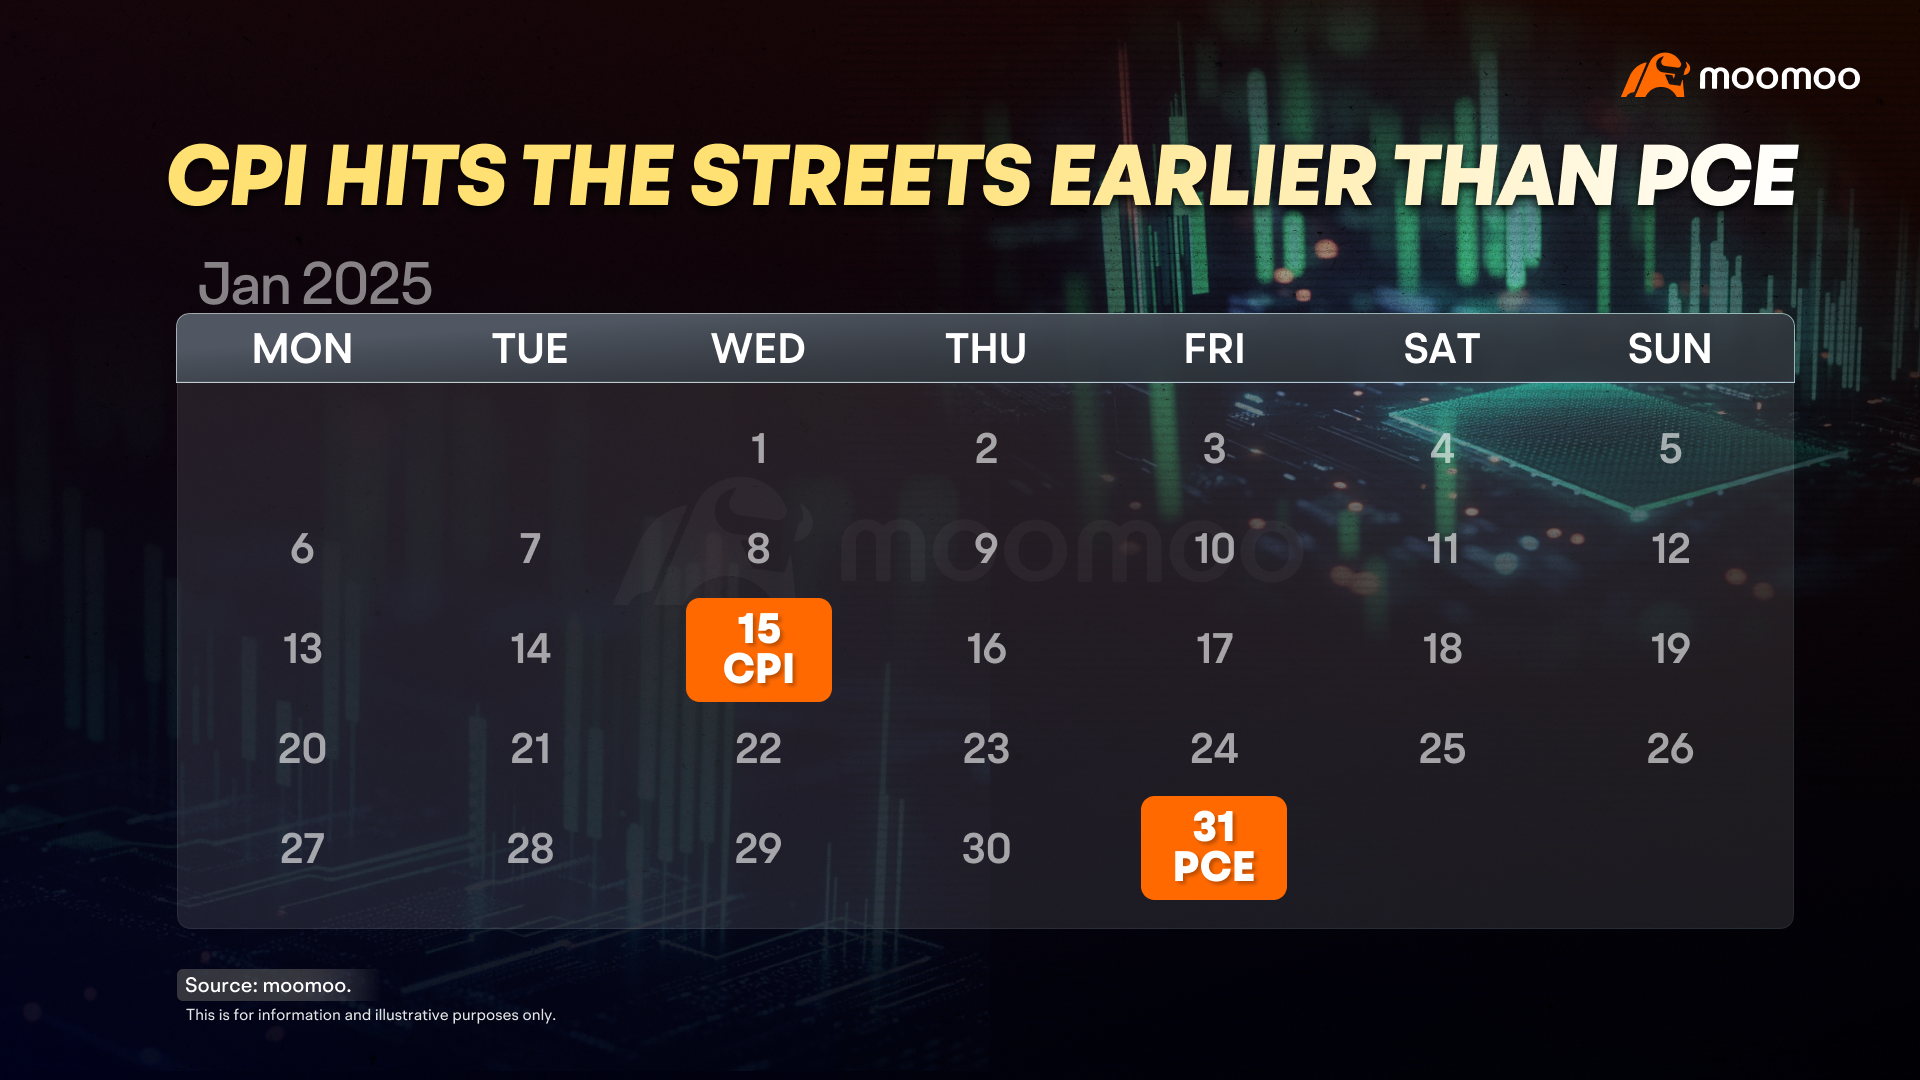
Plus, CPI data hits the streets earlier— usually in the middle of each month, compared to PCE's release at the end.
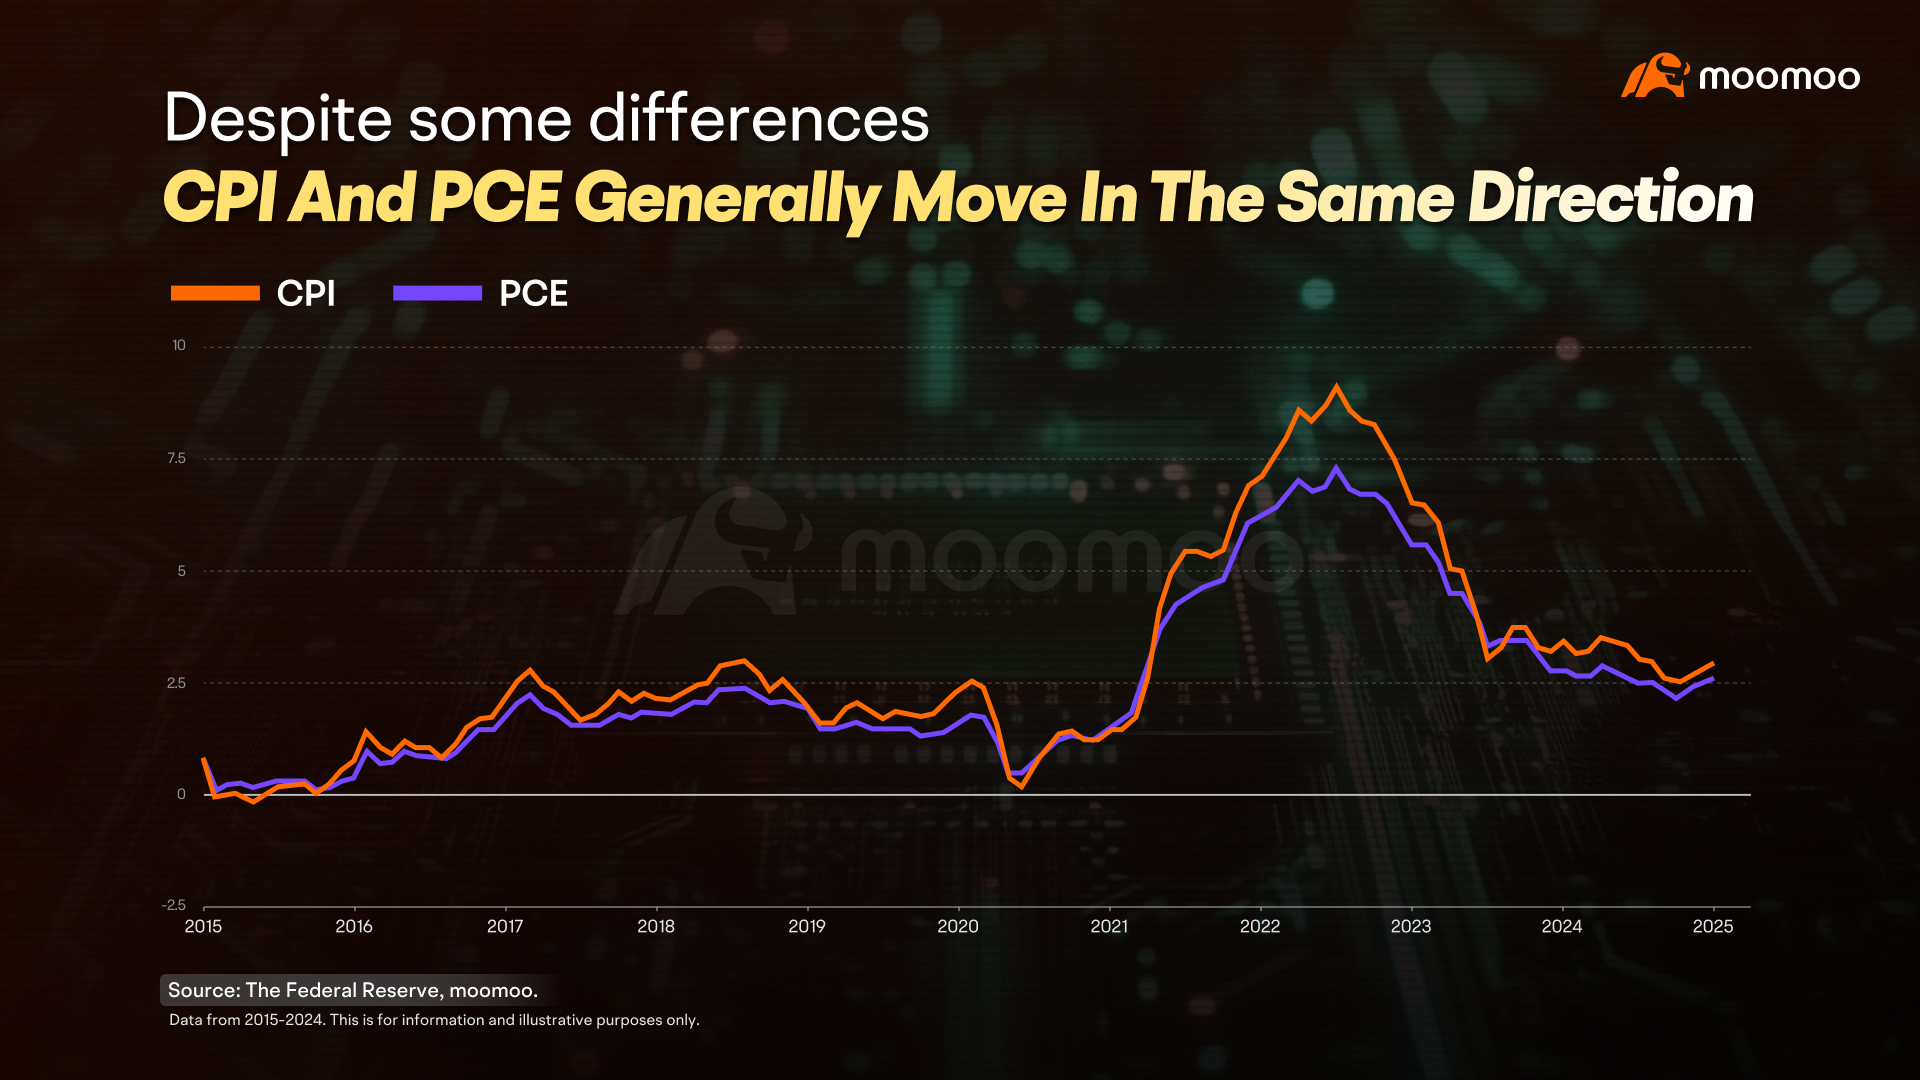
Despite their differences, CPI and PCE generally move in the same direction. By the time PCE data drops, investors have typically digested the CPI figures, lessening its market impact.
2. Producer Indicator: PPI
Besides consumer prices shown by CPI and PCE, producer costs are also crucial for measuring inflation. This is where the Producer Price Index (PPI) comes in. It is usually released two days after CPI.
Think of it as capturing the upstream part of the economic food chain. When you buy a soda at the store, the price you pay is the "consumer price," but the cost of producing that soda, like the glass bottle, syrup, and sweeteners, is what PPI tracks.
PPI is compiled similarly to CPI but monitors price changes at stages of production. Since producers are closer to the source of inflation, they are more sensitive to price changes.
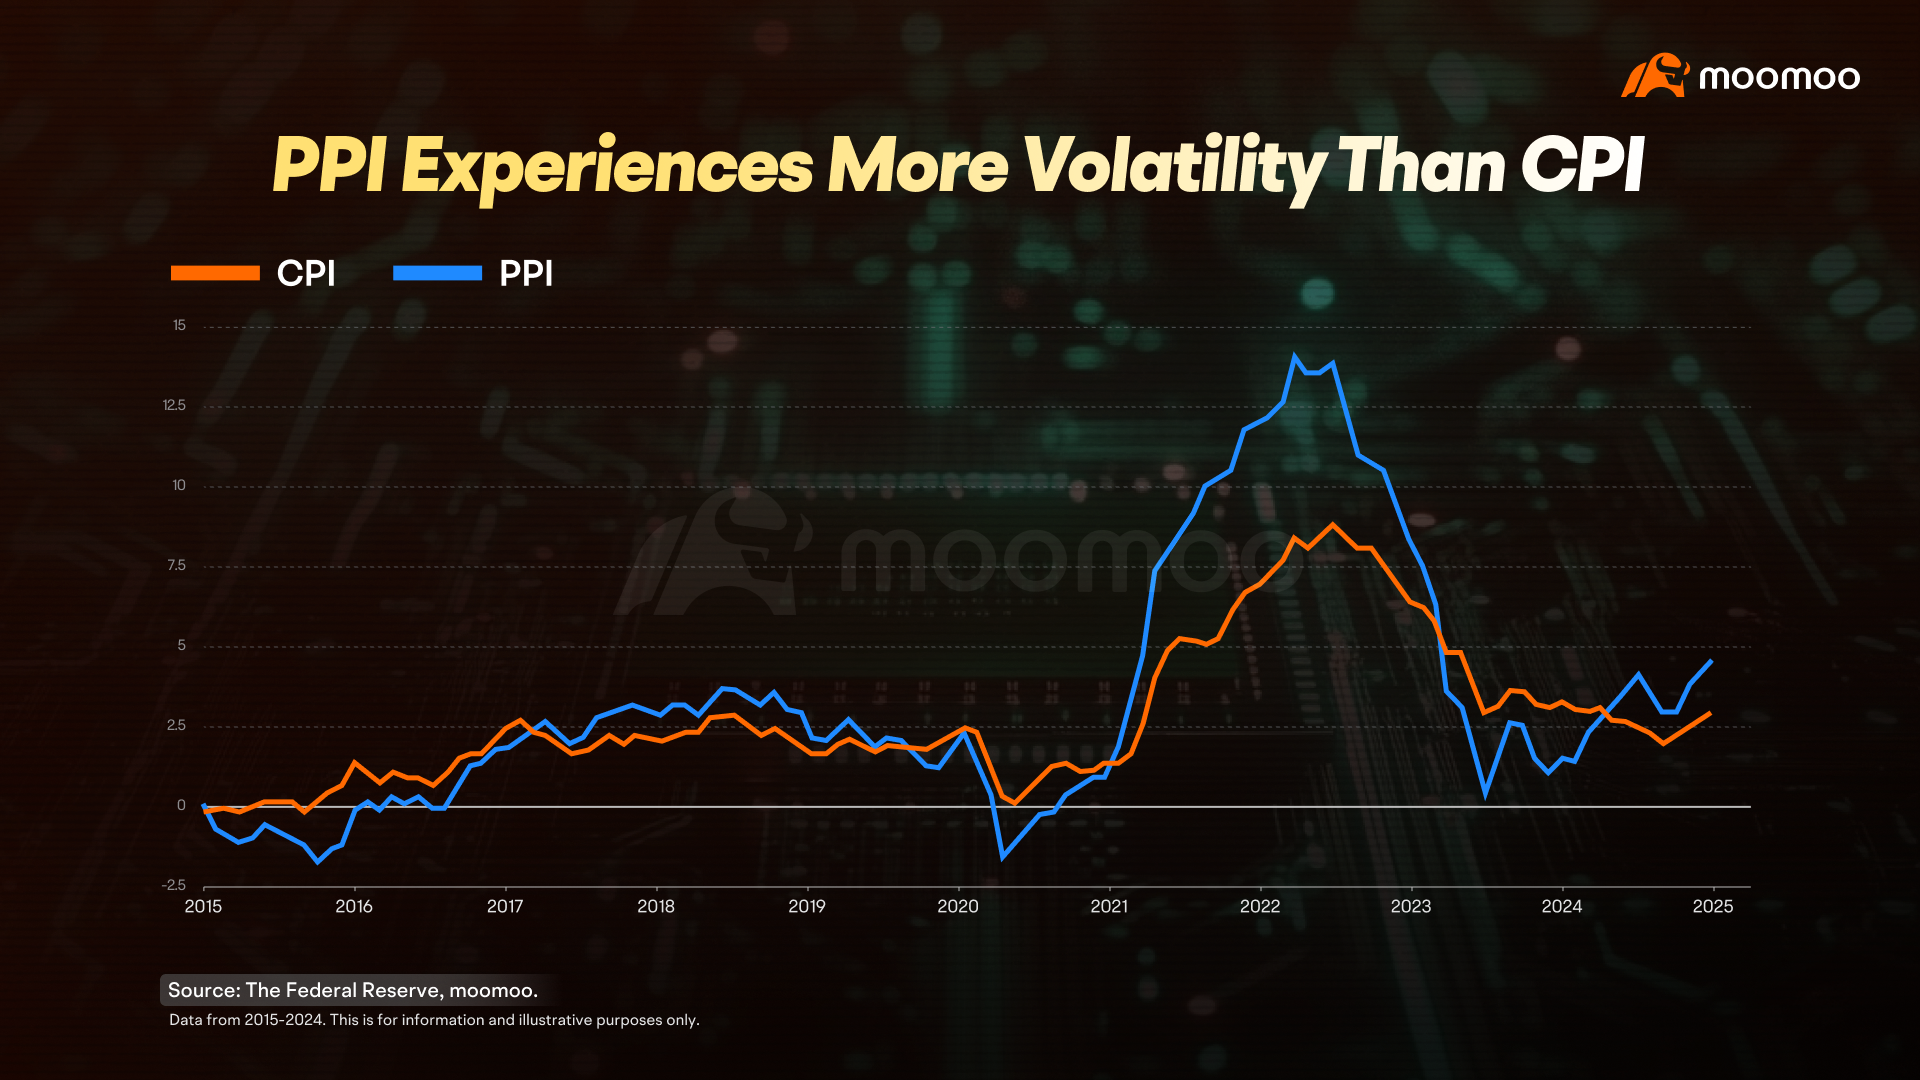
Data shows that during periods of high inflation, like in 2021, PPI tends to spike before CPI and experiences more volatility.
3. Core vs. Non-Core
If you’ve been paying attention to inflation reports, you might have noticed each indicator has a "core" version. What's that all about?
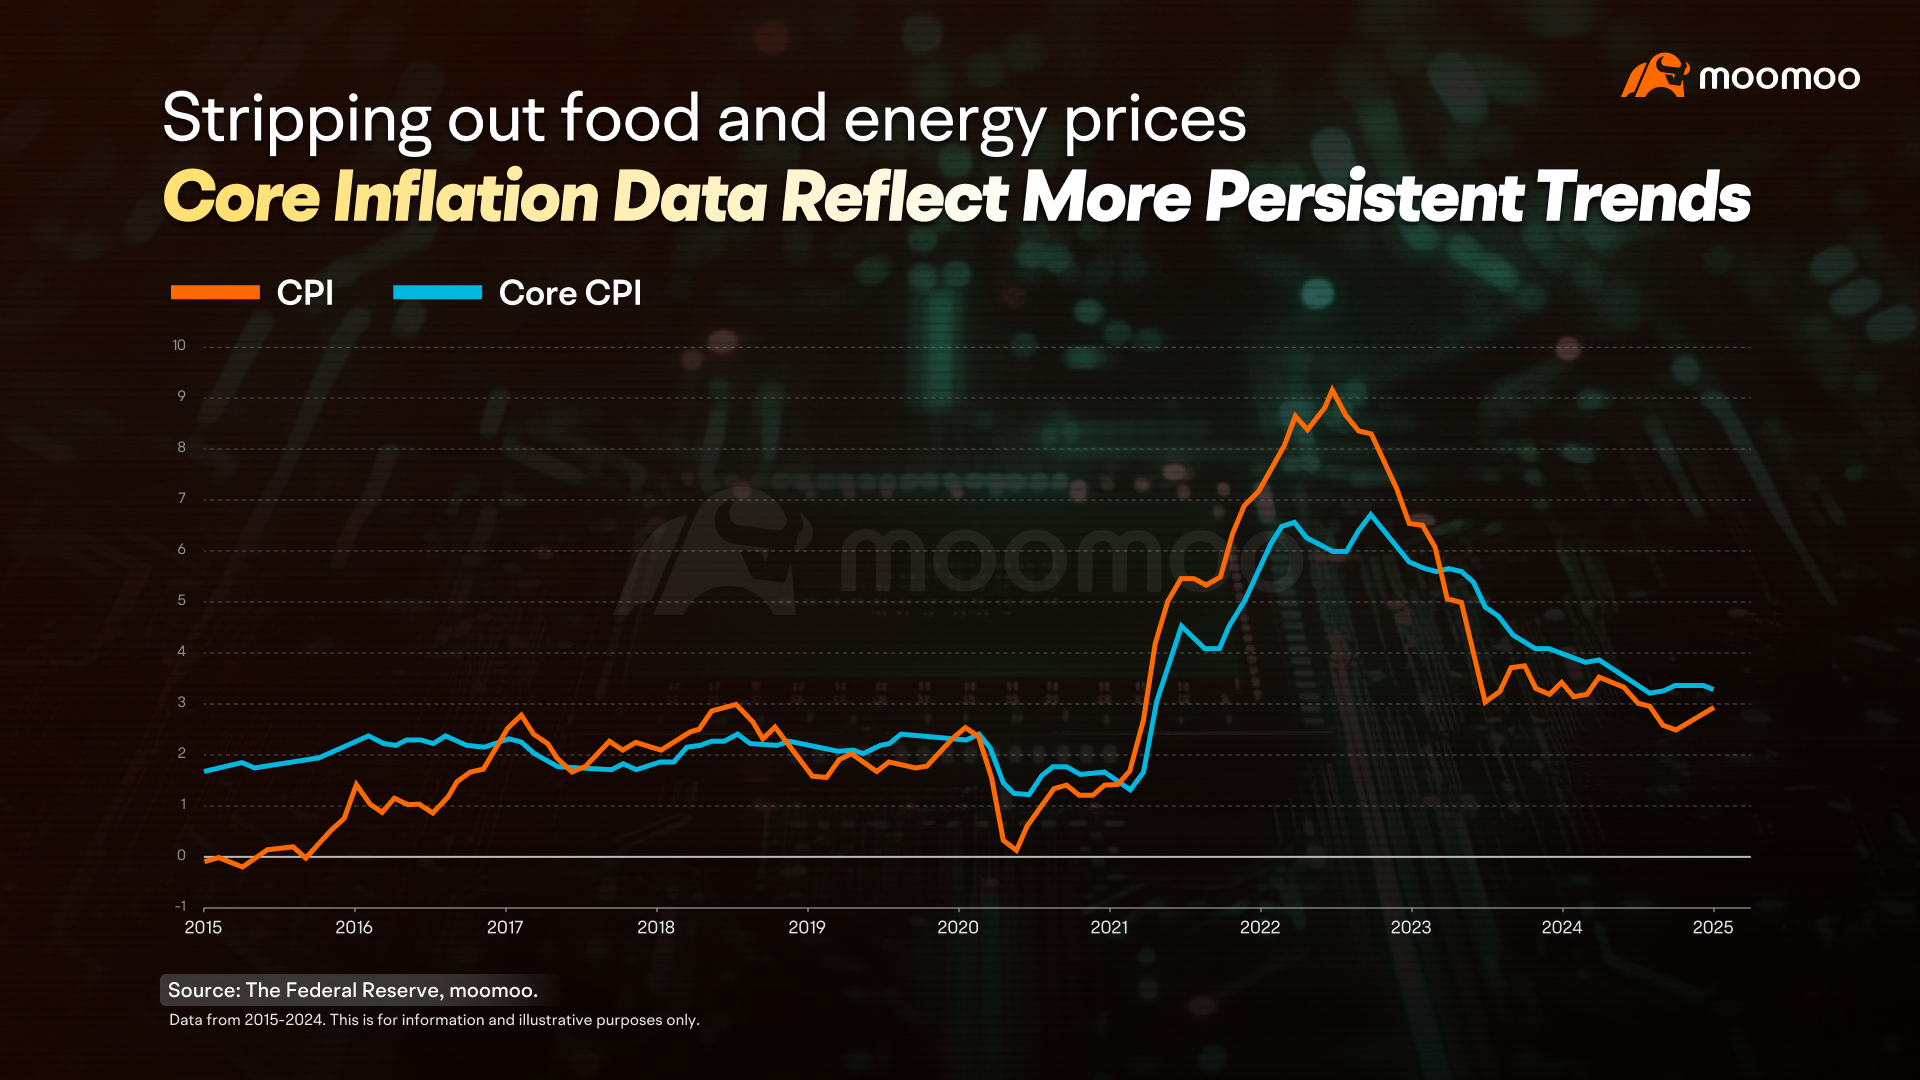
Well, the core figures strip out food and energy prices, which are usually volatile due to weather and geopolitical factors.
The core data provides a more stable view, helping analysts focus on long-term inflation trends.
4. Interpreting Inflation Indicators
With moomoo, you can easily access these inflation indicators. Just navigate to Markets and swipe up to the Economic Calendar.
Use the search box to locate specific indicators and access their details, including release dates, historical trends, and past data.
Worried about missing a release? The "Economic Calendar" lets you subscribe to alerts so you won't miss an update.
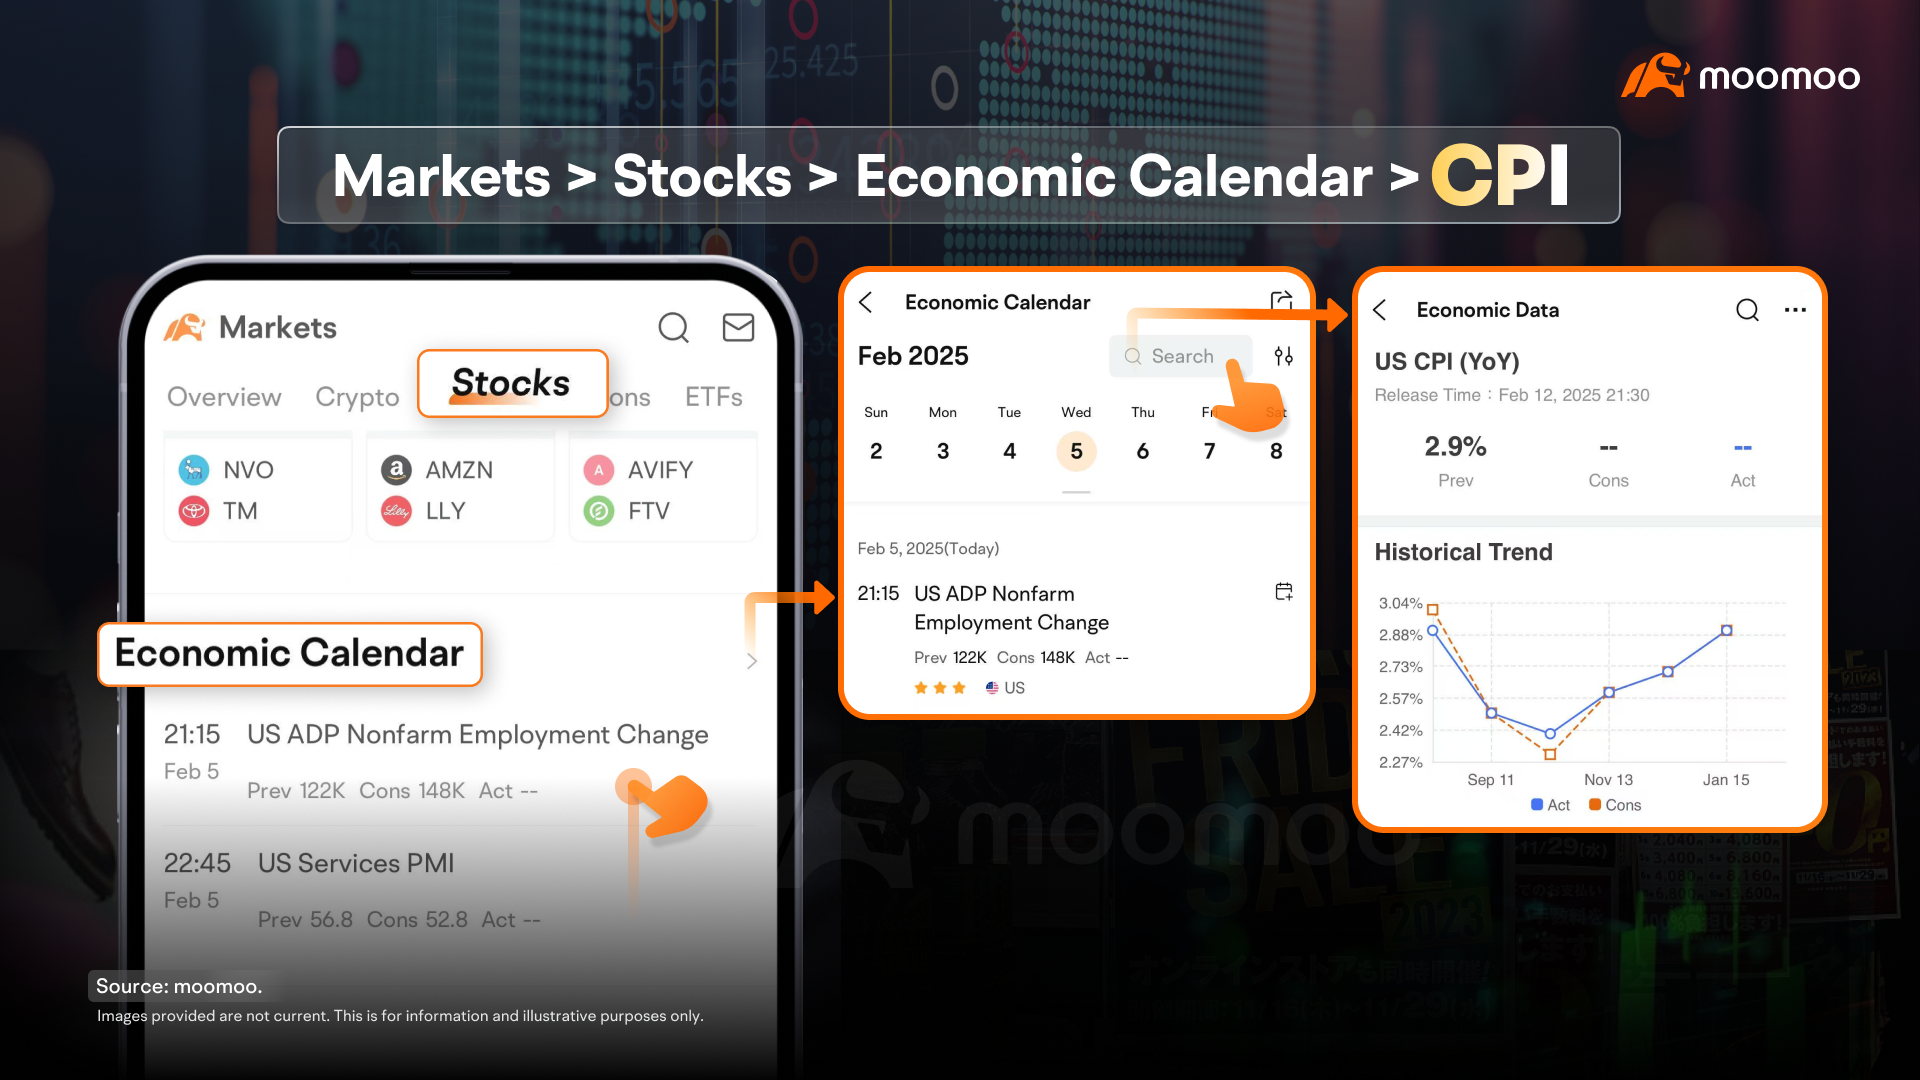
A common focus method is on year-over-year (YoY) changes, comparing growth to the same period last year. Moomoo also provides market consensus (Cons) and actual values (Act).
If the actual figure surpasses expectations, the market might anticipate stronger inflation pressures; if it falls short, it could signal easing.
And that's a wrap for this macro lesson! If you found this session helpful, feel free to like, share, and leave your comments. Thanks for joining, and see you next time!
This presentation is for informational and educational use only and is not a recommendation or endorsement of any particular investment or investment strategy. Investment information provided in this content is general in nature, strictly for illustrative purposes, and may not be appropriate for all investors. Read more