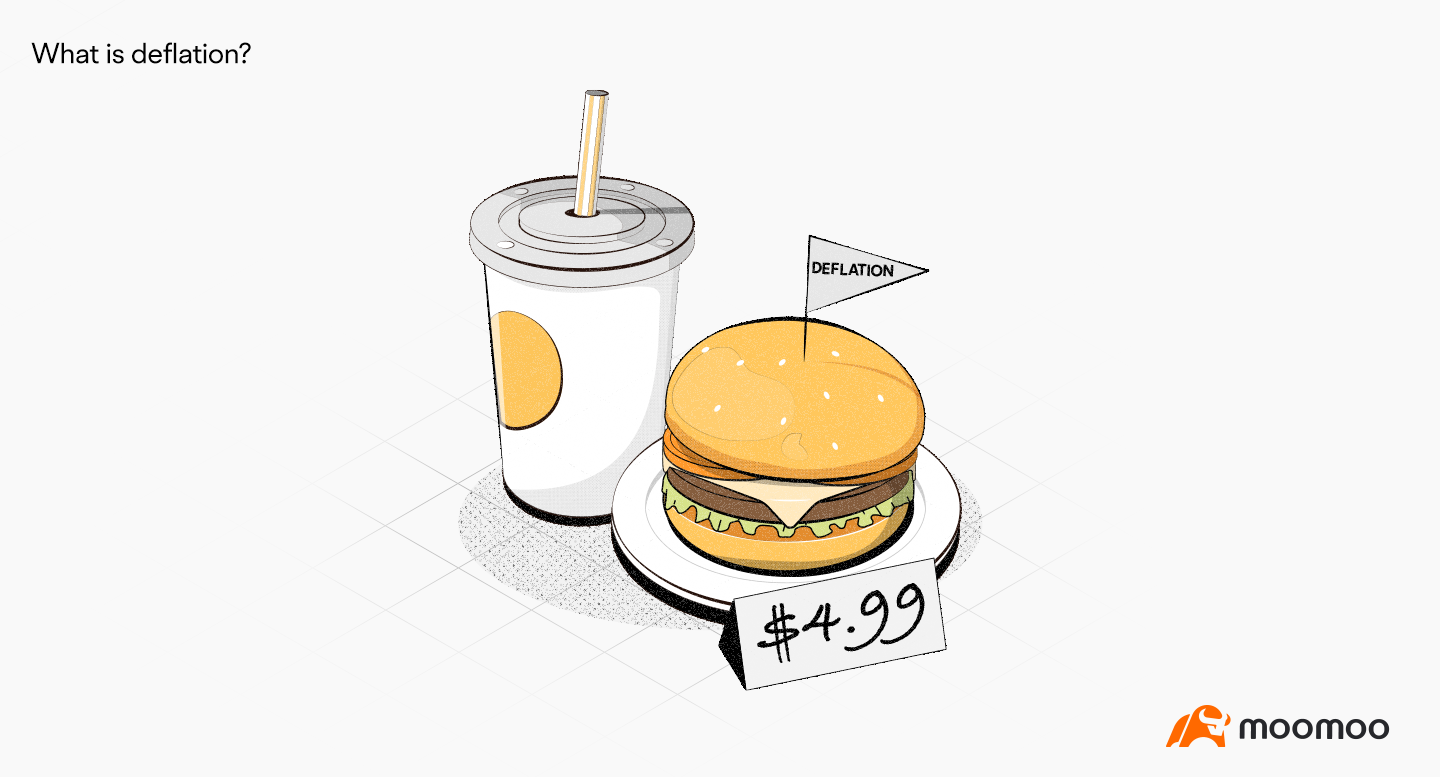
What is Deflation?
Key Takeaways
● Deflation is a decrease in the general price level of goods and services in economics.
● Inflation rate = (Final CPI Index Value - Initial CPI Value) / Initial CPI Value*100%
● By definition, a fall in the supply of money or financial instruments redeemable in money can result in monetary deflation.
Understanding
Deflation is when the inflation rate is negative. When consumer prices fall uniformly, it happens. Typically, a decline in consumer spending and a reduction in the demand for goods and services cause price reductions and the ensuing deflation. Increased purchasing power results from deflation.
Deflation can be a sign of a recession or other economic instability, despite the fact that many customers could view this as a positive development. Typically, a recession is characterized by falling stock prices, fewer jobs, and lower earnings.
The Consumer Price Index (CPI) is in charge of calculating the rates of inflation and deflation.
What Causes Deflation
Deflation is primarily brought on by a decline in the cost of consumer goods and services, which happens when there is a reduction in the demand for such goods and services relative to the supply.
A decrease in the amount of money available could be the cause of this decreased demand. The Federal Reserve has the power to alter the amount of money in circulation and make it more difficult to get money by boosting lending interest rates. People spend less when it's tougher to earn money.
A rise in output may also lead to deflation. Companies can charge less for products when manufacturing them becomes simpler and less expensive.
Lastly, a decline in government spending may have an impact on demand. Let's imagine, for illustration, that infrastructure funding is reduced by the government. Some families in those affected areas, like the construction industry, suddenly have less money to spend. Prices normally decrease as demand declines, and vice versa.
A Historical Example of Deflation
Possibly the most well-known instance of deflation is the Great Depression, which got its start on October 29, 1929, when the stock market crashed. During those years, the inflation rate decreased to a negative figure, occasionally dropping below -10%.
Many people didn't have any money to spend because they were either laid off or weren't paid enough. During the Great Depression, the unemployment rate was close to 25%. The Great Depression serves as a perfect illustration of how the deflationary spiral descends.
This presentation is for informational and educational use only and is not a recommendation or endorsement of any particular investment or investment strategy. Investment information provided in this content is general in nature, strictly for illustrative purposes, and may not be appropriate for all investors. Read more
Recommend

What is Retirement Planning?
What is Market Sentiment?
What is the Debt Ratio?

What is a Balance Sheet?
What is Qualitative Analysis?
What is Simple Moving Average (SMA)?
What is Swing Trading?
What is the Securities and Exchange Commission(SEC)?
What is Sector Rotation?
What is the Stock Market?
How to read level 2 market data - using an order book for trading strategies
What are Bull and Bear Markets?
What is EPS?
What Is an Initial Public Offering (IPO)?
What is Circuit Breakers?
What is Over-the-Counter (OTC)?
What is a Security?
What is the S&P 500?
What is Technical Analysis?
What Is Equity?
What is the Dow Jones Industrial Average
What is Paper Trading?
What is Price-Volume Relationship?
What is a Fiscal Year?
What is the Federal Open Market Committee (FOMC)?
What is Day Trading?
What are CPI, PPI and PMI?
What is Quantitative Analysis?
What is a Value Stock?
What is an Investment Portfolio?
What are Dual Listing and Secondary Listing?
What Is Moving Average Convergence Divergence(MACD)?
What is a Candlestick?
What is an Investment?
What is a Stock?
What is Return on Investment (ROI)?
What is Net Margin?
What is the Nasdaq Composite?
Brokerage Account
What is Deflation?
What is ADR?
What is competitive bidding?
What is Retirement Planning?
What is Market Sentiment?
What is the Debt Ratio?
What is a Balance Sheet?
What is Qualitative Analysis?
What is Simple Moving Average (SMA)?
What is Swing Trading?
What is the Securities and Exchange Commission(SEC)?
What is Sector Rotation?
What is the Stock Market?
How to read level 2 market data - using an order book for trading strategies
What are Bull and Bear Markets?
What is EPS?
What Is an Initial Public Offering (IPO)?
What is Circuit Breakers?
What is Over-the-Counter (OTC)?
What is a Security?
What is the S&P 500?
What is Technical Analysis?
What Is Equity?
What is the Dow Jones Industrial Average
What is Paper Trading?
What is Price-Volume Relationship?
What is a Fiscal Year?
What is the Federal Open Market Committee (FOMC)?
What is Day Trading?
What are CPI, PPI and PMI?
What is Quantitative Analysis?
What is a Value Stock?
What is an Investment Portfolio?
What are Dual Listing and Secondary Listing?
What Is Moving Average Convergence Divergence(MACD)?
What is a Candlestick?
What is an Investment?
What is a Stock?
What is Return on Investment (ROI)?
What is Net Margin?
What is the Nasdaq Composite?
Brokerage Account
What is Deflation?
What is ADR?
What is competitive bidding?