What are Bull and Bear Markets?
Key Takeaways
Bull and bear markets are common terms among investors.
A bull market indicates optimism and growth, while a bear market reflects pessimism and decline.
The generally accepted rule of thumb about the bull/bear market is +/- 20%.
Understanding bull and bear markets
What are the most common lingoes among investors? The bull market and the bear market must be on the list.
Bull markets and bear markets are usually used to describe market trends. There is no regulation on the extent of market changes, but the generally accepted rule of thumb for investors is +/- 20%. In other words, a bull market means that the upward market has risen by 20% from the bottom, while a bear market means that the downward market has fallen by 20% from the top.
There is no perfect strategy to survive through all bull and bear markets. But keep in mind that overall perception of the broader market is important for investors.
Bull market vs. Bear market
The stock market is a barometer of the economy. Bull markets are usually full of bullish voices, and stock prices continue to rise, accompanied by a strong economy. For instance, investors put hot money into the market, and companies often flood the IPO market and raise more funds.
A bear market usually occurs when the economy is on the brink of or in a recession. Bear markets are usually shrouded in pessimism. Investors tend to withdraw money from the market and wait out the bear market.
When investors are complacent and go in for speculation, a bull market can easily turn into a bubble, and then fall into a bear market.
Example
Take the $S&P 500 index(.SPX.US)$ as an example.
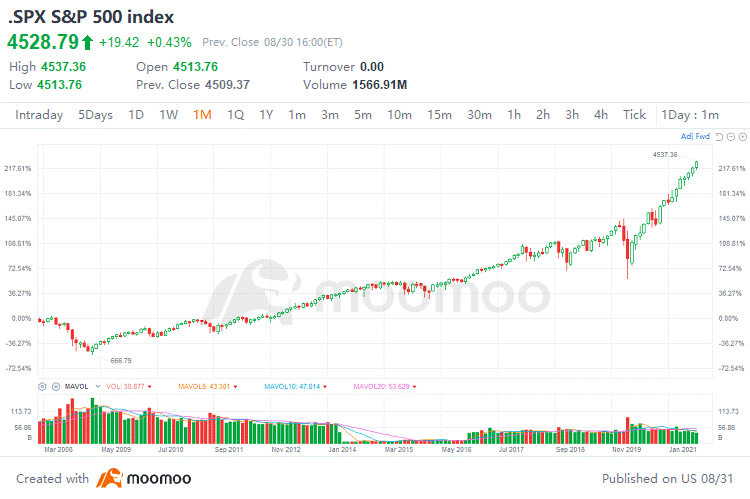
In February and March 2020, the market took a catastrophic hit by Covid-19 and economic recession. The circuit breaker was triggered four times for eight consecutive trading days. The SPX has plunged as much as 33% over that period.
With the help of global low interest-rate policies, government financial aid, and vaccine promotion, the market swiftly rebounded from the bottom and marched into new highs after shortly falling into a bear market.
In 2021, the SPX continued to hit new records. If we ignore the setbacks in 2020, we are still in the longest bull market in history since 2009, boosted by the information revolution, low interest rates, and robust corporate earnings, among others.
This presentation is for informational and educational use only and is not a recommendation or endorsement of any particular investment or investment strategy. Investment information provided in this content is general in nature, strictly for illustrative purposes, and may not be appropriate for all investors. Read more
Recommend

What is Retirement Planning?
What is Market Sentiment?
What is the Debt Ratio?

What is a Balance Sheet?
What is Qualitative Analysis?
What is Simple Moving Average (SMA)?
What is Swing Trading?
What is the Securities and Exchange Commission(SEC)?
What is Sector Rotation?
What is the Stock Market?
How to read level 2 market data - using an order book for trading strategies
What are Bull and Bear Markets?
What is EPS?
What Is an Initial Public Offering (IPO)?
What is Circuit Breakers?
What is Over-the-Counter (OTC)?
What is a Security?
What is the S&P 500?
What is Technical Analysis?
What Is Equity?
What is the Dow Jones Industrial Average
What is Paper Trading?
What is Price-Volume Relationship?
What is a Fiscal Year?
What is the Federal Open Market Committee (FOMC)?
What is Day Trading?
What are CPI, PPI and PMI?
What is Quantitative Analysis?
What is a Value Stock?
What is an Investment Portfolio?
What are Dual Listing and Secondary Listing?
What Is Moving Average Convergence Divergence(MACD)?
What is a Candlestick?
What is an Investment?
What is a Stock?
What is Return on Investment (ROI)?
What is Net Margin?
What is the Nasdaq Composite?
Brokerage Account
What is Deflation?
What is ADR?
What is competitive bidding?
What is Retirement Planning?
What is Market Sentiment?
What is the Debt Ratio?
What is a Balance Sheet?
What is Qualitative Analysis?
What is Simple Moving Average (SMA)?
What is Swing Trading?
What is the Securities and Exchange Commission(SEC)?
What is Sector Rotation?
What is the Stock Market?
How to read level 2 market data - using an order book for trading strategies
What are Bull and Bear Markets?
What is EPS?
What Is an Initial Public Offering (IPO)?
What is Circuit Breakers?
What is Over-the-Counter (OTC)?
What is a Security?
What is the S&P 500?
What is Technical Analysis?
What Is Equity?
What is the Dow Jones Industrial Average
What is Paper Trading?
What is Price-Volume Relationship?
What is a Fiscal Year?
What is the Federal Open Market Committee (FOMC)?
What is Day Trading?
What are CPI, PPI and PMI?
What is Quantitative Analysis?
What is a Value Stock?
What is an Investment Portfolio?
What are Dual Listing and Secondary Listing?
What Is Moving Average Convergence Divergence(MACD)?
What is a Candlestick?
What is an Investment?
What is a Stock?
What is Return on Investment (ROI)?
What is Net Margin?
What is the Nasdaq Composite?
Brokerage Account
What is Deflation?
What is ADR?
What is competitive bidding?