XEQT vs. VEQT: What's the Difference Between These Two Popular ETFs in Canada?

In the field of investing, how to balance risk and return is a question that every investor should consider. Many investors likely achieve this balance through a diversified portfolio. Are there good targets in Canada that can help investors achieve their goals of balancing risk and return through diversified investments? XEQT and VEQT, as two ETFs traded in the Canadian market and focused on global asset allocation, offer such investment opportunities.
This article aims to discuss the differences between these two ETFs, thereby helping investors better understand these financial products and achieve their investment objectives.
What are XEQT and VEQT?
XEQT (iShares Core Equity ETF Portfolio) and VEQT (Vanguard All-Equity ETF Portfolio) both belong to the "EQT" series of ETFs, which typically refers to funds that focus on equity investments. Here, "EQT" can be understood as an abbreviation for "Equity," meaning that these ETFs primarily or exclusively invest in the stock market. Investors who choose such ETFs are usually those seeking higher growth potential and are also willing to take on higher risks. Stocks are generally considered to have higher volatility and potential returns compared to other asset types such as bonds. Therefore, the "EQT" series ETFs may attract investors who have a good understanding of the market and can withstand market fluctuations.
XEQT and VEQT are both ETFs that operate by holding a portfolio of ETFs, indirectly holding a vast array of stocks from around the world. According to the official data, XEQT holds 8,987 stocks, while VEQT holds an even larger number, reaching 13,853.
What's similar is that, since XEQT and VEQT both hold multiple other ETFs, they track multiple indices and aim to achieve long-term capital appreciation by providing exposure to equity securities.
Key Facts | ||
Symbol | VEQT | XEQT |
AUM | CAD 5.14B (as of 20 Sep 2024) | CAD 4.769B (as of 20 Sep 2024) |
Exchange | Toronto Stock Exchange | Toronto Stock Exchange |
VEQT vs XEQT: What's the difference?
VEQT vs XEQT: Fees
Management Fee | MER | |
VEQT | 0.22% | 0.24% |
XEQT | 0.18% | 0.20% |
Management Fee and MER (Management Expense Ratio) are both fees related to the operation of a fund. The management fee refers to the fee charged by an investment fund or asset management company for providing professional management services to investors, which typically covers the costs of the fund management company's daily operations. MER is an indicator that measures all operating costs and expenses of a fund, including not only the management fee but also other costs related to the operation of the fund, such as custody fees, audit fees, legal fees, and marketing expenses. From the data in the above chart, it can be seen that the cost of VEQT's fees is higher than that of XEQT.
VEQT vs XEQT: Holdings
First, let's look at the direct holdings of the two ETFs.
VEQT | XEQT | ||
Name | Weight | Name | Weight |
Vanguard U.S. Total Market Index ETF | 44.72% | iShares Core S&P Total U.S. Stock Market ETF | 45.39% |
Vanguard FTSE Canada All Cap Index ETF | 30.54% | iShares Core S&P/TSX Capped Composite Index ETF | 24.88% |
Vanguard FTSE Developed All Cap ex North America Index ETF | 18.01% | iShares Core MSCI EAFE IMI Index ETF | 24.47% |
Vanguard FTSE Emerging Markets All Cap Index ETF | 6.69% | iShares Core MSCI Emerging Markets IMI Index ETF | 4.96% |
USD Cash | 0.17% | ||
CAD Cash | 0.12% | ||
As of 31 Aug 2024 | As of 31 Aug 2024 | ||
Then let's take a look at the top ten individual stock holdings of these two ETFs.
VEQT | XEQT | ||||
Name | Weight | Market Allocation | Name | Weight | Market Allocation |
Appl Inc (AAPL) | 2.74% | US | Appl Inc (AAPL) | 2.74% | US |
Microsoft Corp (MSFT) | 2.55% | US | Microsoft Corp (MSFT) | 2.58% | US |
NVIDIA Corp (NVDA) | 2.29% | US | NVIDIA Corp (NVDA) | 2.44% | US |
Royal Bank of Canada (RY) | 2.16% | CA | Royal Bank of Canada (RY) | 1.71% | CA |
Amazon.com Inc (AMZN) | 1.37% | US | Amazon.com Inc (AMZN) | 1.36% | US |
Toronto-Dominion Bank/The (TD) | 1.34% | CA | Toronto-Dominion Bank/The (TD) | 1.06% | CA |
Shopify Inc (SHOP) | 1.13% | CA | Meta Platforms Inc Class A (META) | 0.95% | US |
Enbridge Inc (ENB) | 1.09% | CA | Shopify Inc (SHOP) | 0.90% | CA |
Canadian Pacific Kansas City Ltd (CP) | 0.98% | CA | Enbridge Inc (ENB) | 0.86% | CA |
Canadian Natural Resources Ltd (CNQ) | 0.97% | CA | Alphabet Inc. Class A (GOOGL) | 0.80% | US |
As of 31 Aug 2024 | As of 31 Aug 2024 | ||||
From the data provided, it is evident that VEQT and XEQT hold nearly all of their positions in ETFs, thereby indirectly owning stocks. Although they hold different ETFs, structurally, both VEQT and XEQT's ETFs focus to varying degrees on the U.S. market, the Canadian market, markets outside of North America, and emerging markets. Judging from the top ten holdings, it seems that VEQT and XEQT have a significant focus on the North American market and are keen on the technology sector. Now, let's examine the structural differences between VEQT and XEQT.
>> Learn more: Best ETFs for RRSP in 2026: Maximize Your Tax-Free Growth
VEQT vs XEQT: Construction
Regional Exposure
Region | Fund | |
VEQT | XEQT | |
United States of America | 44.9% | 44.74% |
Canada | 30.5% | 24.55% |
Europe | 10.8% | 11.39% |
Other Regions | 7.2% | 12.76% |
Emerging Markets | 6.3% | 5.12% |
As of 31 Aug 2024 | As of 20 Sep 2024 | |
Source: Data compiled from official website disclosure.
It can be observed that VEQT and XEQT have a similar overall structure in terms of regional exposure, both primarily investing in the U.S. market and the Canadian domestic market. However, there are certain differences in the proportions. In comparison, VEQT pays more attention to the Canadian domestic market and emerging markets.
Industry Exposure
From an industry exposure perspective, VEQT and XEQT's holdings span multiple sectors, including Technology, Financials, Industrials, Consumer Discretionary, Energy, Health Care, Basic Materials, Consumer Staples, Utilities, Real Estate, and Telecommunications. They have a significant investment in the technology and financial sectors. According to the official data published, as of August 31, 2024, VEQT's investment in the technology and financial sectors accounted for 20.84% and 20.05% respectively. As of September 20, 2024, among XEQT's 8,987 supported stocks, there are 1,053 in the technology sector and 1,245 in the financial sector.
VEQT vs XEQT: Methodology
What methodology does VEQT and XEQT use for the distribution of their investment portfolios? Especially why they both primarily invest in the U.S. market, even surpassing the proportion of their domestic market, which is worth discussing. It should be clear that VEQT and XEQT are aimed at Canadian investors in the Canadian market. Allocating a certain proportion of domestic assets in the asset allocation is quite necessary, which can improve tax efficiency and avoid currency risks to a certain extent. From the data mentioned above, it is known that the standard for the domestic asset allocation ratio of VEQT and XEQT is about 30% and 25%, respectively. If the remaining funds are allocated according to the market capitalization weight of that market in the global market, and the U.S. market accounts for about 60.5% of the global investable stock market value.It can be estimated what the allocation ratio of VEQT and XEQT in the U.S. stock market should be.
appropriate allocation ratio | Actual allocation ratio | |
VEQT | (1-30%)×60%=42% | 44.9% |
XEQT | (1-25%)×60%=45% | 44.74% |
It can be seen that the two sets of data are close, so the significant weight of the U.S. stock market capitalization in the global market is an important reason for VEQT and XEQT to allocate a large proportion of assets to U.S. stocks. It can also be anticipated that if there are significant changes in the regional weight of the world market capitalization in the future, it is likely to lead to changes in the asset allocation of these two ETFs, which is also reflected in the prospectuses of both ETFs.
VEQT vs XEQT: Historical Performance
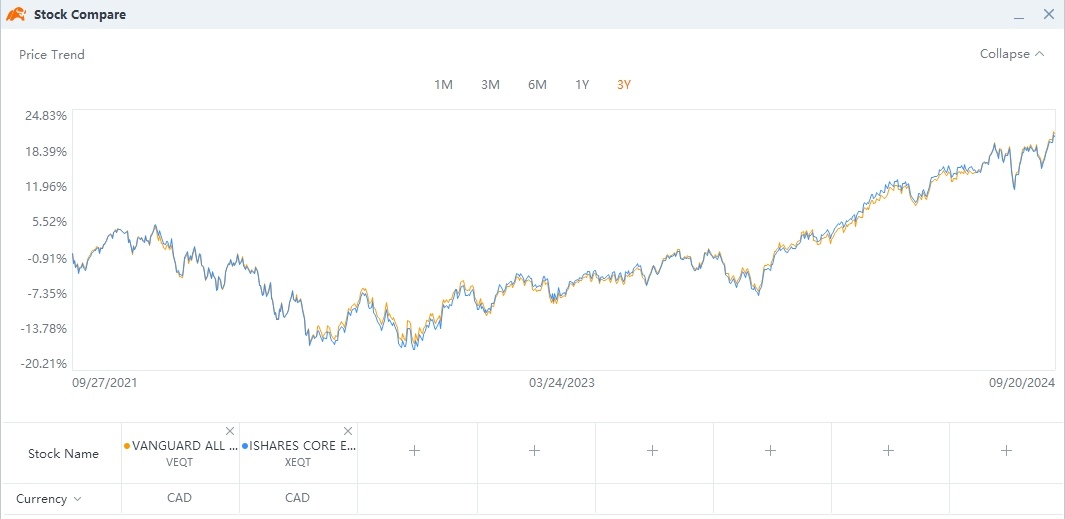
Here is the comparison chart of trends.
Here is the comparison of return data.
Average Annual | Incept. | ||||
1y | 3y | 5y | |||
Total Return | VEQT | 21.14% | 7.46% | 11.57% | 11.68% |
XEQT | 21.33% | 7.56% | 11.77% | 11.83% | |
It can be seen that historically, VEQT and XEQT have very similar performance. Possibly due to XEQT's relatively lower expense ratio, XEQT's return data performs slightly better than VEQT, but the difference is negligible.
VEQT vs XEQT: How to choose?
After thoroughly understanding VEQT and XEQT, it is evident that as two Canadian ETFs that invest broadly in global markets, they have very diversified portfolios, with investments widely distributed across global regions primarily centered in North America, and covering a variety of industries. Due to their similar investment strategies, the performance of both ETFs in terms of returns is also similar. Therefore, there is no need to be overly concerned about choosing between the two; if you care about the slight advantages in expense ratios and return data, you can opt for XEQT. If you prefer Vanguard's products, you can choose VEQT.
Finally, please note that both of these ETFs ultimately invest in the stock market and are considered medium to high-risk products. Please fully consider your own risk tolerance before deciding whether to invest or not. This article does not constitute any investment advice.
This presentation is for informational and educational use only and is not a recommendation or endorsement of any particular investment or investment strategy. Investment information provided in this content is general in nature, strictly for illustrative purposes, and may not be appropriate for all investors. Read more