How to Understand and Analyze Options Chains: A Comprehensive Guide
Key Takeaways
Options chains are powerful tools for traders and investors, providing a comprehensive overview of all available option contracts for a specific underlying asset. Mastering the ability to read and analyze an options chain is crucial for making informed trading decisions, whether for speculation, hedging, or income generation.
This article will delve into the intricacies of options chains, explaining their components, key data points, and practical applications in various trading strategies. By understanding the dynamics of bid/ask spreads, volume, open interest, implied volatility, and the Greeks, traders can identify opportunities, assess risks, and enhance their overall options trading proficiency.
This article will delve into the intricacies of options chains, explaining their components, key data points, and practical applications in various trading strategies. By understanding the dynamics of bid/ask spreads, volume, open interest, implied volatility, and the Greeks, traders can identify opportunities, assess risks, and enhance their overall options trading proficiency.
Introduction of Options
Options are flexible financial derivatives that give you the right, but not the obligation, to buy or sell an asset at a set price (strike price) by a specific date (expiration date). They offer leverage, letting you control larger positions with less capital, making them appealing to both retail and institutional traders. Using options to speculate, hedge, or generate income, and understanding their mechanics is key to navigating an options chain effectively.
What is an Options Chain?
An options chain, also known as an options matrix, is a comprehensive table that displays all available option contracts for a specific underlying security. These contracts are typically organized by expiration date and strike price, providing traders with a quick and detailed overview of the market for that particular asset. The options chain is a vital tool for anyone involved in options trading, as it consolidates a vast amount of information, including real-time prices, trading volume, and implied volatility, for both call and put options. While its initial appearance might seem complex due to the sheer volume of data, learning to navigate and interpret an options chain is fundamental for making informed trading decisions and identifying potential opportunities in the derivatives market. As options continue to gain popularity among both retail and institutional investors, mastering the intricacies of the options chain has become an indispensable skill for expanding trading strategies beyond traditional stock investments.
The Basics of Options Contracts
An options contract is a financial derivative that grants the buyer the right, but not the obligation, to buy or sell an underlying asset at a predetermined price (known as the strike price) on or before a specified date (the expiration date). This fundamental characteristic distinguishes options from direct ownership of the underlying asset. The flexibility and leverage offered by options make them powerful instruments for various financial objectives, including speculation, hedging, and income generation.
There are two primary types of options contracts:
Call Options: A call option gives the holder the right to buy the underlying asset at the strike price. Investors typically buy call options when they anticipate an increase in the underlying asset's price. Conversely, sellers (writers) of call options are obligated to sell the underlying asset if the buyer chooses to exercise their rights.
Put Options: A put option gives the holder the right to sell the underlying asset at the strike price. Investors typically buy put options when they anticipate a decrease in the underlying asset's price, using them as a way to profit from a downturn or to protect against potential losses in an existing long position. Sellers (writers) of put options are obligated to buy the underlying asset if the buyer exercises their right.
Key terms associated with options contracts include:
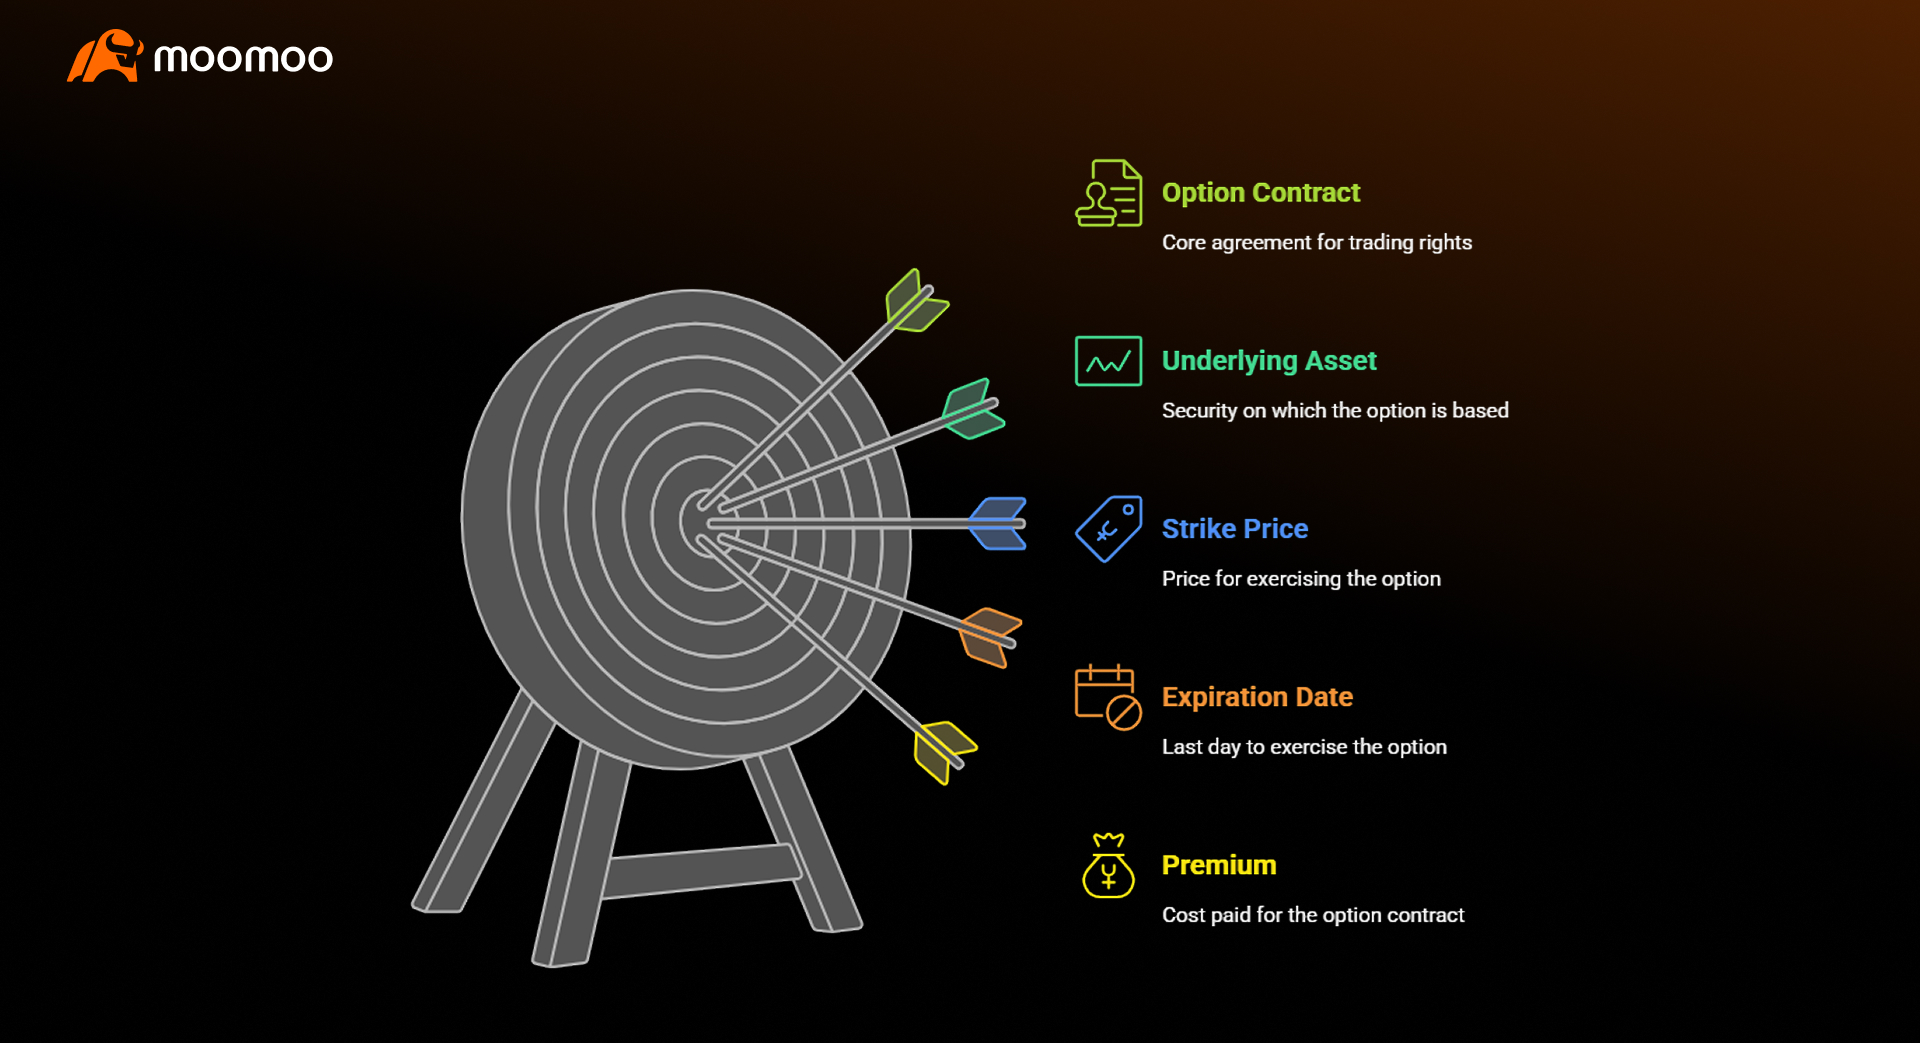
Underlying Asset: The security (e.g., stock, ETF, index, commodity) on which the option contract is based. Example: If you are trading options on a well-known technology company, the underlying asset is that company's stock.
Strike Price: The fixed price at which the underlying asset can be bought or sold if the option is exercised. Example: A call option with a strike price of $180 on a company's stock means the holder can buy shares of that stock at $180 each.
Expiration Date: The last day on which the option contract can be exercised. After this date, the contract becomes worthless if not exercised. Example: An option expiring on the third Friday of June means it can be exercised up to that date.
Premium: The price paid by the buyer to the seller for the option contract. This is the cost of acquiring the right conveyed by the option. Example: If an option contract costs $2.50, and each contract represents 100 shares, the total premium paid is $250 ($2.50 x 100).
In-the-Money (ITM): An option is ITM if it has intrinsic value. For a call, this means the underlying asset's price is above the strike price. For a put, it means the underlying asset's price is below the strike price. Example: If a stock is trading at $185, a call option with a $180 strike price is ITM. A put option with a $190 strike price is also ITM.
Out-of-the-Money (OTM): An option is OTM if it has no intrinsic value. For a call, this means the underlying asset's price is below the strike price. For a put, it means the underlying asset's price is above the strike price. Example: If a stock is trading at $185, a call option with a $190 strike price is OTM. A put option with a $180 strike price is also OTM.
At-the-Money (ATM): An option is ATM if the underlying asset's price is equal to or very close to the strike price. Example: If a stock is trading at $185, a call or put option with a $185 strike price is ATM.
Options contracts are standardized, with one contract typically representing 100 shares of the underlying stock. This standardization facilitates trading on exchanges. The value of an options contract is influenced by several factors, including the price of the underlying asset, the strike price, the time remaining until expiration, and the volatility of the underlying asset. Understanding these basic components is essential for interpreting the data presented in an options chain and for developing effective options trading strategies.
Components of an Options Chain
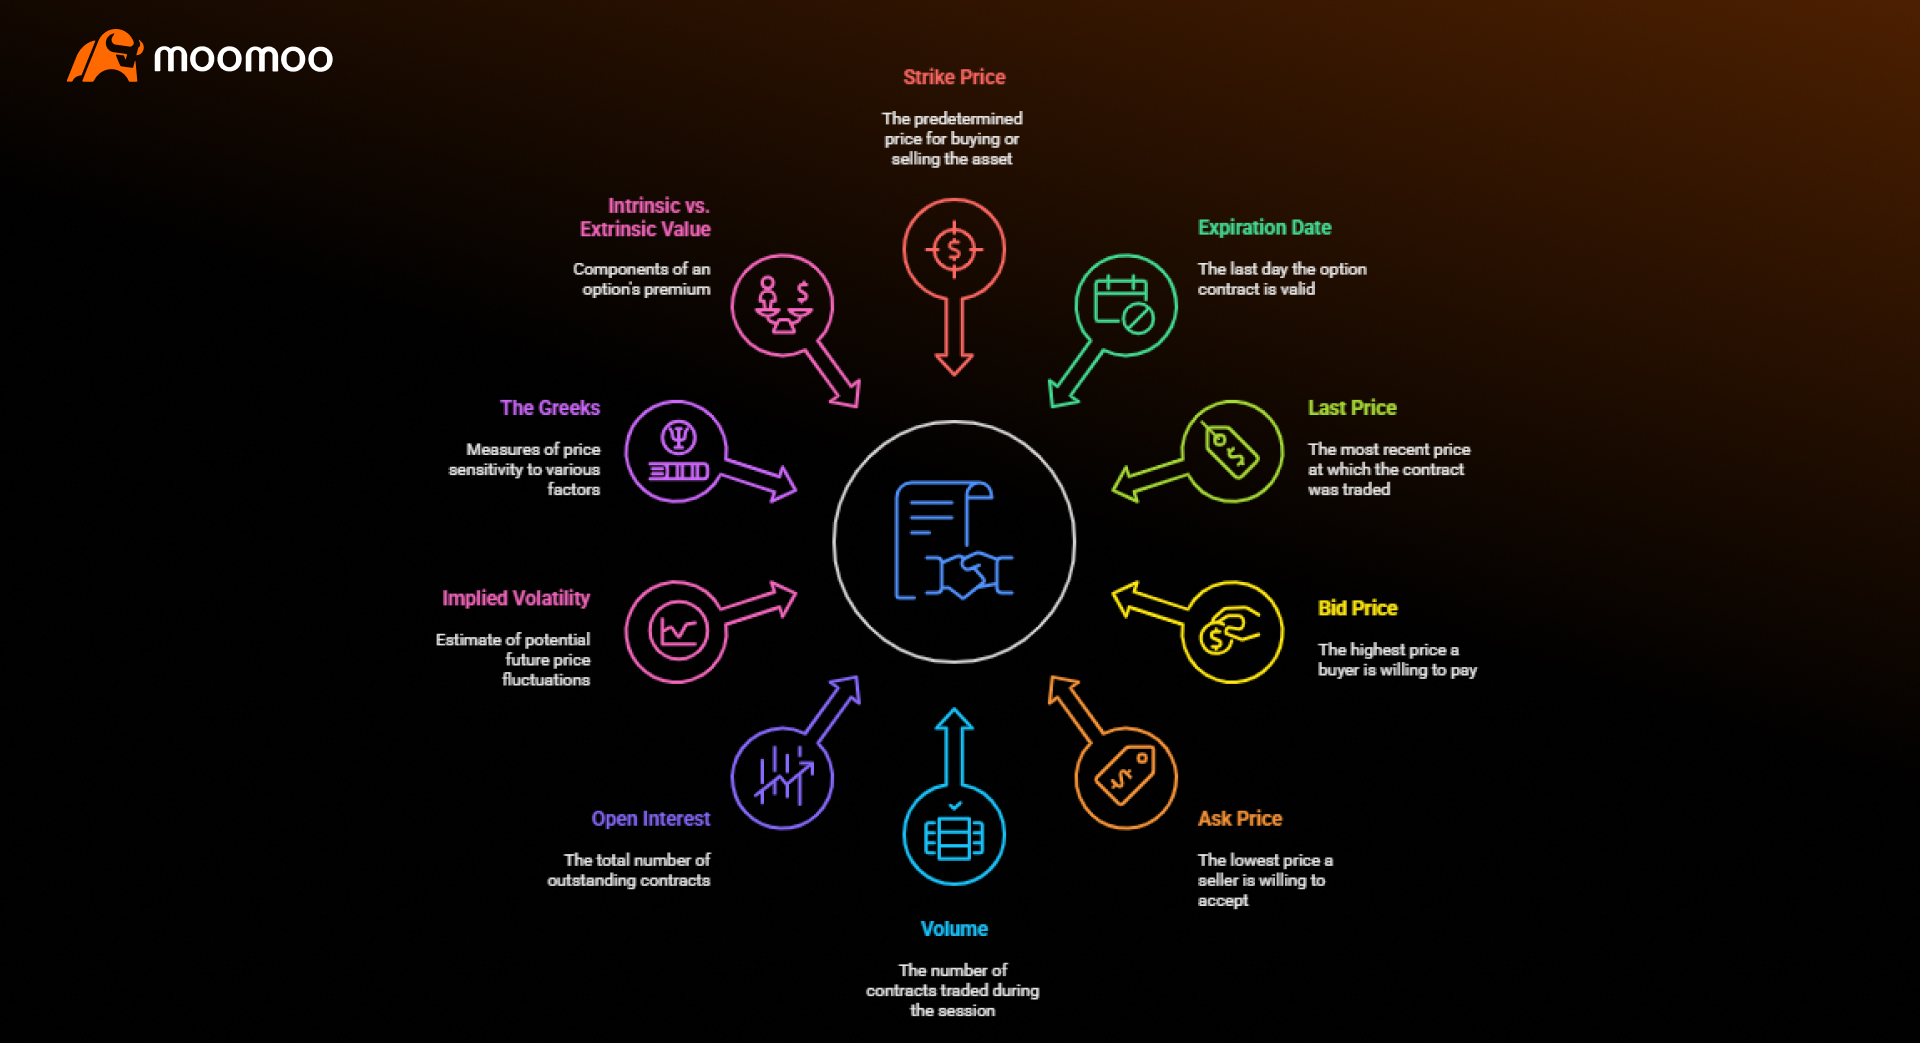
An options chain is typically presented in a tabular format, with distinct sections for call options and put options. Each row in the table represents a different strike price, while the columns display various data points crucial for analyzing each contract. These data points include:
Strike Price: The predetermined price at which the underlying asset can be bought or sold.
Expiration Date: The last day the option contract is valid.
Last Price: The most recent price at which an option contract was traded.
Bid Price: The highest price a buyer is willing to pay.
Ask Price: The lowest price a seller is willing to accept.
Volume: The number of contracts traded during the current session.
Open Interest: The total number of outstanding contracts.
Implied Volatility (IV): A forward-looking estimate of potential future price fluctuations.
The Greeks: Measures quantifying an option's price sensitivity to various factors (Delta, Gamma, Theta, Vega, Rho).
Intrinsic Value vs. Extrinsic Value (Time Value): Components of an option's premium.
Understanding these components is key to effectively utilizing an options chain for trading decisions. The following section will explain these key data points in more detail.
Key Data Points in an Options Chain Explained
Last Price & Bid/Ask Spread
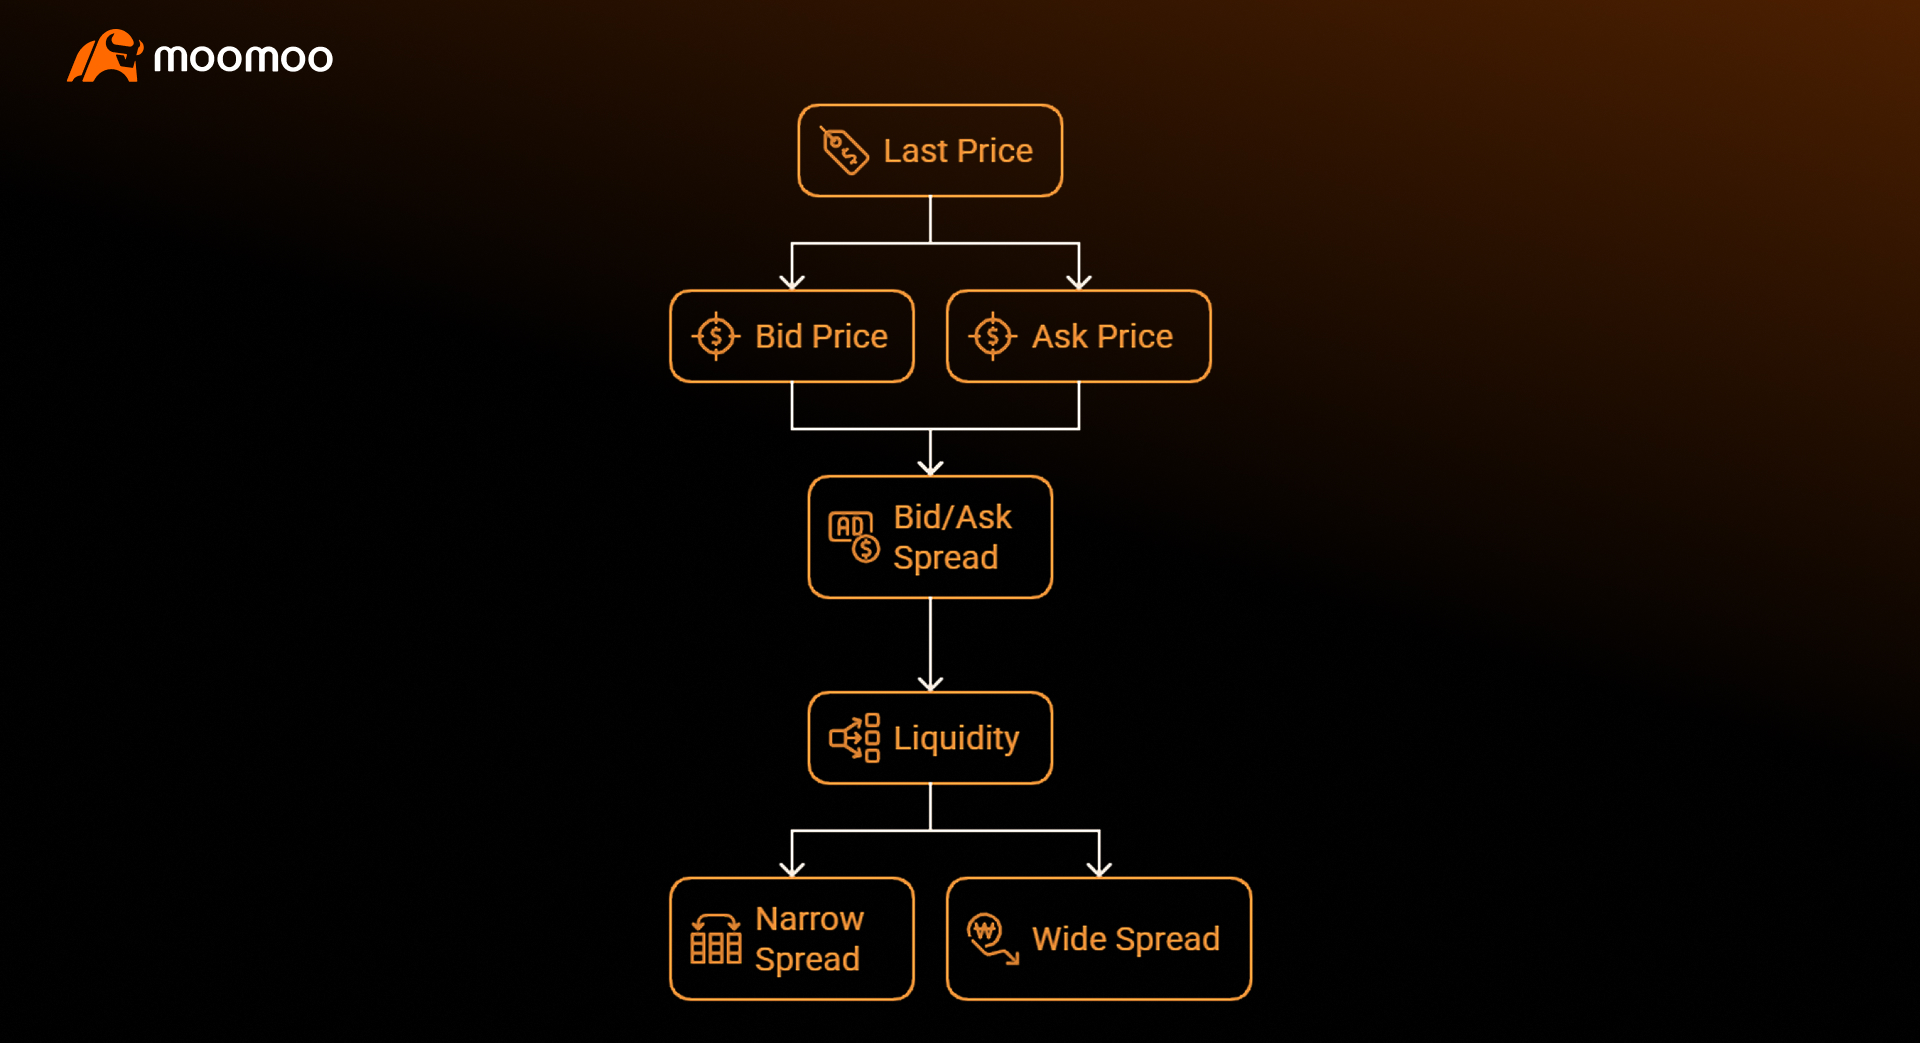
Last Price
The last price represents the most recent price at which an option contract was traded. This provides an immediate reference point for the contract's current market value. Example: If an option's last price is $1.50, it means the most recent trade for that contract occurred at $1.50.
Bid Price
The bid price is the highest price a buyer is currently willing to pay for a particular option contract. It reflects the demand for that option in the market. Example: If the bid price for an option is $1.40, a buyer is willing to pay $1.40 for it.
Ask Price
The ask price (or offer price) is the lowest price a seller is currently willing to accept for the same option contract. It represents the supply of that option in the market. Example: If the ask price for an option is $1.60, a seller is willing to sell it for $1.60.
Bid/Ask Spread
The difference between the ask price and the bid price. A narrower bid/ask spread generally indicates higher liquidity for the option, meaning it's easier to buy or sell without significantly impacting its price. Conversely, a wider spread suggests lower liquidity and potentially higher transaction costs. Example: If an option has a bid of $1.40 and an ask of $1.60, the bid/ask spread is $0.20. A spread of $0.05 ($1.45 bid, $1.50 ask) indicates higher liquidity.
Volume & Open Interest
Volume
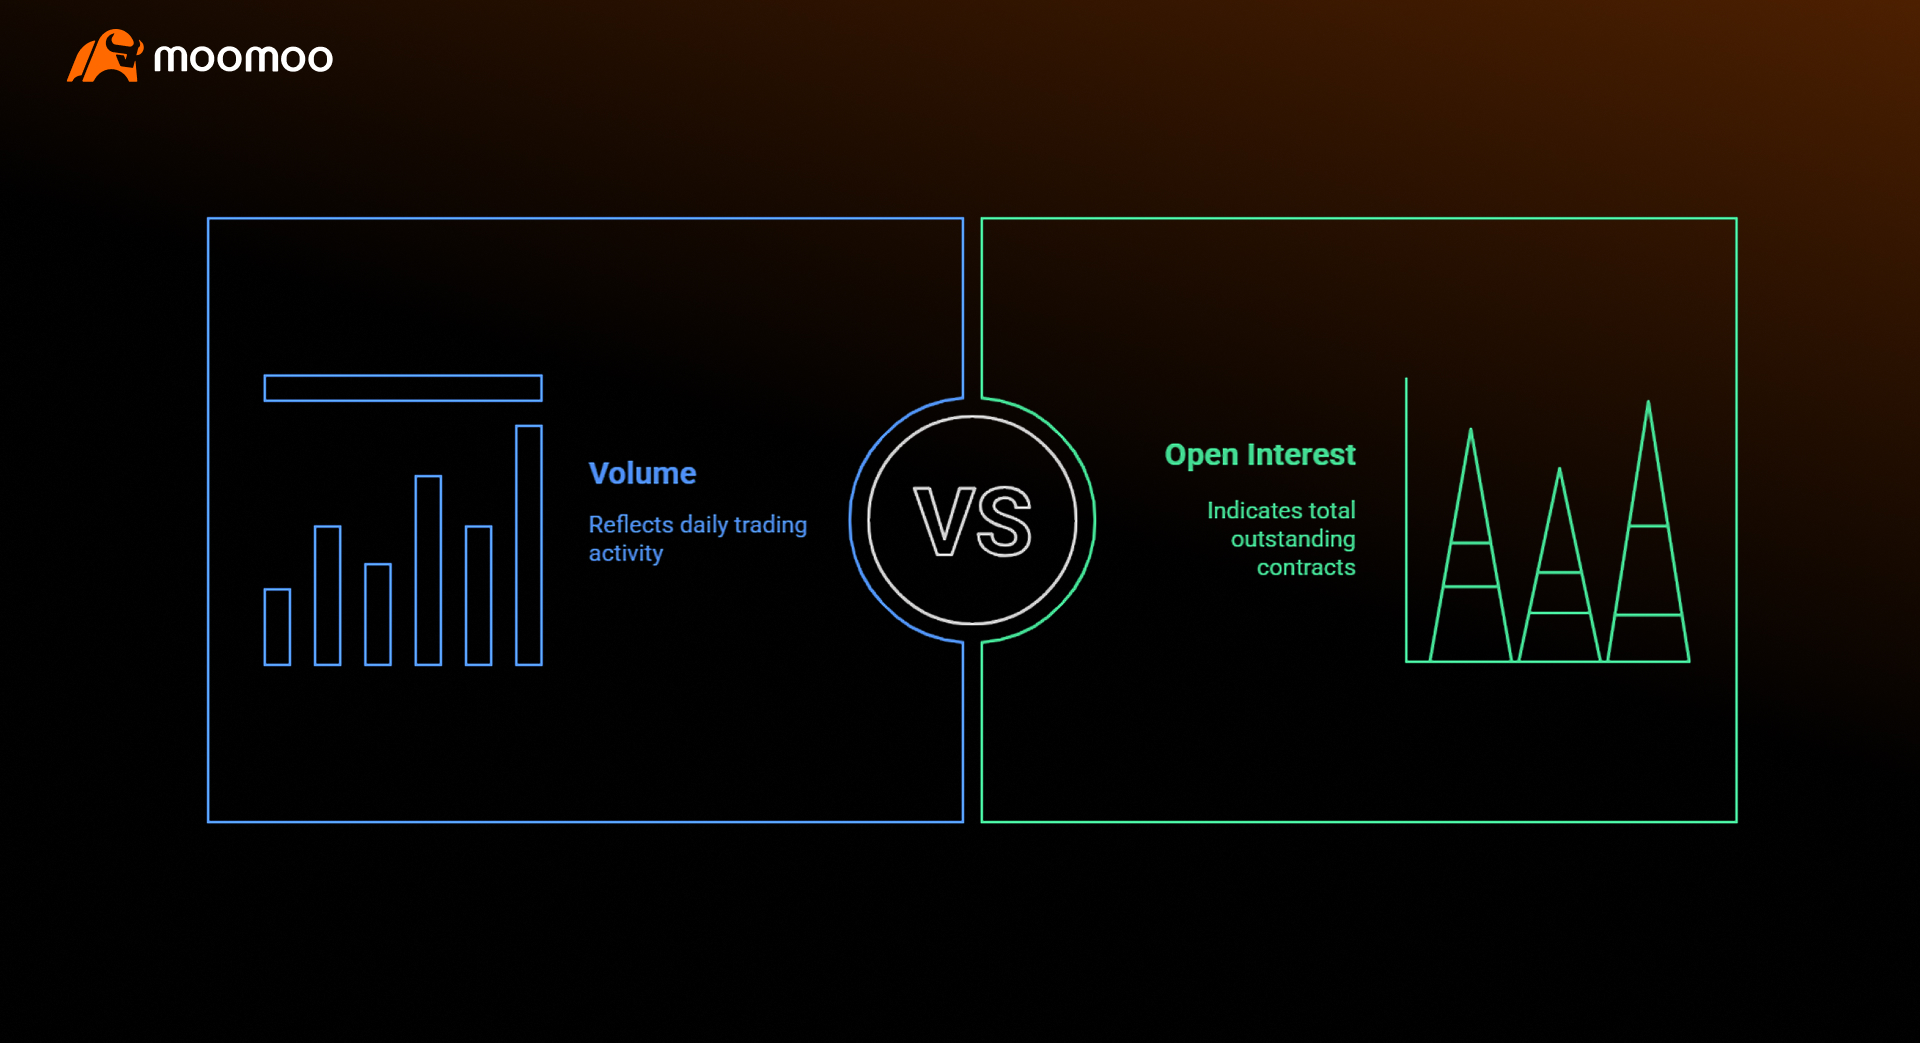
This metric represents the total number of option contracts traded for a specific strike price and expiration date during the current trading day. High trading volume indicates active interest in that particular option, suggesting good liquidity and potentially strong market sentiment. It can also signal the beginning or end of a trend. Example: A volume of 5,000 for a specific option means 5,000 contracts have been traded today.
Open Interest
Open interest refers to the total number of outstanding option contracts for a specific strike price and expiration date that have not yet been closed out or exercised. Unlike volume, which resets daily, open interest accumulates and reflects the total number of active contracts. High open interest suggests significant market participation and can indicate key support or resistance levels. A rising open interest often confirms the strength of a trend, while a declining open interest might signal a weakening trend or position closures. Example: An open interest of 20,000 for a particular option means there are 20,000 active contracts outstanding.
Implied Volatility (IV)
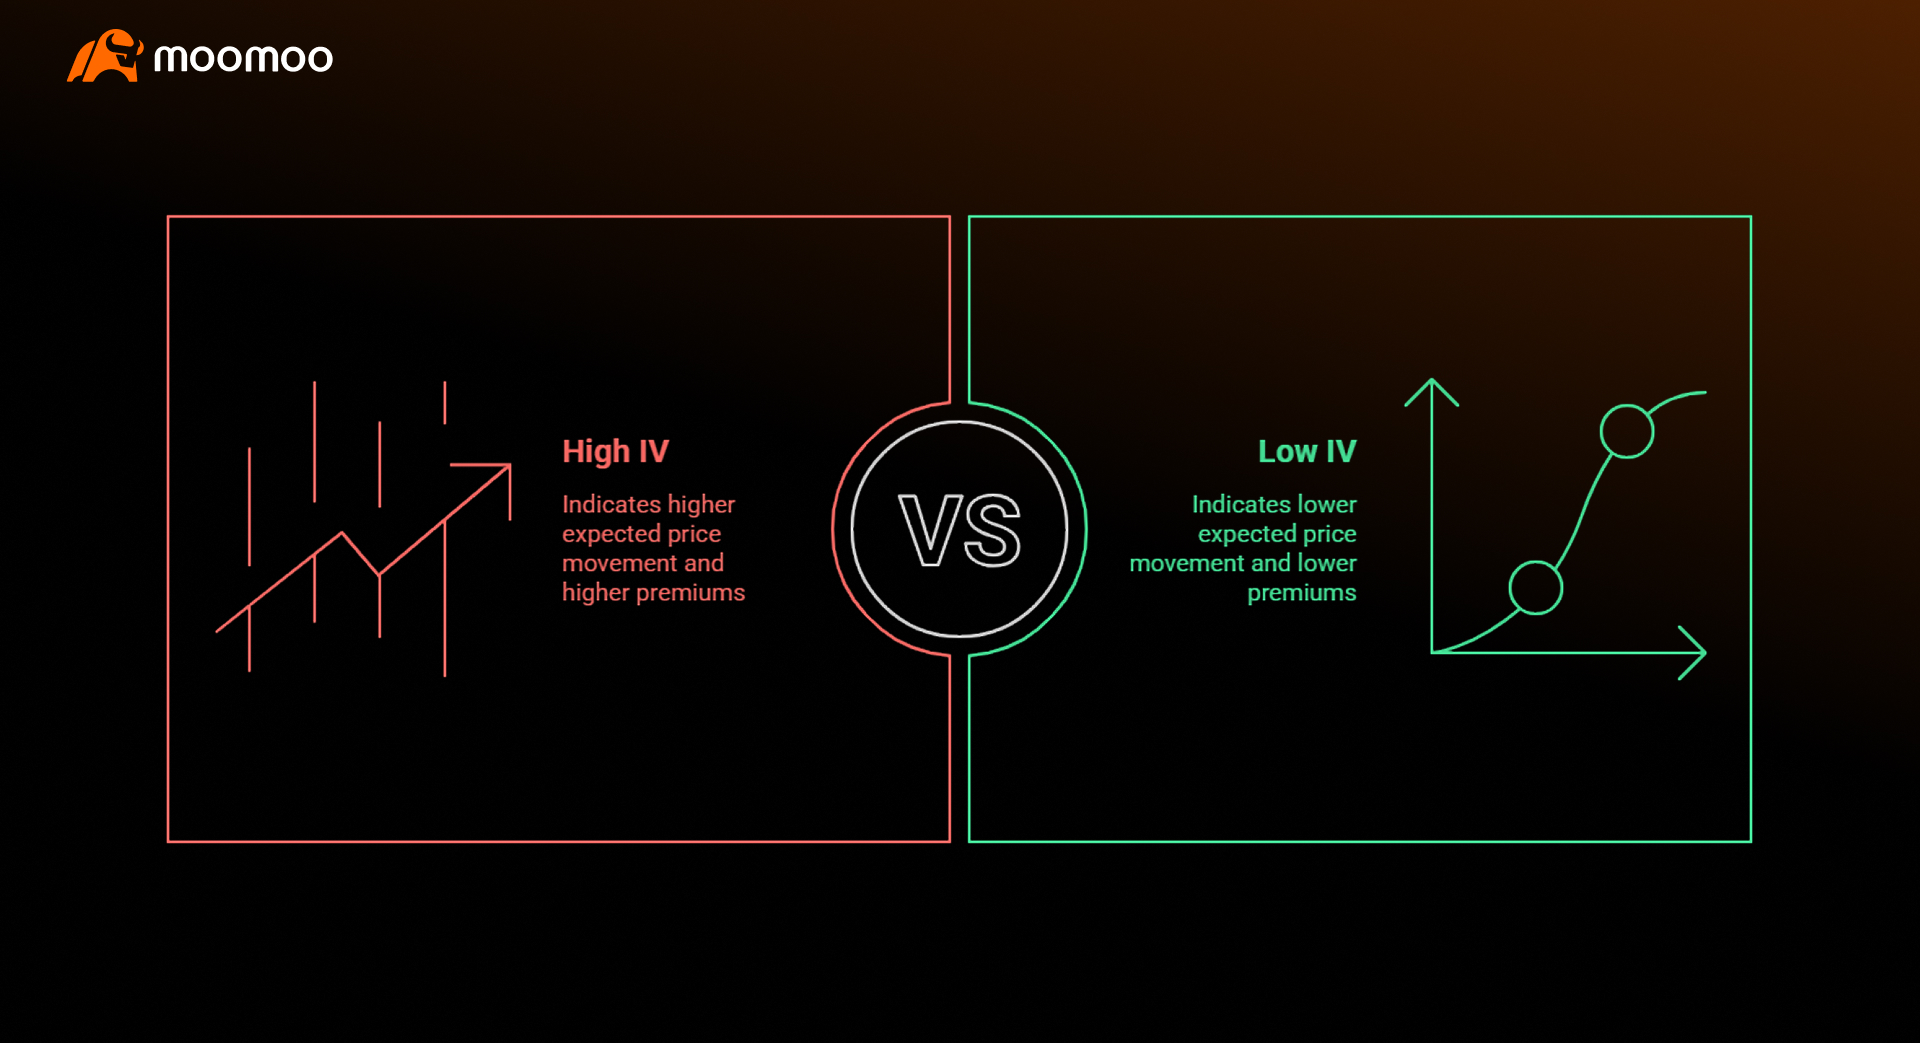
Implied volatility is a forward-looking estimate of the potential future price fluctuations of the underlying asset. It is derived from the option's market price and reflects the market's expectation of how much the underlying asset's price will move. Higher IV generally leads to higher option premiums, as there is a greater perceived chance of the option moving in-the money. Conversely, lower IV results in lower premiums. IV is a crucial factor in options pricing and can be used to identify potentially overvalued or undervalued options. Example: If an option has an IV of 30%, the market expects the underlying asset to move by approximately 30% (annualized) over the life of the option.
The Greeks
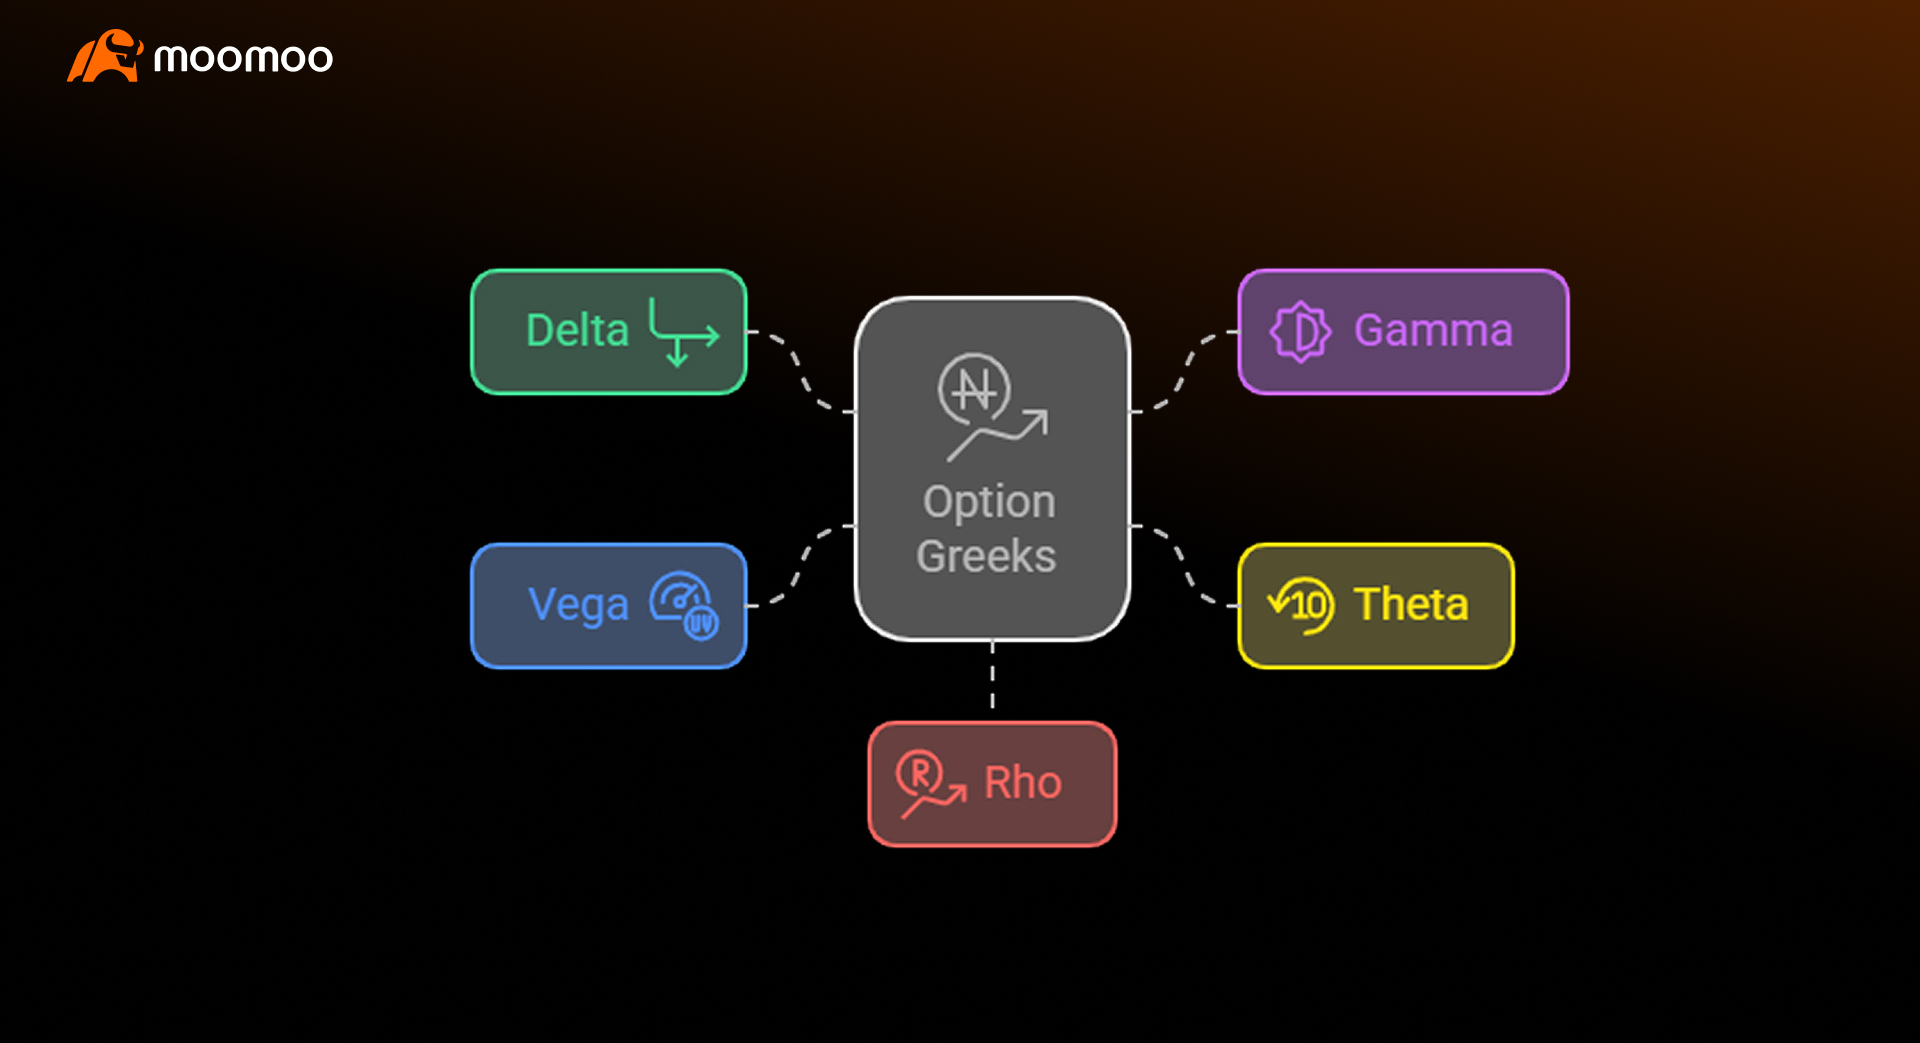
These are a set of risk measures that quantify the sensitivity of an option's price to changes in various underlying factors. The most commonly referenced Greeks include:
Delta: Measures the option's price sensitivity to a $1 change in the underlying asset's price. A delta of 0.50 means the option's price will move by $0.50 for every $1 change in the underlying asset. Example: If you own a call option with a Delta of 0.60 and the underlying stock increases by $1, your option's price is expected to increase by $0.60.
Gamma: Measures the rate of change of an option's delta with respect to a change in the underlying asset's price. It indicates how much delta will change as the underlying moves. Example: If an option has a Gamma of 0.10, and its Delta is 0.50, a $1 move in the underlying would change the Delta to 0.60 (0.50 + 0.10).
Theta: Measures the rate at which an option's price decays over time (time decay). As an option approaches its expiration date, its extrinsic value (time value) erodes, and theta quantifies this erosion. Example: If an option has a Theta of -0.05, it means the option's price is expected to decrease by $0.05 each day due to time decay.
Vega: Measures an option's price sensitivity to a 1% change in the underlying asset's implied volatility. Higher Vega means the option's price is more sensitive to changes in implied volatility. Example: If an option has a Vega of 0.15, and the implied volatility increases by 1%, the option's price is expected to increase by $0.15.
Rho: Measures an option's price sensitivity to a 1% change in interest rates. Rho is generally less significant for short-term options but can be relevant for long-term options. Example: If an option has a Rho of 0.02, and interest rates increase by 1%, the option's price is expected to increase by $0.02.
Intrinsic Value vs. Extrinsic Value (Time Value):
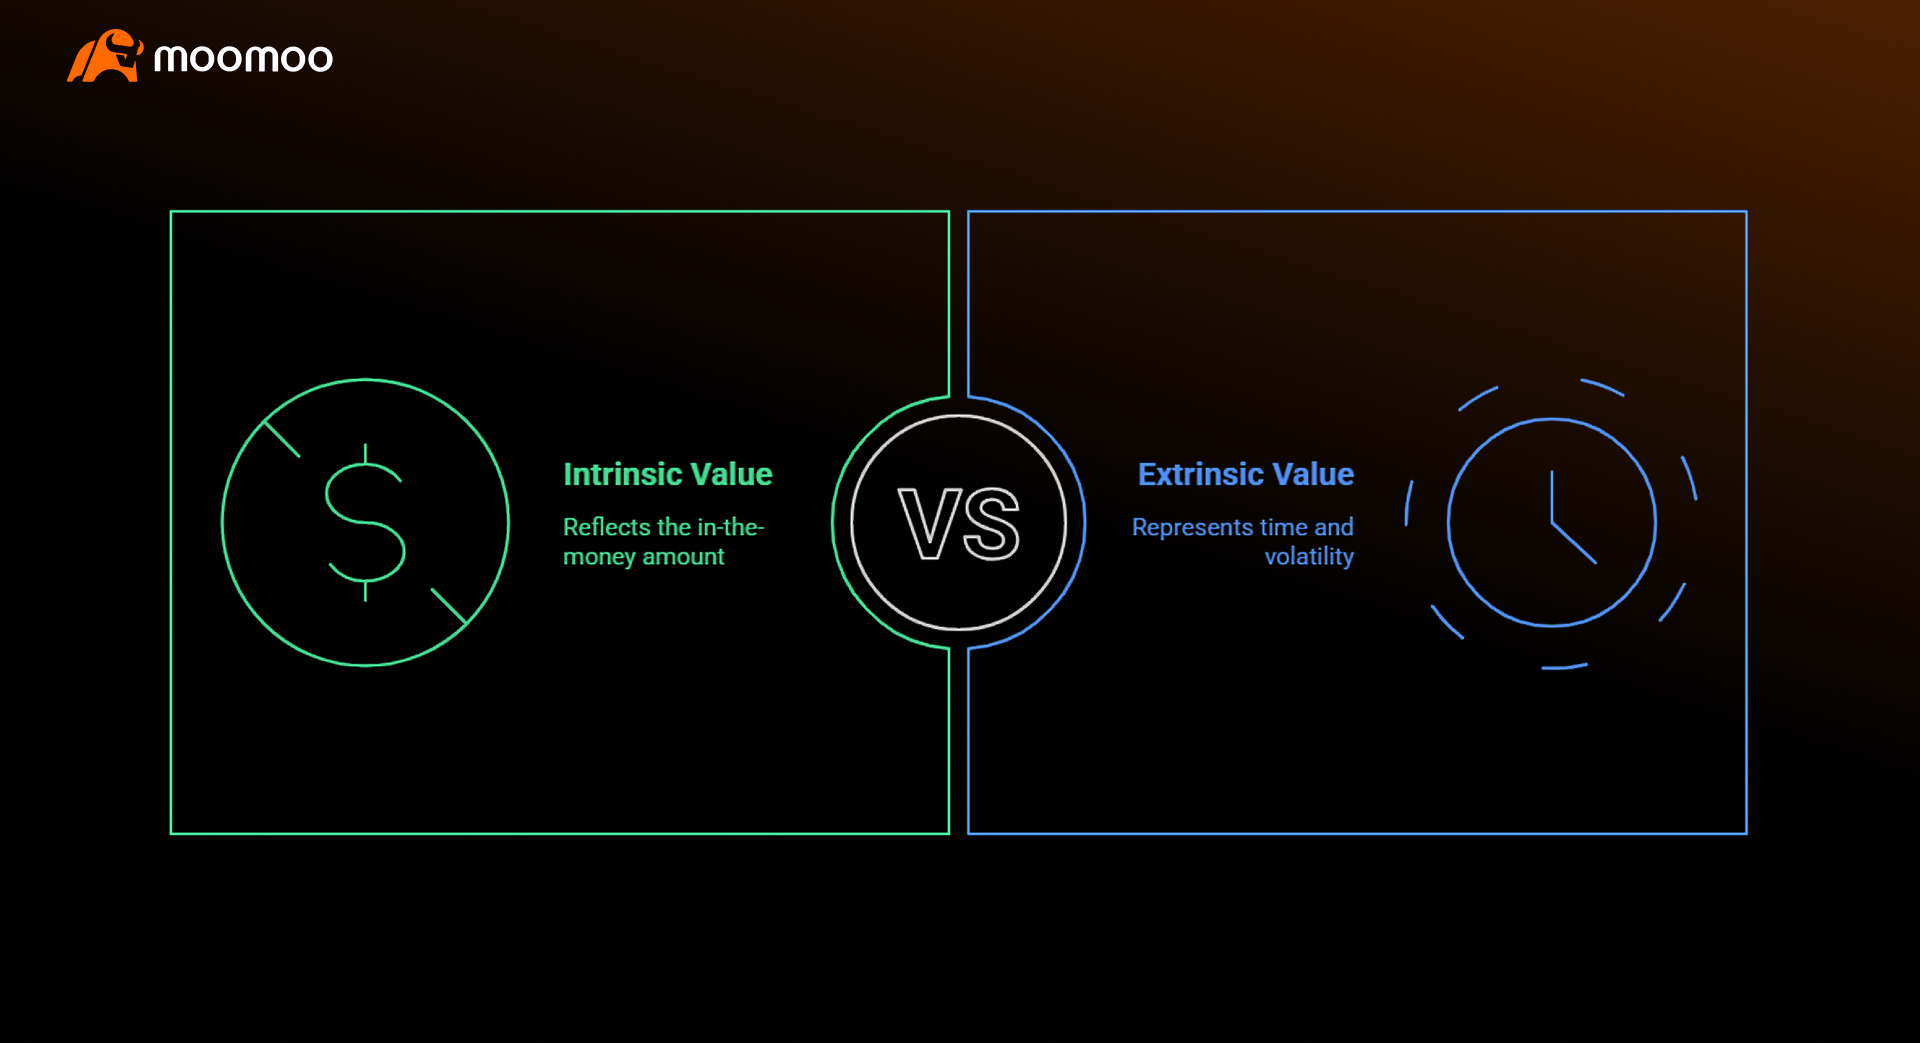
Intrinsic Value
The portion of an option's premium that is derived from its in-the-money amount. For a call option, it's the difference between the underlying price and the strike price (if positive). For a put option, it's the difference between the strike price and the underlying price (if positive). OTM options have no intrinsic value. Example: If a stock is at $105 and you have a $100 call option, its intrinsic value is $5 ($105 - $100).
Extrinsic Value (Time Value):
The portion of an option's premium that is not intrinsic value. It represents the value attributed to the time remaining until expiration and the implied volatility of the underlying asset. Extrinsic value erodes as the option approaches expiration and as implied volatility decreases. Example: If an option's premium is $7 and its intrinsic value is $5, then its extrinsic value (time value) is $2 ($7 - $5).
Understanding these components and their interrelationships is fundamental to effectively analyzing an options chain and making informed trading decisions. Each data point provides valuable insights into the market's perception of the underlying asset and the potential profitability and risk associated with various option strategies.
How to Analyze Options Chain
Analyzing an options chain effectively is a skill that develops with practice and a solid understanding of its components. It involves a systematic approach to extract meaningful insights that can inform your trading decisions. Here’s a step-by-step guide to analyzing an options chain:
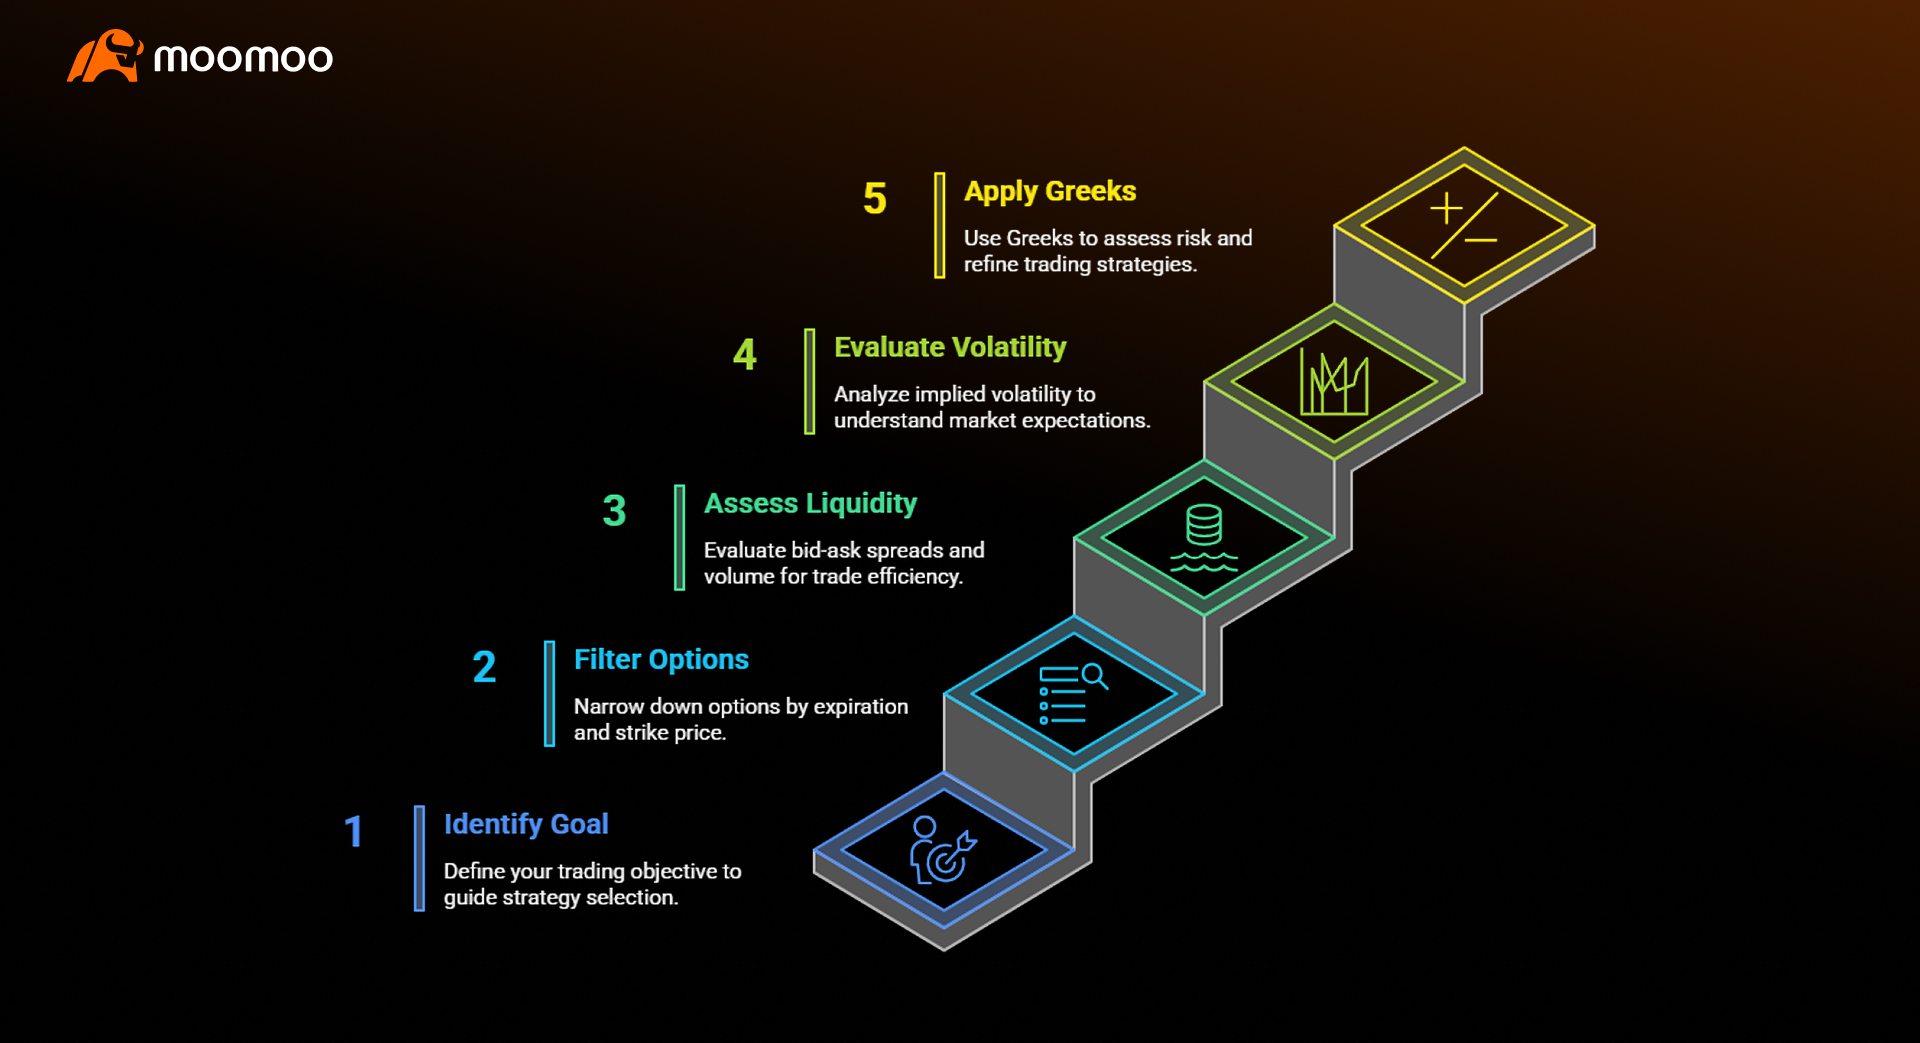
Step 1: Identify Your Goal
Before diving into the numbers, clearly define your trading objective. Are you looking to speculate on a price movement, hedge an existing position, generate income, or capitalize on volatility? Your goal will dictate which options contracts and strategies are most relevant to your analysis. For example:
Speculation: If you anticipate a significant price move in the underlying asset, you might look for out-of-the-money (OTM) options with high leverage.
Hedging: If you want to protect a stock portfolio from a downturn, you would focus on buying put options.
Income Generation: If you aim to collect premiums, you might consider selling covered calls or cash-secured puts.
Volatility Play: If you expect a change in implied volatility, you might use strategies like straddles or strangles.
Having a clear objective will help you filter out irrelevant information and focus on the data points that matter most to your strategy.
Step 2: Filter by Expiration & Strike
Once your goal is defined, narrow down the options chain by selecting appropriate expiration dates and strike prices.
Expiration Date: Consider your time horizon. Short-term options (weekly or monthly) are more sensitive to time decay (Theta) and are suitable for short-term price predictions. Longer-term options (LEAPS) offer more time for the underlying asset to move and are less affected by immediate time decay, making them suitable for long-term directional bets or portfolio hedging.
Strike Price: The choice of strike price is critical and depends on your directional bias and risk tolerance. If you are bullish, you might look at call options with strike prices above the current market price (OTM calls) or at-the-money (ATM) calls. If you are bearish, you would consider put options with strike prices below the current market price (OTM puts) or ATM puts. In-the-money (ITM) options have intrinsic value and behave more like the underlying stock, offering less leverage but higher probability of profit.
Step 3: Assess Liquidity & Volume
Liquidity is paramount in options trading, as it directly impacts your ability to enter and exit positions efficiently and at favorable prices. High liquidity is characterized by tight bid-ask spreads and significant trading volume and open interest.
Bid/Ask Spread: Always examine the bid-ask spread. A narrow spread (e.g., a few cents) indicates a liquid market where there are many buyers and sellers, making it easier to get your order filled at a fair price. Wide spreads suggest illiquidity, which can lead to higher transaction costs and difficulty in exiting positions.
Volume: Look for options contracts with consistently high daily trading volume. High volume signifies active trading interest, which contributes to better liquidity and price discovery. Options with very low volume might be difficult to trade, as there may not be enough buyers or sellers when you want to enter or exit a position.
Open Interest: Analyze open interest in conjunction with volume. High open interest indicates a large number of outstanding contracts, suggesting significant market participation and institutional involvement. It can also highlight potential support and resistance levels where large numbers of contracts are concentrated. A rising open interest confirms increasing interest in a particular option, while a declining open interest might signal that traders are closing their positions.
Prioritize options with good liquidity to minimize slippage and ensure efficient trade execution.
Step 4: Evaluate Implied Volatility
Implied Volatility (IV) is a critical factor in options pricing and a key indicator of market expectations regarding future price movements. It reflects the market's perception of risk and uncertainty.
High IV: Options with high IV tend to have higher premiums, as the market anticipates larger price swings in the underlying asset. This can be advantageous for option sellers (writers) who collect higher premiums, but it also means higher costs for option buyers. High IV often occurs before significant news events, earnings announcements, or economic data releases.
Low IV: Options with low IV have lower premiums, suggesting the market expects less price movement. This can be attractive for option buyers looking for cheaper entry points, but it also means less potential for large gains if the underlying asset remains stable. Low IV environments are often preferred by option buyers who anticipate a breakout or significant move.
Compare the IV of different options within the chain and against historical IV levels. Significant discrepancies might indicate mispriced options, presenting potential trading opportunities. For example, if an option's IV is unusually high compared to its historical average, it might be a good candidate for selling premium, assuming you believe the volatility will revert to its mean.
Step 5: Apply the Greeks
The Greeks (Delta, Gamma, Theta, Vega, Rho) provide a quantitative framework for understanding how an option's price will react to changes in various market factors. Applying the Greeks to your analysis helps you assess risk, manage positions, and refine your strategy.
Delta: Use Delta to understand the directional sensitivity of your option. A higher Delta means the option's price will move more in line with the underlying asset. For example, a call option with a Delta of 0.70 will gain $0.70 for every $1 increase in the underlying stock price. Delta also approximates the probability of an option expiring in-the-money.
Gamma: Gamma measures the rate of change of Delta. Options with high Gamma (typically ATM options) will see their Delta change rapidly as the underlying asset moves, leading to accelerated gains or losses. This is important for understanding how quickly your directional exposure changes.
Theta: Theta quantifies time decay. Options lose value as they approach expiration, and Theta tells you how much value an option loses each day. Short term OTM options have higher Theta, meaning they decay faster. If you are buying options, you want lower Theta; if you are selling options, you want higher Theta to benefit from time decay.
Vega: Vega measures an option's price sensitivity to a 1% change in the underlying asset's implied volatility. Options with high Vega will see their prices increase when IV rises and decrease when IV falls. If you expect IV to increase, you might buy options with high Vega. If you expect IV to decrease, you might sell options with high Vega.
Rho: Rho measures an option's price sensitivity to a 1% change in interest rates. Rho is generally less significant for short-term options but can be relevant for long term options (LEAPS) and strategies that involve significant capital outlay.
By systematically applying these steps, you can move beyond simply reading an options chain to truly analyzing it, enabling you to make more informed and strategic trading decisions.
Practical Tips for Using Options Chain in Trading
Beyond understanding the components and analysis steps, practical application of options chain analysis is crucial for successful options trading. Here are some tips to leverage the options chain in your trading strategies:
How to Use Options Chain for Hedging Strategies
Options chains are invaluable for implementing hedging strategies, which aim to reduce potential losses in an existing portfolio. By carefully selecting options contracts, you can create a protective layer against adverse market movements.
Protective Put
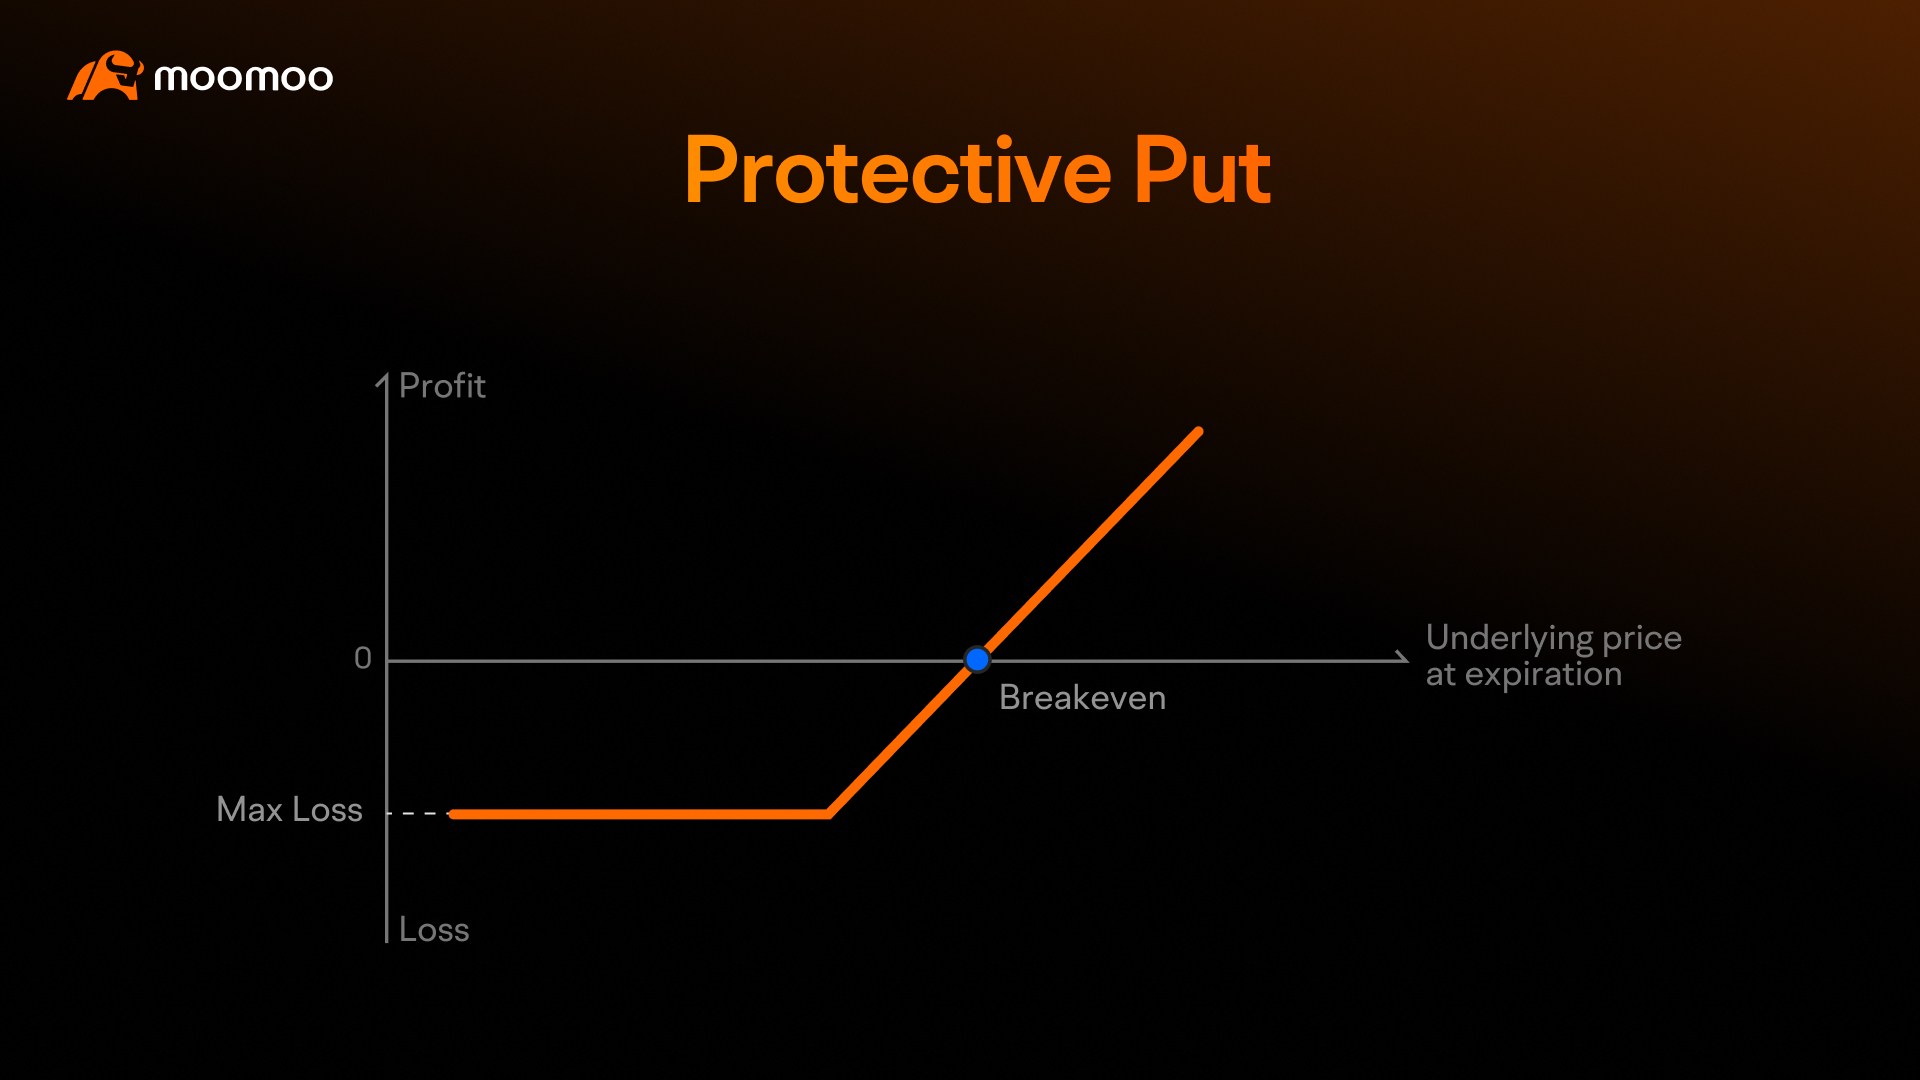
If you own shares of a stock and are concerned about a potential downturn, you can buy put options on that stock. The options chain allows you to select a strike price that provides the desired level of protection (e.g., slightly out of-the-money puts to limit downside risk while allowing for some upside). The expiration date should align with your anticipated period of risk. By analyzing the options chain, you can compare the cost (premium) of different put options against the level of protection they offer, ensuring a cost-effective hedge.
Example: Suppose you own 100 shares of a company's stock, currently trading at $50. You are concerned about a potential short-term decline but want to hold onto the shares long-term. You could buy one put option contract for this stock with a strike price of $45 expiring in three months for a premium of $1.50 per share (total $150). If the stock drops to $40, your stock loss is $10 per share ($1000 total), but your put option gains $3.50 per share ($350 total, excluding premium paid), partially offsetting the loss. Your maximum loss on the stock is limited to $5 per share below the strike price, plus the premium paid for the put.
Covered Calls
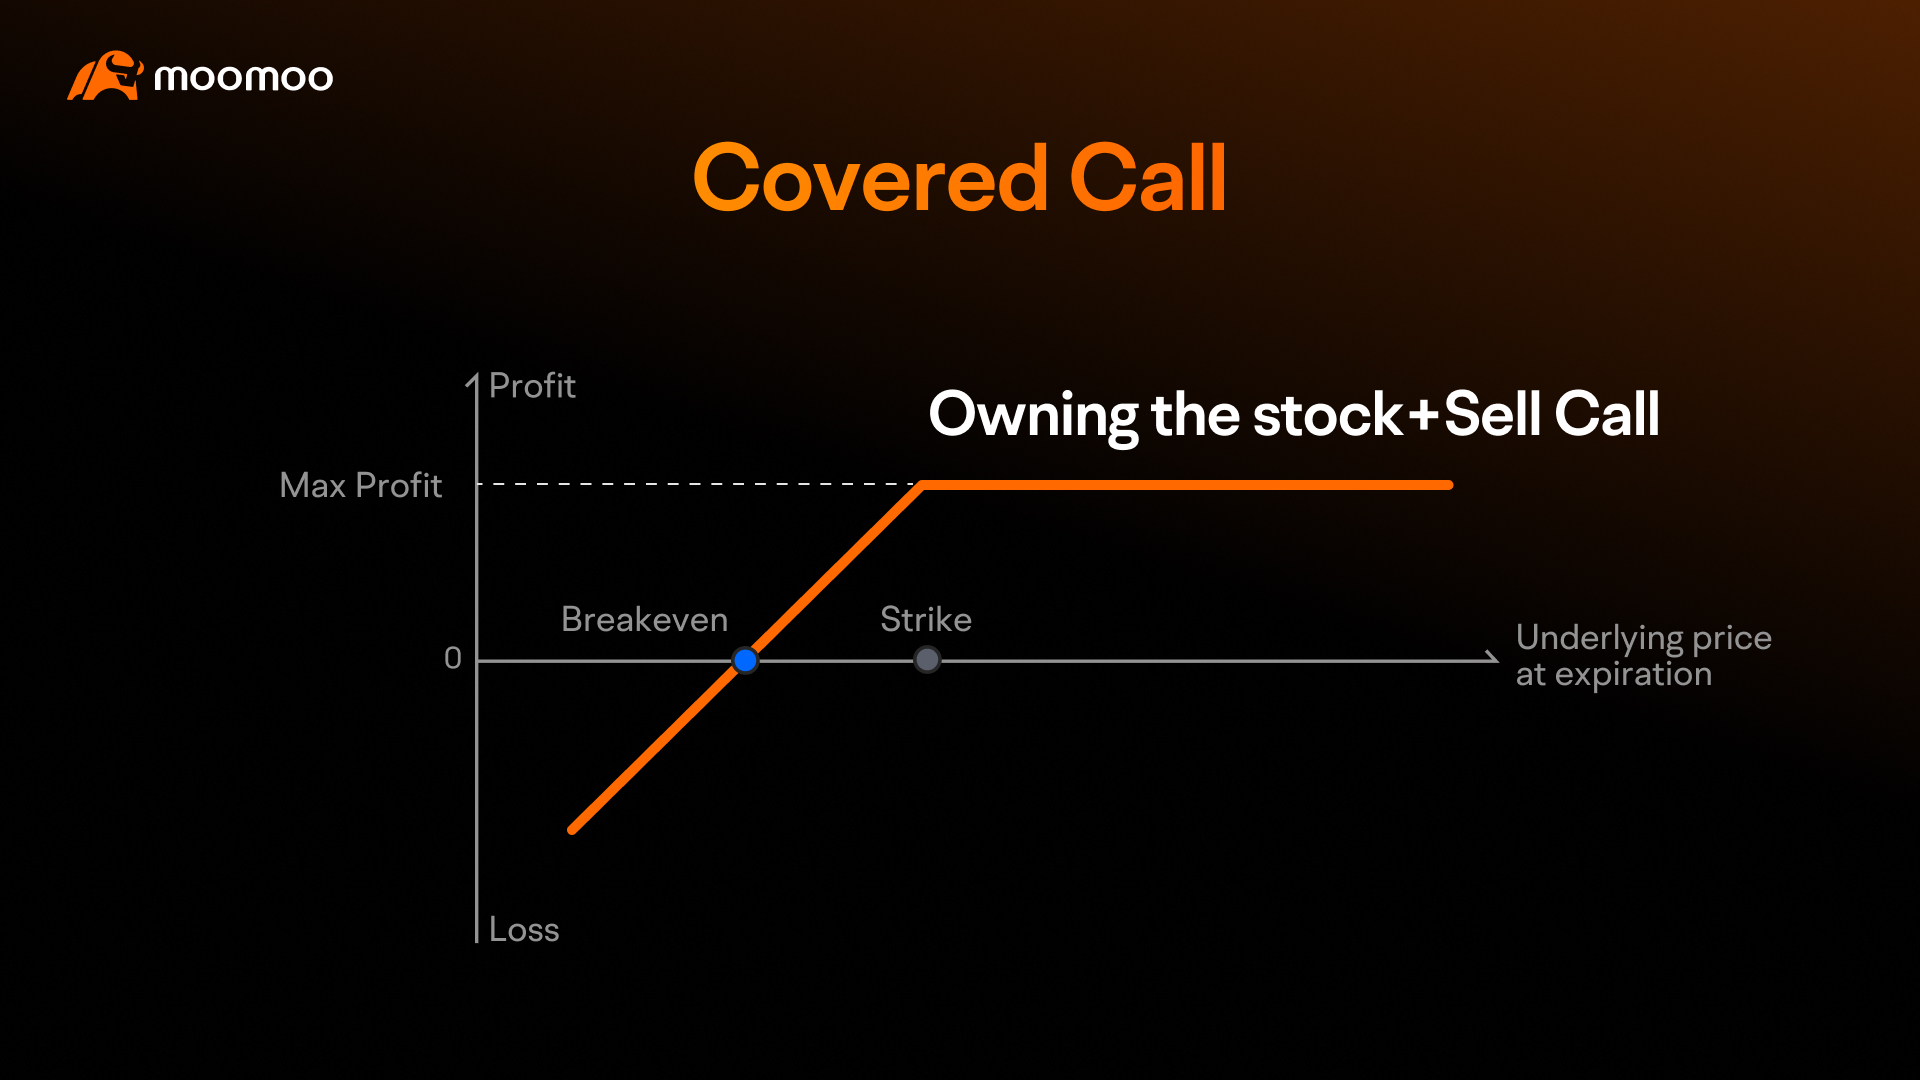
If you own shares of a stock and want to generate income, you can sell call options against your existing shares (covered calls). The options chain helps you identify suitable strike prices and expiration dates. By selling calls slightly out-of-the-money, you can collect premium income while still allowing for some upside appreciation in your stock. However, if the stock price rises above the strike price, your shares may be called away. The options chain allows you to assess the trade-off between premium income and potential upside limitation.
Example: You own 100 shares of a company's stock, currently trading at $100. You believe the stock might trade sideways or have limited upside in the near term. You could sell one call option contract for this stock with a strike price of $105 expiring in one month for a premium of $2.00 per share (total $200). If the stock stays below $105 by expiration, you keep the $200 premium. If the stock rises to $107, your shares would be called away at $105, but you still profit from the $5 increase in stock price plus the $2 premium, for a total of $7 per share profit ($700 total). Your maximum profit is capped at the strike price plus the premium received.
>> Learn more: Covered Call and Covered Put Options Strategies
Collar Strategy
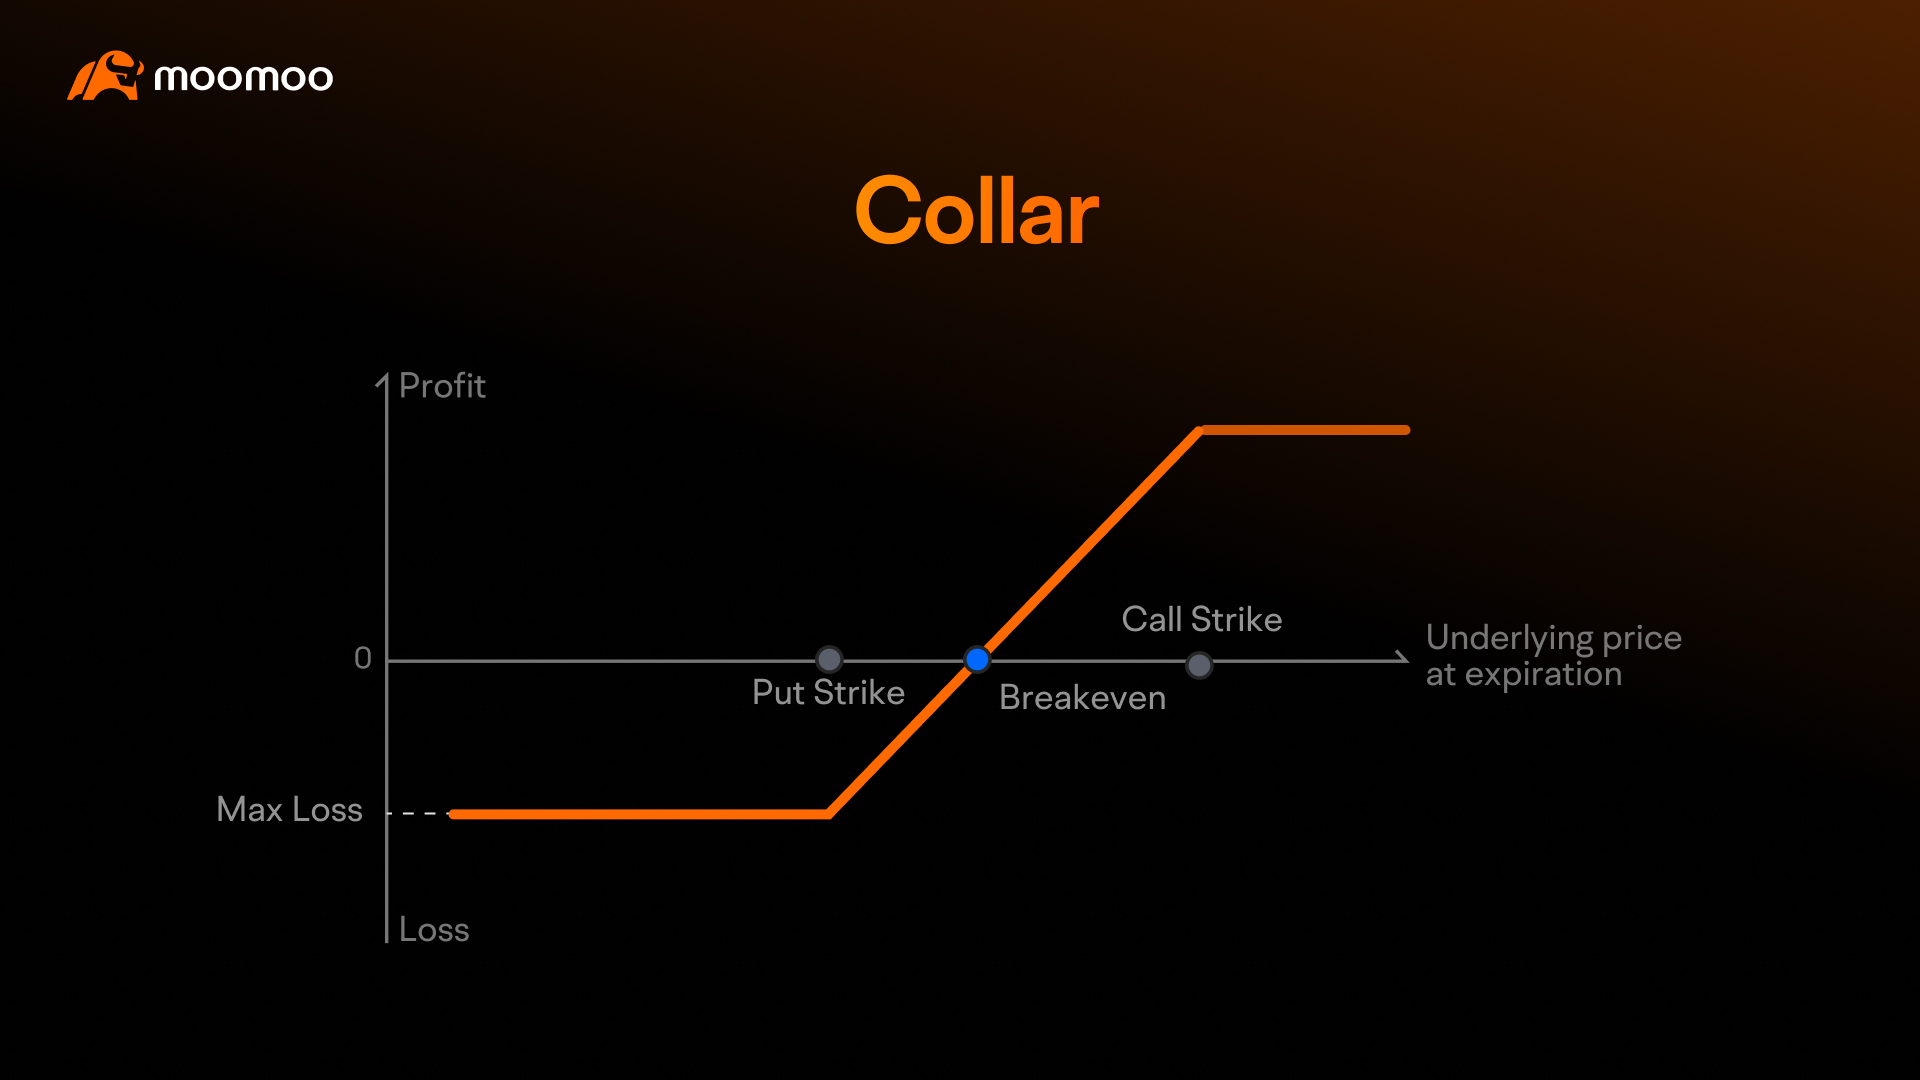
A collar combines a protective put and a covered call. You buy a put option to protect against downside risk and sell a call option to finance the cost of the put. The options chain is essential for selecting the appropriate strike prices and expiration dates for both the put and call, allowing you to define your risk and reward parameters precisely.
Example: Building on the previous stock example (currently at $100), you could buy a $95 strike put option for $1.00 per share and sell a $105 strike call option for $2.00 per share, both expiring in one month. Your net credit is $1.00 per share ($100 total). Your downside is protected below $95 (minus the net credit), and your upside is capped at $105 (plus the net credit). This strategy defines your risk and reward within a specific range.
Spotting Mispriced Options
Identifying mispriced options is a more advanced aspect of options chain analysis that can offer significant opportunities. While true arbitrage opportunities (risk-free profit) are rare and typically exploited by high-frequency traders, retail traders can still look for options that appear undervalued or overvalued based on various metrics.
Implied Volatility (IV) Analysis
A key indicator of mispricing is an option's implied volatility relative to the underlying asset's historical volatility or the IV of other options in the chain. If an option's IV is significantly higher than its historical average, it might suggest that the option is overpriced, making it a potential candidate for selling. Conversely, if the IV is unusually low, the option might be undervalued, presenting a buying opportunity.
Example: Suppose a company's stock has historically traded with an annualized volatility of 20%. However, you notice a specific call option for this stock with an IV of 40%, and there's no immediate news or event to justify such a high expectation of future price swings. This option might be overpriced, and selling it (e.g., as part of a credit spread) could be a profitable strategy if IV reverts to its mean.
Premium vs. Theoretical Value
This involves comparing the current market premium of an option (its bid/ask price) with its theoretical or fair value as calculated by an option pricing model (like Black-Scholes). If the market premium is significantly higher than its theoretical value, the option might be overpriced. Conversely, if the market premium is lower than its theoretical value, it might be undervalued. This comparison helps identify potential mispricings.
Example: An option pricing model calculates a theoretical value of $3.50 for a particular call option. However, the options chain shows its current market price (mid-point of bid/ask) is $3.00. This suggests the option might be undervalued, potentially making it an attractive buying opportunity.
Arbitrage Opportunities:
While the term "arbitrage" technically refers to risk-free profit opportunities, these are extremely rare and typically exploited by sophisticated institutional traders with high-speed trading systems. For retail traders, the concept of "mispriced options" is more about identifying options that are statistically undervalued or overvalued based on factors like implied volatility and theoretical pricing models, rather than guaranteed risk-free profits. The goal is to find options where the market price deviates significantly from what fundamental analysis or pricing models suggest, offering a statistical edge rather than a pure arbitrage. Therefore, while you won't likely find true arbitrage, you can still identify opportunities where an option's price doesn't fully reflect its underlying value or volatility expectations.
Avoiding Common Mistakes in Options Chain Analysis
Even experienced traders can fall prey to common pitfalls when analyzing options chains. Being aware of these can help you make more robust decisions:
Ignoring Liquidity
One of the most frequent mistakes is trading illiquid options. Options with wide bid-ask spreads and low volume can lead to significant slippage, making it difficult to enter or exit positions at your desired price. Always prioritize options with good liquidity, even if it means sacrificing a slightly better premium.
Over-reliance on Last Price
The last price displayed in an options chain might not reflect the current market value, especially for less liquid options. Always refer to the bid and ask prices to get a true picture of where the option can be traded.
Neglecting Time Decay (Theta)
Many new options traders underestimate the impact of time decay. Options lose value as they approach expiration, and this erosion accelerates in the final weeks. If you are buying options, time is working against you. Always consider the Theta of the options you are trading and how it aligns with your holding period.
Misinterpreting Implied Volatility
While high IV can lead to higher premiums for sellers, it also indicates higher perceived risk and potential for large price swings. Don't assume high IV automatically means a profitable trade. Understand the underlying reasons for high IV and how it might impact your strategy.
Ignoring the Greeks
The Greeks provide crucial insights into an option's risk profile. Ignoring them can lead to unexpected losses. For example, a high Gamma option can see rapid changes in Delta, making it more volatile than anticipated. Always consider how changes in the underlying asset, time, and volatility will affect your option's price by understanding its Greeks.
By being mindful of these common mistakes, traders can refine their options chain analysis and improve their overall trading performance.
Powerful Tool to Enhance Your Options Chain Analysis
Moomoo Canada, from Moomoo Financial Canada Inc., delivers powerful yet user-friendly tools to make options trading easy for everyone, from curious beginners to seasoned pros.
With features like multi-leg strategies, real-time Level 2 data, Moomoo AI guidance, and a vibrant in-app community, moomoo helps you analyze options chains with confidence. Its sleek interface, fast execution, and mobile-desktop flexibility make trading smooth and stress-free for all users.
Open an account now to unlock more options trading tools!
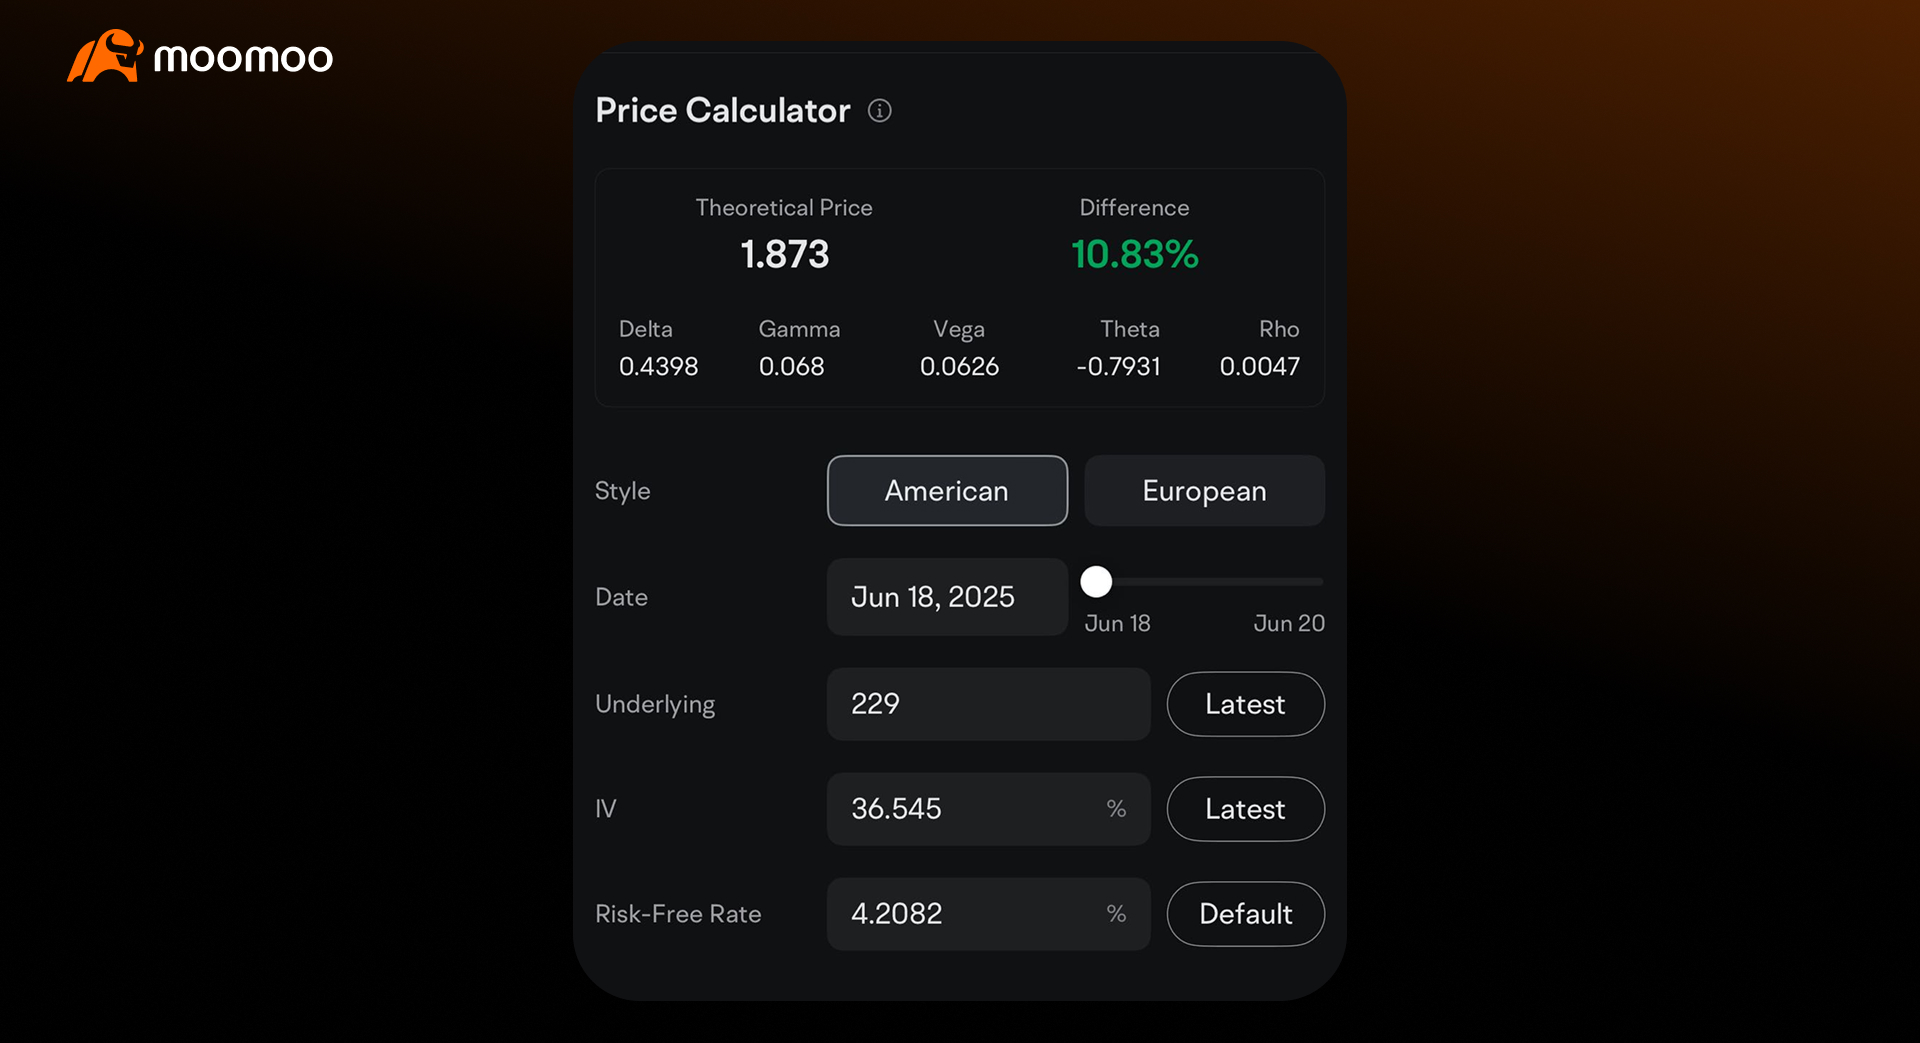
An option calculator is a tool that uses mathematical models (like Black-Scholes) to estimate the theoretical fair value of an option. By inputting key variables such as the underlying asset's price, strike price, time to expiration, risk-free interest rate, and volatility, the calculator provides a theoretical price for the option. This is invaluable for:
Valuation: Comparing the calculated theoretical value with the actual market price to identify potentially overvalued or undervalued options (as discussed in "Premium vs. Theoretical Value").
Scenario Analysis: Simulating how an option's price might change under different market conditions (e.g., a change in underlying price or volatility).
Understanding Greeks: Many calculators also display the Greeks, helping you visualize their impact on the option's price.
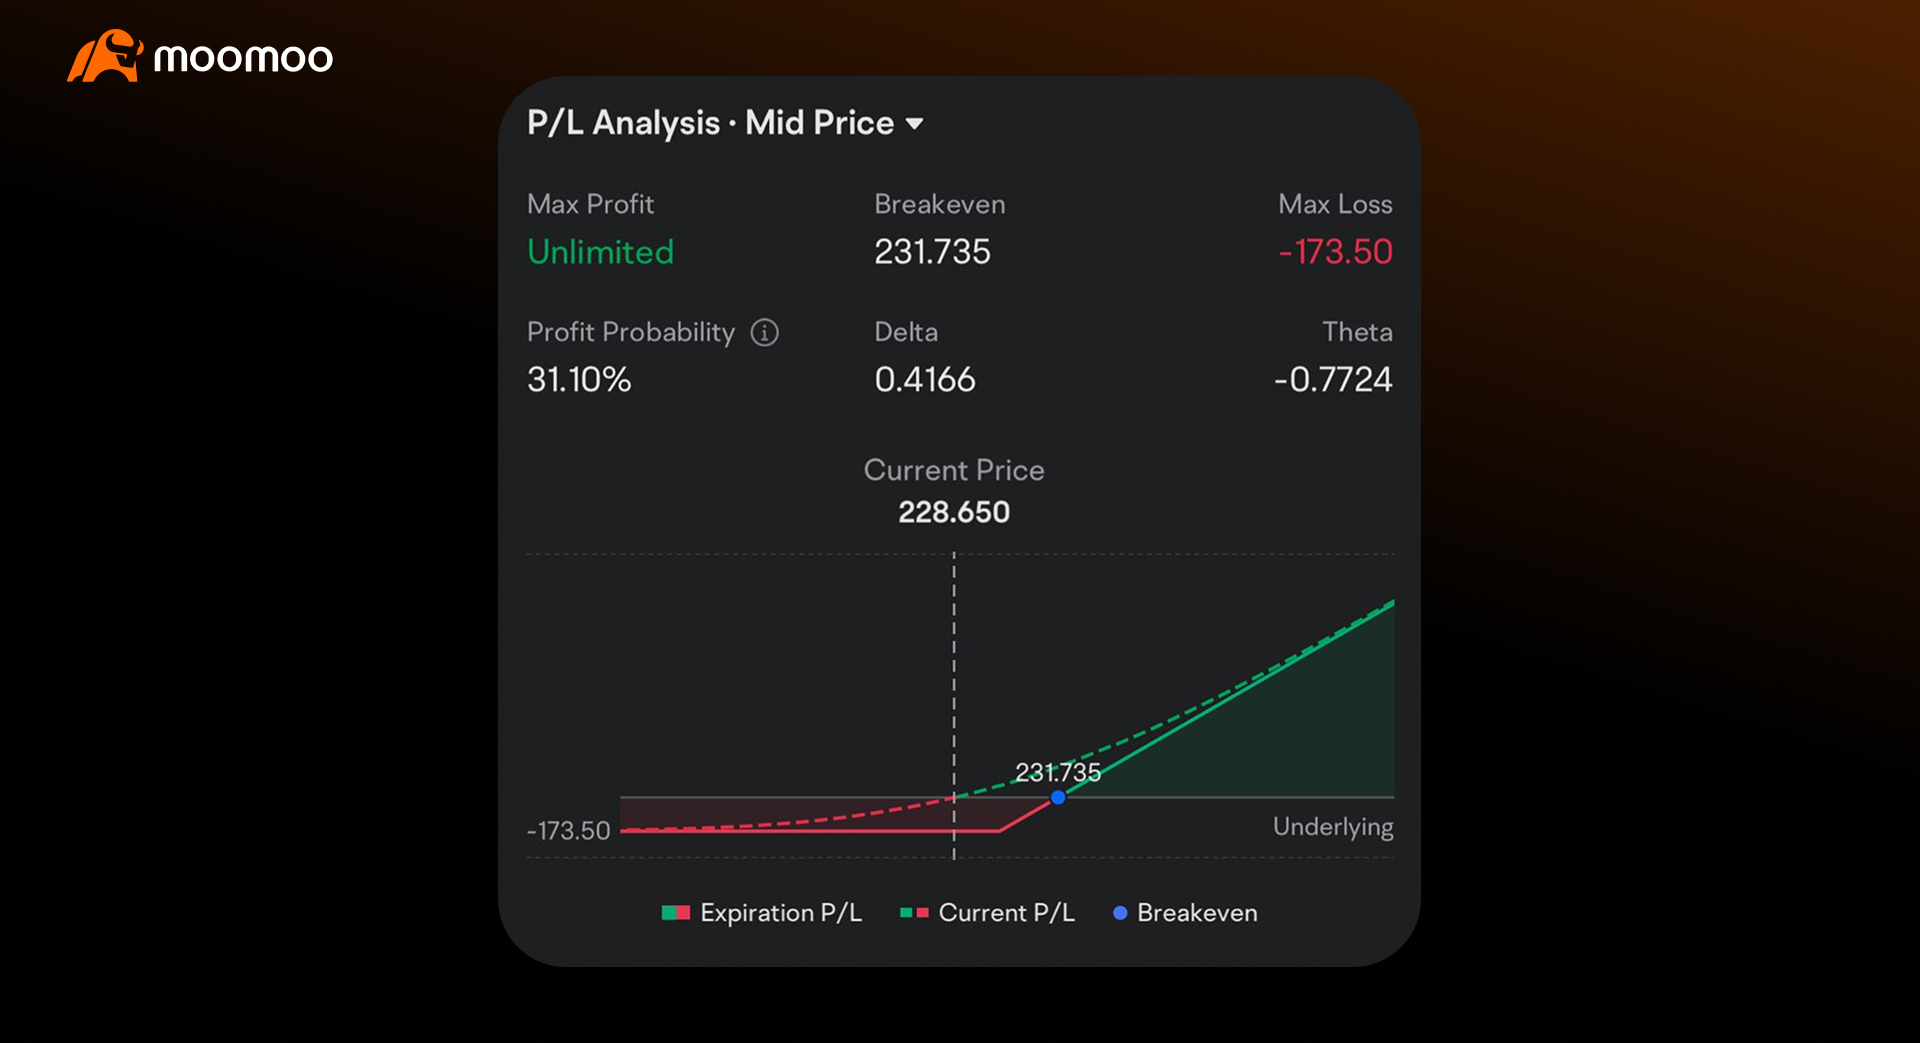
Profit and Loss (P/L) analysis tools enable traders to visualize potential outcomes of an options strategy across various underlying asset prices and timeframes. These tools typically plot P/L at expiration and at interim points before expiration, factoring in price movements, implied volatility (IV), and time decay.
Max Loss: The maximum potential loss an options strategy may incur, based on its structure, aiding in effective risk management.
Max Profit: The maximum potential profit an options strategy can achieve, based on theoretical outcomes, helping set realistic expectations.
Current P/L: The real-time profit or loss of an open options position, reflecting the position’s market value based on current changes in the underlying asset’s price, implied volatility, or other factors like time decay.
Expiration P/L: The projected profit or loss of an options strategy at expiration, calculated across a range of underlying asset prices, assuming the option is held to expiry and no early exercise occurs.
These tools are crucial for understanding the risk-reward profile of a strategy before entering a trade and for managing positions effectively
Volatility Analysis - HV vs IV, IV Rank and IV Percentile
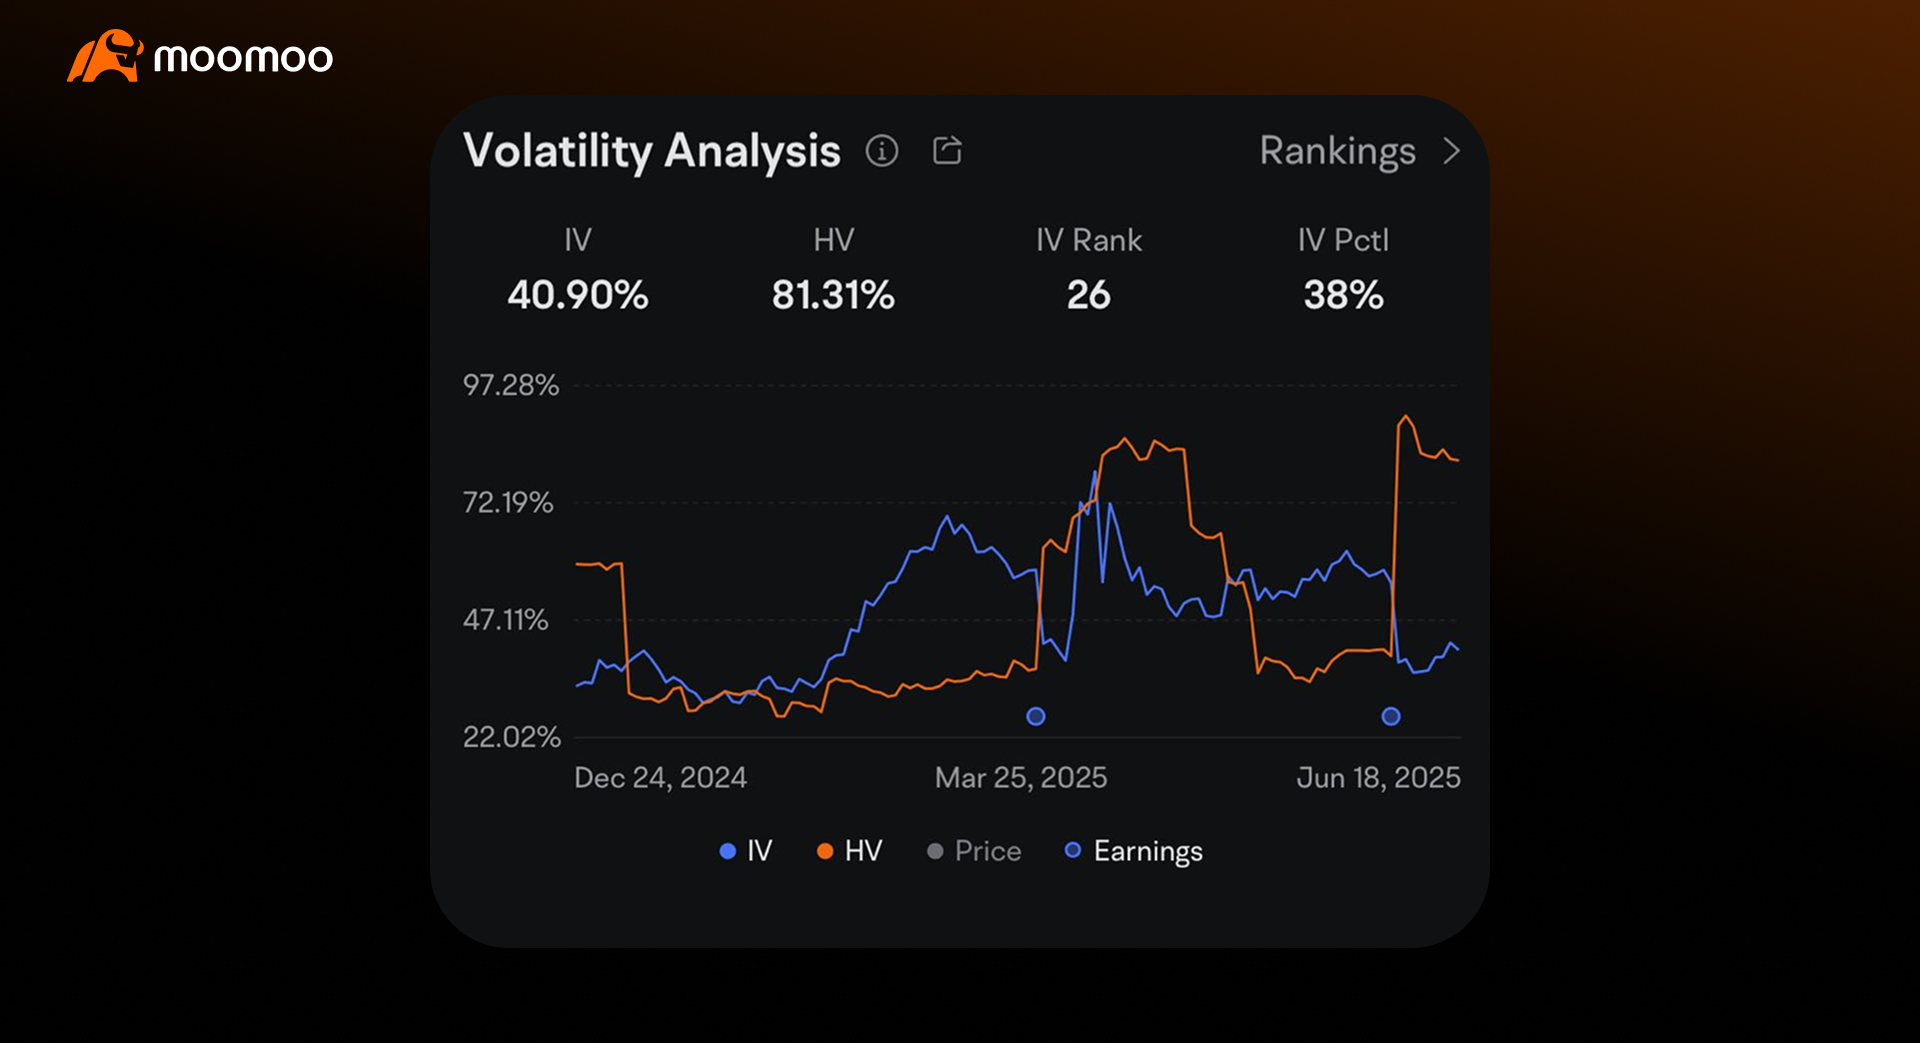
Advanced volatility analysis tools provide deeper insights into the implied volatility of options, helping traders assess whether options are relatively cheap or expensive.
Historical Volatility (HV) vs. Implied Volatility (IV): Comparing the current IV of an option to the historical volatility of the underlying asset can indicate if the market is currently expecting more or less price movement than what has occurred in the past. A significant divergence can signal a potential trading opportunity.
IV Rank: IV Rank compares the current IV to its range over a specific period (e.g., the last year). An IV Rank of 80% means the current IV is at 80% of its highest level over that period, suggesting options are relatively expensive.
IV Percentile: IV Percentile indicates the percentage of days over a specific period that the IV was below the current IV. An IV Percentile of 90% means that 90% of the time over the last year, the IV was lower than it is today, also suggesting options are expensive.
These metrics help traders determine if it's a good time to buy (low IV) or sell (high IV) options based on historical context.
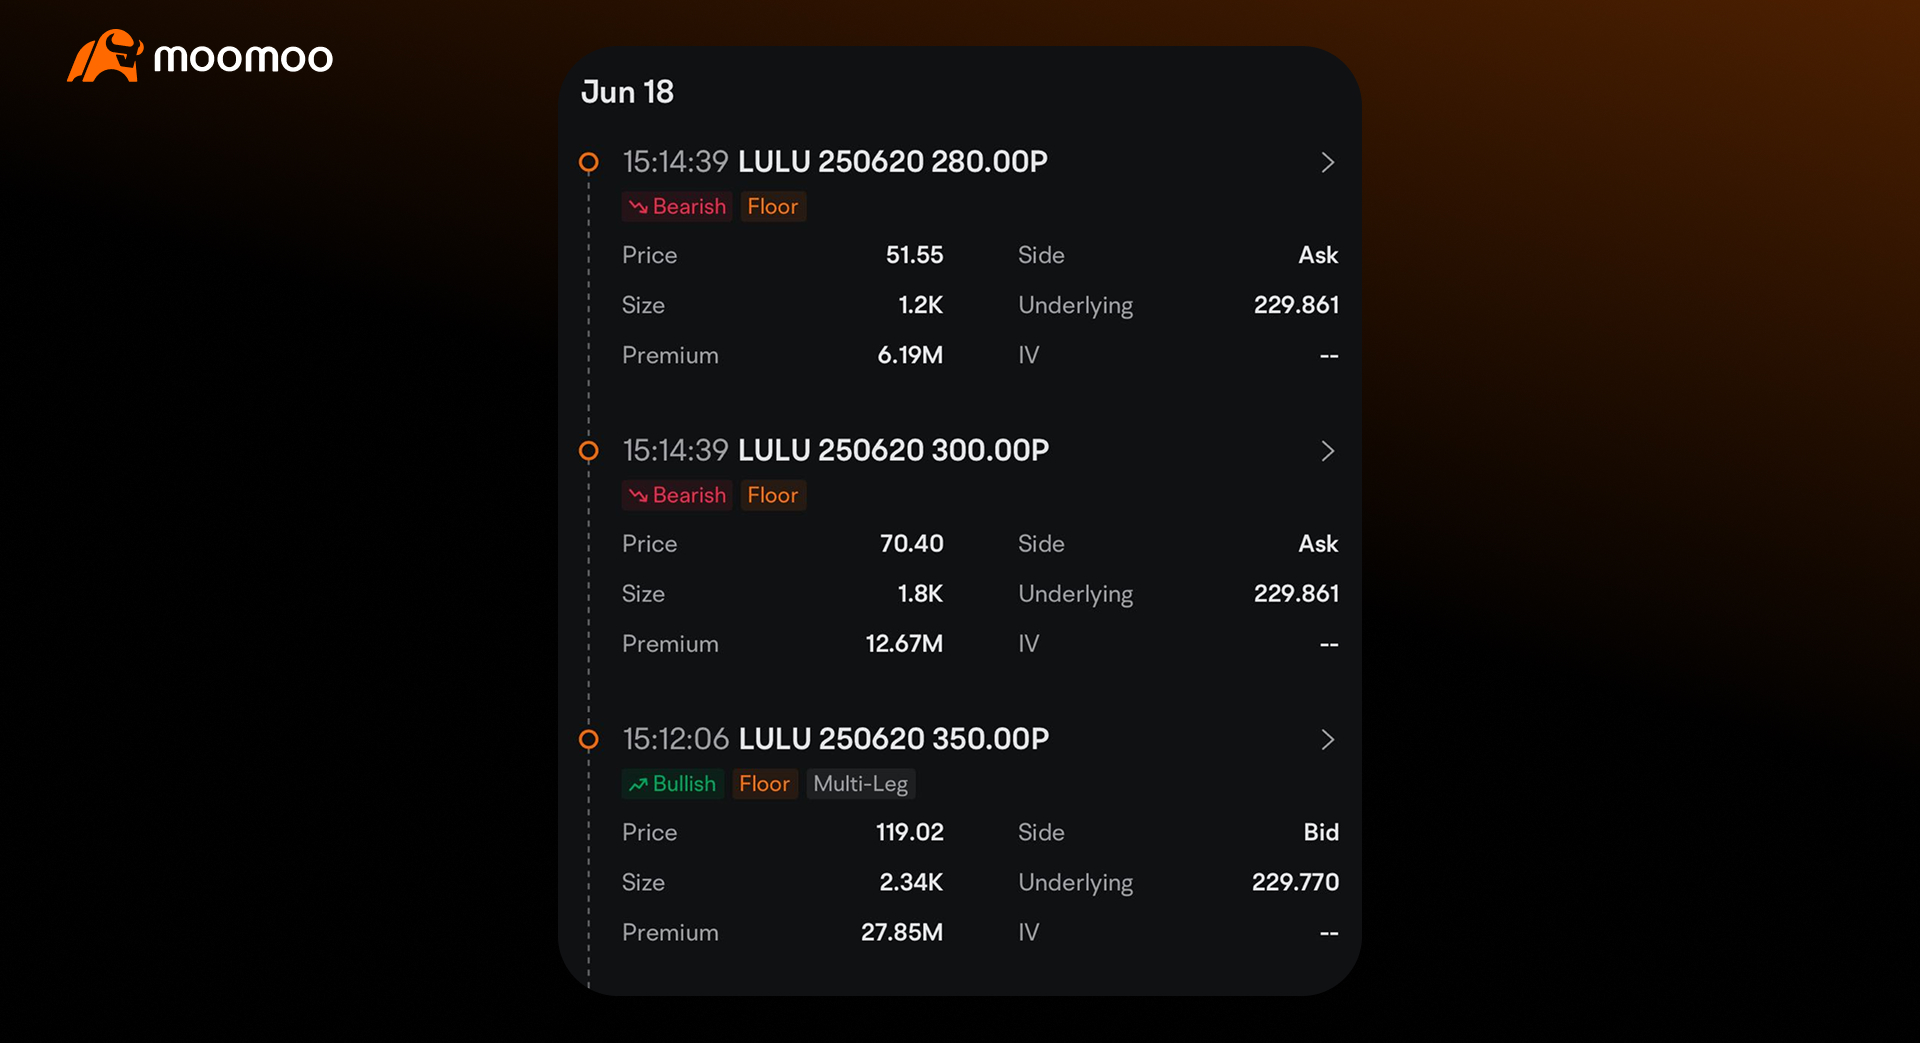
Monitoring for unusual option activity can sometimes signal that institutional investors or informed traders are taking significant positions, which might indicate an upcoming price movement in the underlying asset. This activity can be identified by looking for:
Large Block Trades: Unusually large single trades (blocks) of options contracts, especially in out-of-the-money (OTM) options, can suggest a strong directional conviction.
High Volume Relative to Open Interest: If the trading volume for a specific option contract significantly exceeds its open interest, it could mean new money is flowing into that option, rather than just existing positions being closed or rolled over.
Sweeps: Orders that are executed across multiple exchanges to fill a large order quickly, often indicating urgency and strong conviction.
Example: You observe a sudden surge in volume for deep OTM call options on a particular company, far exceeding its typical daily volume and open interest, with no apparent news. This could be a signal that a large player anticipates a significant upward move in that company, prompting further investigation.
Where to Find Options Chains in moomoo
To access options chains in moomoo:
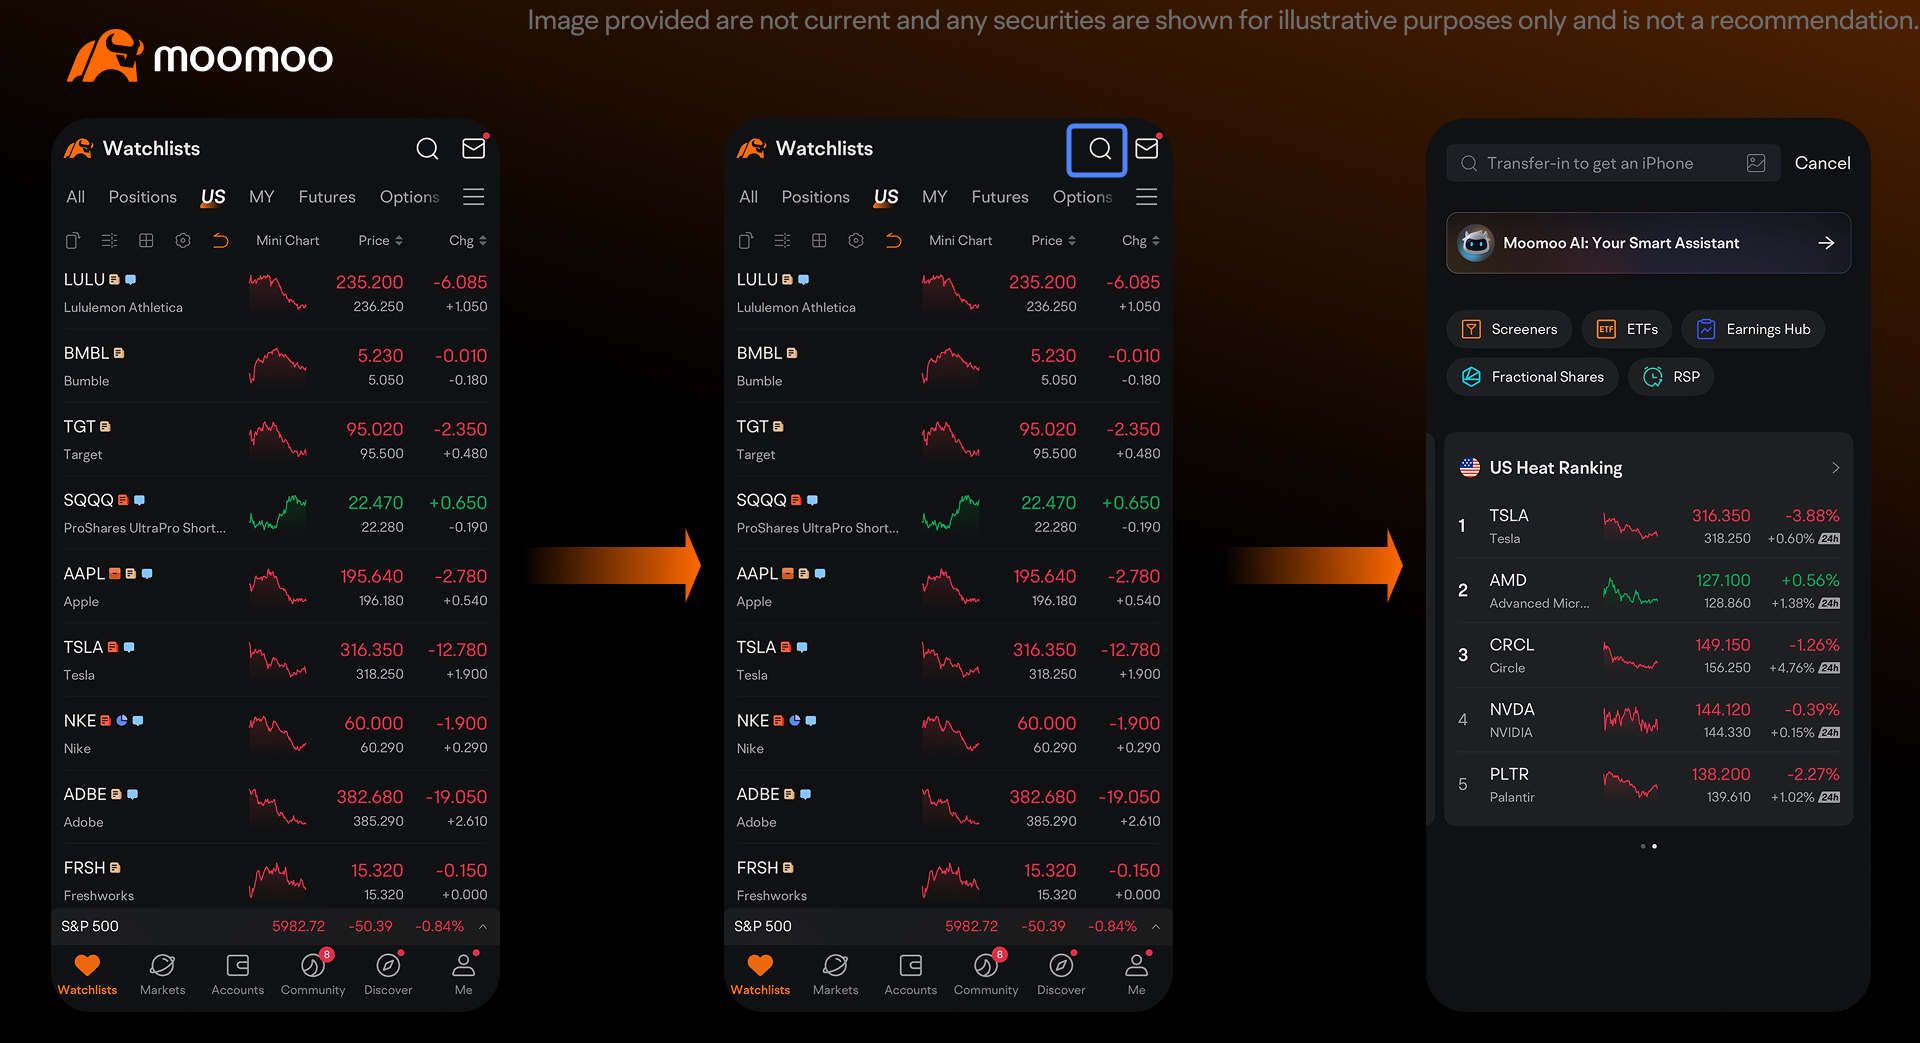
1. Open Moomoo App: Launch the Moomoo app on your device. Upon opening, the app will automatically take you to the default watchlist page, where you can view your saved stocks and assets. This page serves as your starting point for navigating the app’s features.
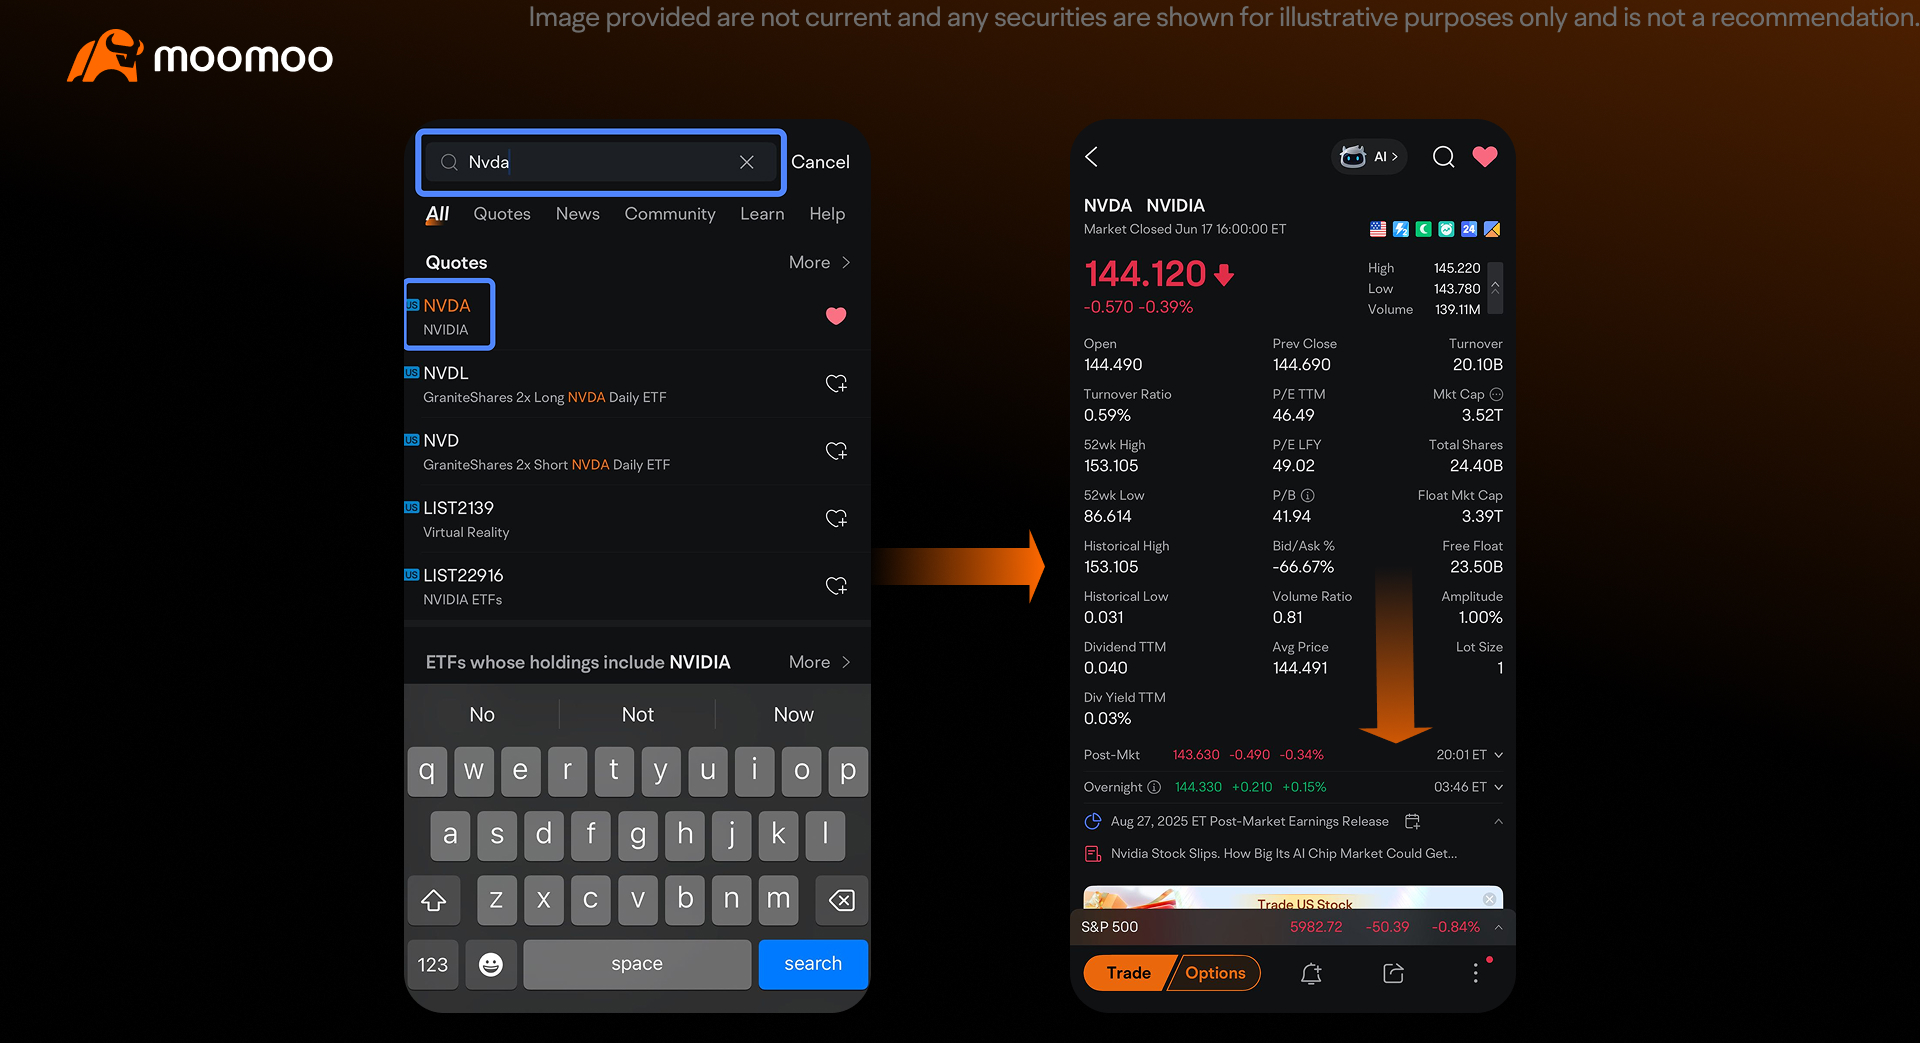
2. Search for the Underlying Asset: Locate and tap the search icon positioned in the top left corner of the watchlist page to initiate a search. This icon opens the search bar, allowing you to input the stock or asset you’re interested in. Enter the stock symbol (e.g., NVDA for Nvidia) in the search bar, ensuring accuracy. Browse the list of results that appear, then select the desired underlying asset to proceed to its dedicated details page.
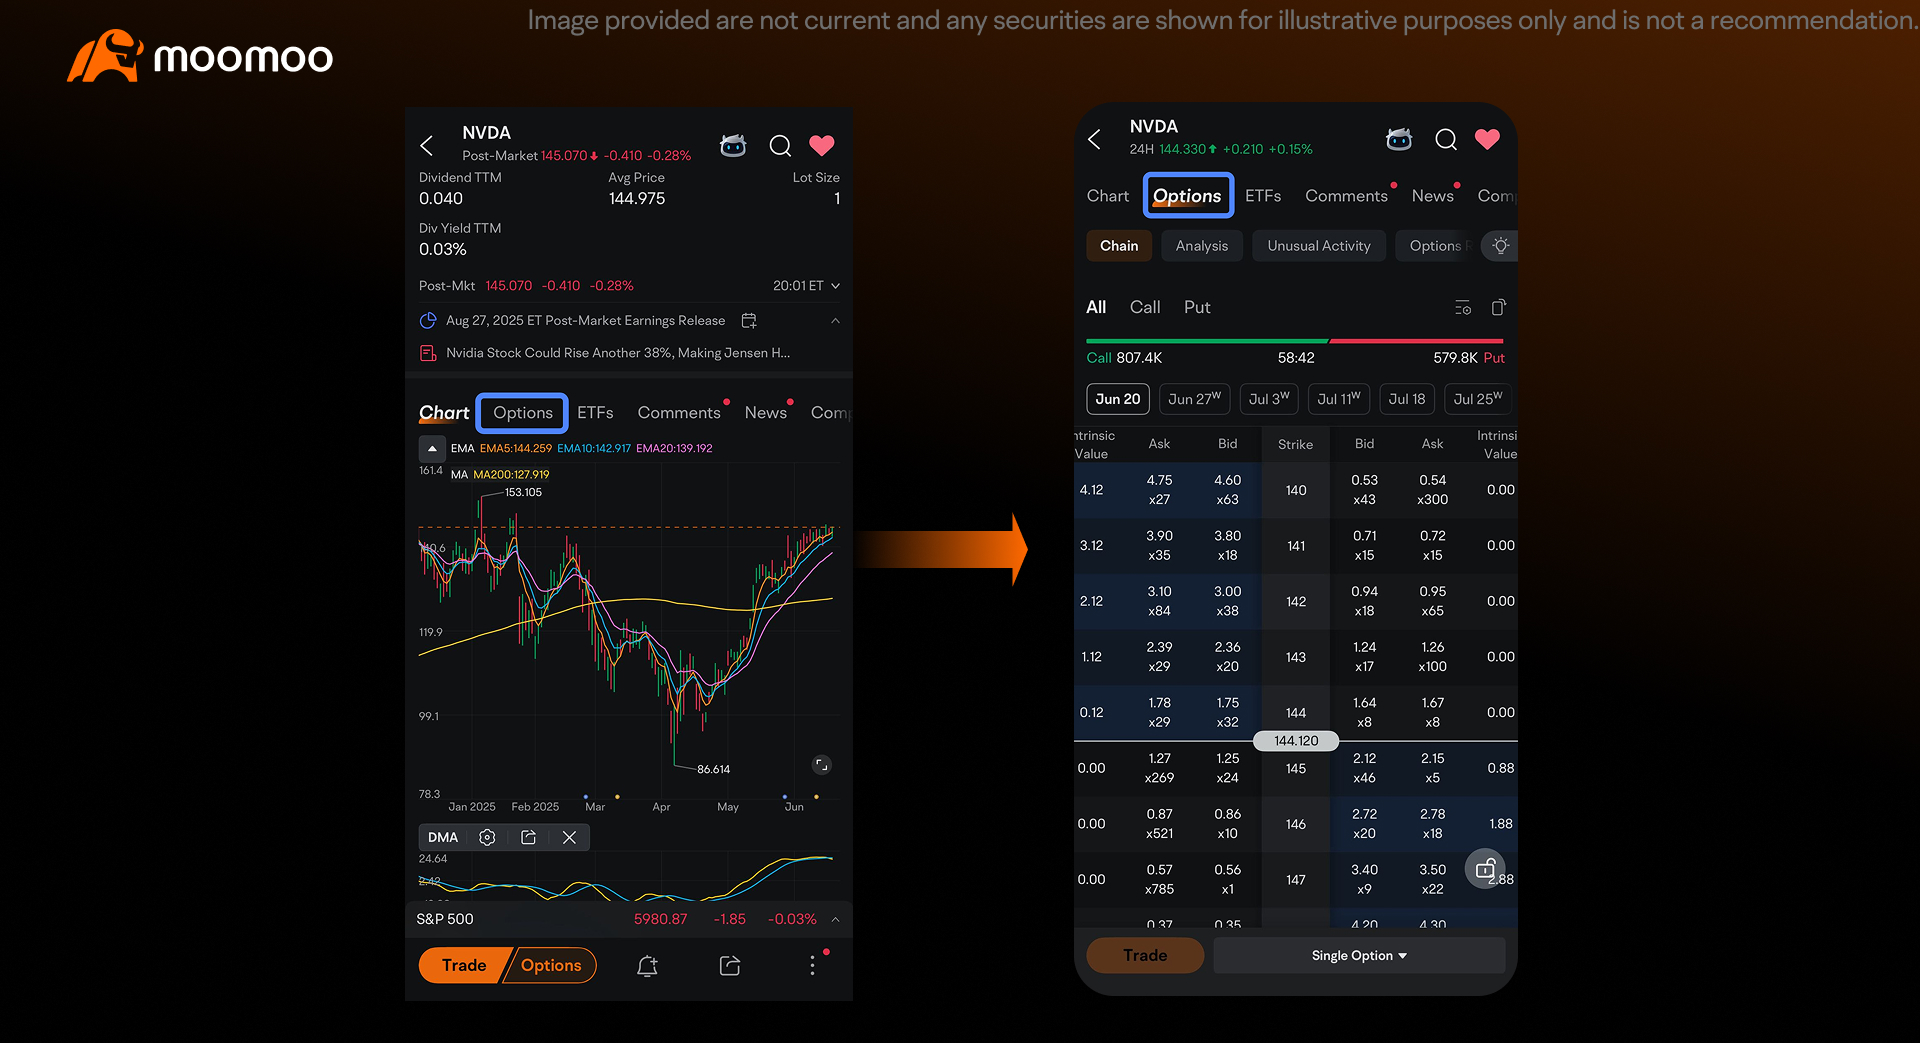
3. Access the Options Tab: Once on the underlying asset’s details page, which provides a comprehensive overview including price, charts, and other data, scroll down through the content. Look for the Options tab situated beside the chart tab. Tap this tab to access and view the full options chain for the selected asset, displaying all available options contracts.
Under the Options tab, you’ll also discover a variety of powerful tools designed to elevate your trading experience—including detailed P/L analysis for simulate profits and losses, volatility analysis to gauge market fluctuations, unusual activity alerts to identify significant movements, and several other advanced features to strengthen your options trading strategy.
Conclusion: Mastering Options Chain Analysis
Mastering options chain analysis is an indispensable skill for anyone serious about options trading. It transforms a seemingly complex array of numbers into a powerful source of actionable insights. By diligently understanding each component—from strike prices and expiration dates to bid/ask spreads, volume, open interest, implied volatility, and the nuanced influence of the Greeks—traders can develop a profound understanding of market dynamics and the true value of options contracts.
Effective options chain analysis enables traders to:
• Make Informed Decisions: Move beyond guesswork by basing trading decisions on concrete data and market sentiment reflected in the chain.
• Identify Opportunities: Spot mispriced options, anticipate potential price movements, and uncover favorable risk-reward scenarios.
• Manage Risk: Utilize the Greeks and other data points to assess and manage the inherent risks associated with options trading, allowing for more controlled and strategic positions.
• Implement Diverse Strategies: Apply hedging, speculative, and income generating strategies with precision, tailoring them to specific market conditions and personal objectives.
While the journey to mastery requires continuous learning and practice, the rewards are significant. The options chain is not merely a data table; it is a window into the collective expectations and activities of the market. By consistently applying the analytical framework discussed in this document, avoiding common pitfalls, and leveraging advanced tools, traders can significantly enhance their proficiency, navigate the options market with greater confidence, and ultimately improve their trading outcomes. Embrace the options chain as your primary guide, and it will unlock a world of strategic possibilities in your trading endeavors.
Disclaimer
Options trading entails significant risk and is not appropriate for all customers. It is important that investors read Characteristics and Risks of Standardized Options before engaging in any options trading strategies. Opening new options positions close to or on their expiration date comes with substantial risk of losses for reasons that include potential volatility of the underlying security and limited time to expiration. Options transactions are often complex and may involve the potential of losing the entire investment in a relatively short period of time. Certain complex options strategies carry additional risk, including the potential for losses that may exceed the original investment amount. Supporting documentation for any claims, if applicable, will be furnished upon request.
This presentation is for informational and educational use only and is not a recommendation or endorsement of any particular investment or investment strategy. Investment information provided in this content is general in nature, strictly for illustrative purposes, and may not be appropriate for all investors. It is provided without respect to individual investors’ financial sophistication, financial situation, investment objectives, investing time horizon, or risk tolerance. You should consider the appropriateness of this information having regard to your relevant personal circumstances before making any investment decisions. Past investment performance does not indicate or guarantee future success. Returns will vary, and all investments carry risks, including loss of principal. Moomoo makes no representation or warranty as to its adequacy, completeness, accuracy or timeliness for any particular purpose of the above content.
Moomoo is a financial information and trading app offered by Moomoo Technologies Inc.
In Canada, order-execution only services available through the moomoo app are provided by Moomoo Financial Canada Inc., regulated by the Canadian Investment Regulatory Organization (CIRO).
Frequency Asked Questions
What is the difference between option chain and open interest?
An options chain is a comprehensive table that lists all available option contracts for a specific underlying asset, organized by expiration date and strike price. It presents a wide array of data points for each contract, including bid/ask prices, last price, volume, implied volatility, and open interest, among others. Open interest, on the other hand, is one specific data point found within an options chain. It represents the total number of outstanding (or open) option contracts for a particular strike price and expiration date that have not yet been closed out, exercised, or expired. Open interest is a measure of market participation and liquidity for a specific contract. While the options chain provides the full landscape of available contracts and their characteristics, open interest is a key metric within that chain that indicates the level of active interest and commitment from traders for a given option.
How do I read the option chain?
Reading an options chain involves understanding its structure and the meaning of its various data points. Here's a simplified guide: 1. Locate the Underlying Asset: First, identify the stock or ETF you are interested in. 2. Identify Call and Put Sections: The chain is typically divided into two main sections: calls (left) and puts (right). 3. Select an Expiration Date: Choose the expiration date that aligns with your trading horizon. Options are grouped by these dates. 4. Examine Strike Prices: Look at the range of strike prices available for your chosen expiration. These are usually listed down the middle of the chain. 5. Analyze Key Data Points for Each Contract: For each strike price and expiration, you'll find columns with crucial information: - Last Price: The price at which the option last traded. - Bid/Ask: The current buy and sell prices. The bid is what buyers are willing to pay, and the ask is what sellers are willing to accept. The tighter the spread, the more liquid the option. - Volume: The number of contracts traded today. High volume indicates active trading. - Open Interest: The total number of outstanding contracts. High open interest suggests significant market interest. - Implied Volatility (IV): The market's expectation of future price movement. Higher IV means higher option premiums. - The Greeks (Delta, Gamma, Theta, Vega): These values help you understand how the option's price will react to changes in the underlying asset's price, time, and volatility. 6. Look for In-the-Money (ITM) and Out-of-the-Money (OTM) Options: On the left side (Calls): - The contracts above the current price marker (where the strike price is below the underlying price) are generally In-the-Money (ITM). - The contracts below the price marker (where the strike price is above the underlying price) are generally Out-of-the-Money (OTM). On the right side (Puts): - The contracts below the current price marker (where the strike price is above the underlying price) are generally In-the-Money (ITM). - The contracts above the price marker (where the strike price is below the underlying price) are generally Out-of-the-Money (OTM). 7. Assess Liquidity: Prioritize options with high volume and open interest, and narrow bid-ask spreads, as these are easier to trade.
This presentation is for informational and educational use only and is not a recommendation or endorsement of any particular investment or investment strategy. Investment information provided in this content is general in nature, strictly for illustrative purposes, and may not be appropriate for all investors. Read more