Volatility Analysis: How to estimate an option's value more accurately?
The prices of options with different strike prices and different maturities vary greatly and can not be compared directly.
So, is there a good analysis method to determine whether the option price at a certain point in time may be a better value or not?
The answer is YES. Option Implied Volatility Analysis, a practical tool on moomoo, can help you estimate an option's potential value more accurately.
① What is implied volatility
Implied volatility reflects the market's expectations of the underlying stock's future price movements.
The unknown variable implied volatility can be inferred from some known variables, including the underlying price, the option price, interest rates, and time to expiration, based on a pricing model.
It can thus generally be considered a more accurate indicator of options’ value than option prices.
Expect the stock will have significant fluctuations in the future
Investors tend to offer higher bids for its options, pulling up options' prices, and options' implied volatility will rise correspondingly, assuming all other things remain constant.
Expect the stock to remain relatively stable
Investors are more likely to offer lower bids for its options, pushing down options' prices, and options' implied volatility will thus fall, assuming all other things remain constant.
Implied volatility can help make more informed trading decisions, including:
For trading a single option, implied volatility can help us determine a potentially profitable trading direction and measure market sentiment.
② How to find [Option Volatility Analysis] on moomoo
Step 1: Tap on a stock > Options > Chain > a specific option contract. Enter the option's Detailed Quotes page by double-clicking its symbol.
Step 2: Tap on Analysis > Volatility Analysis.
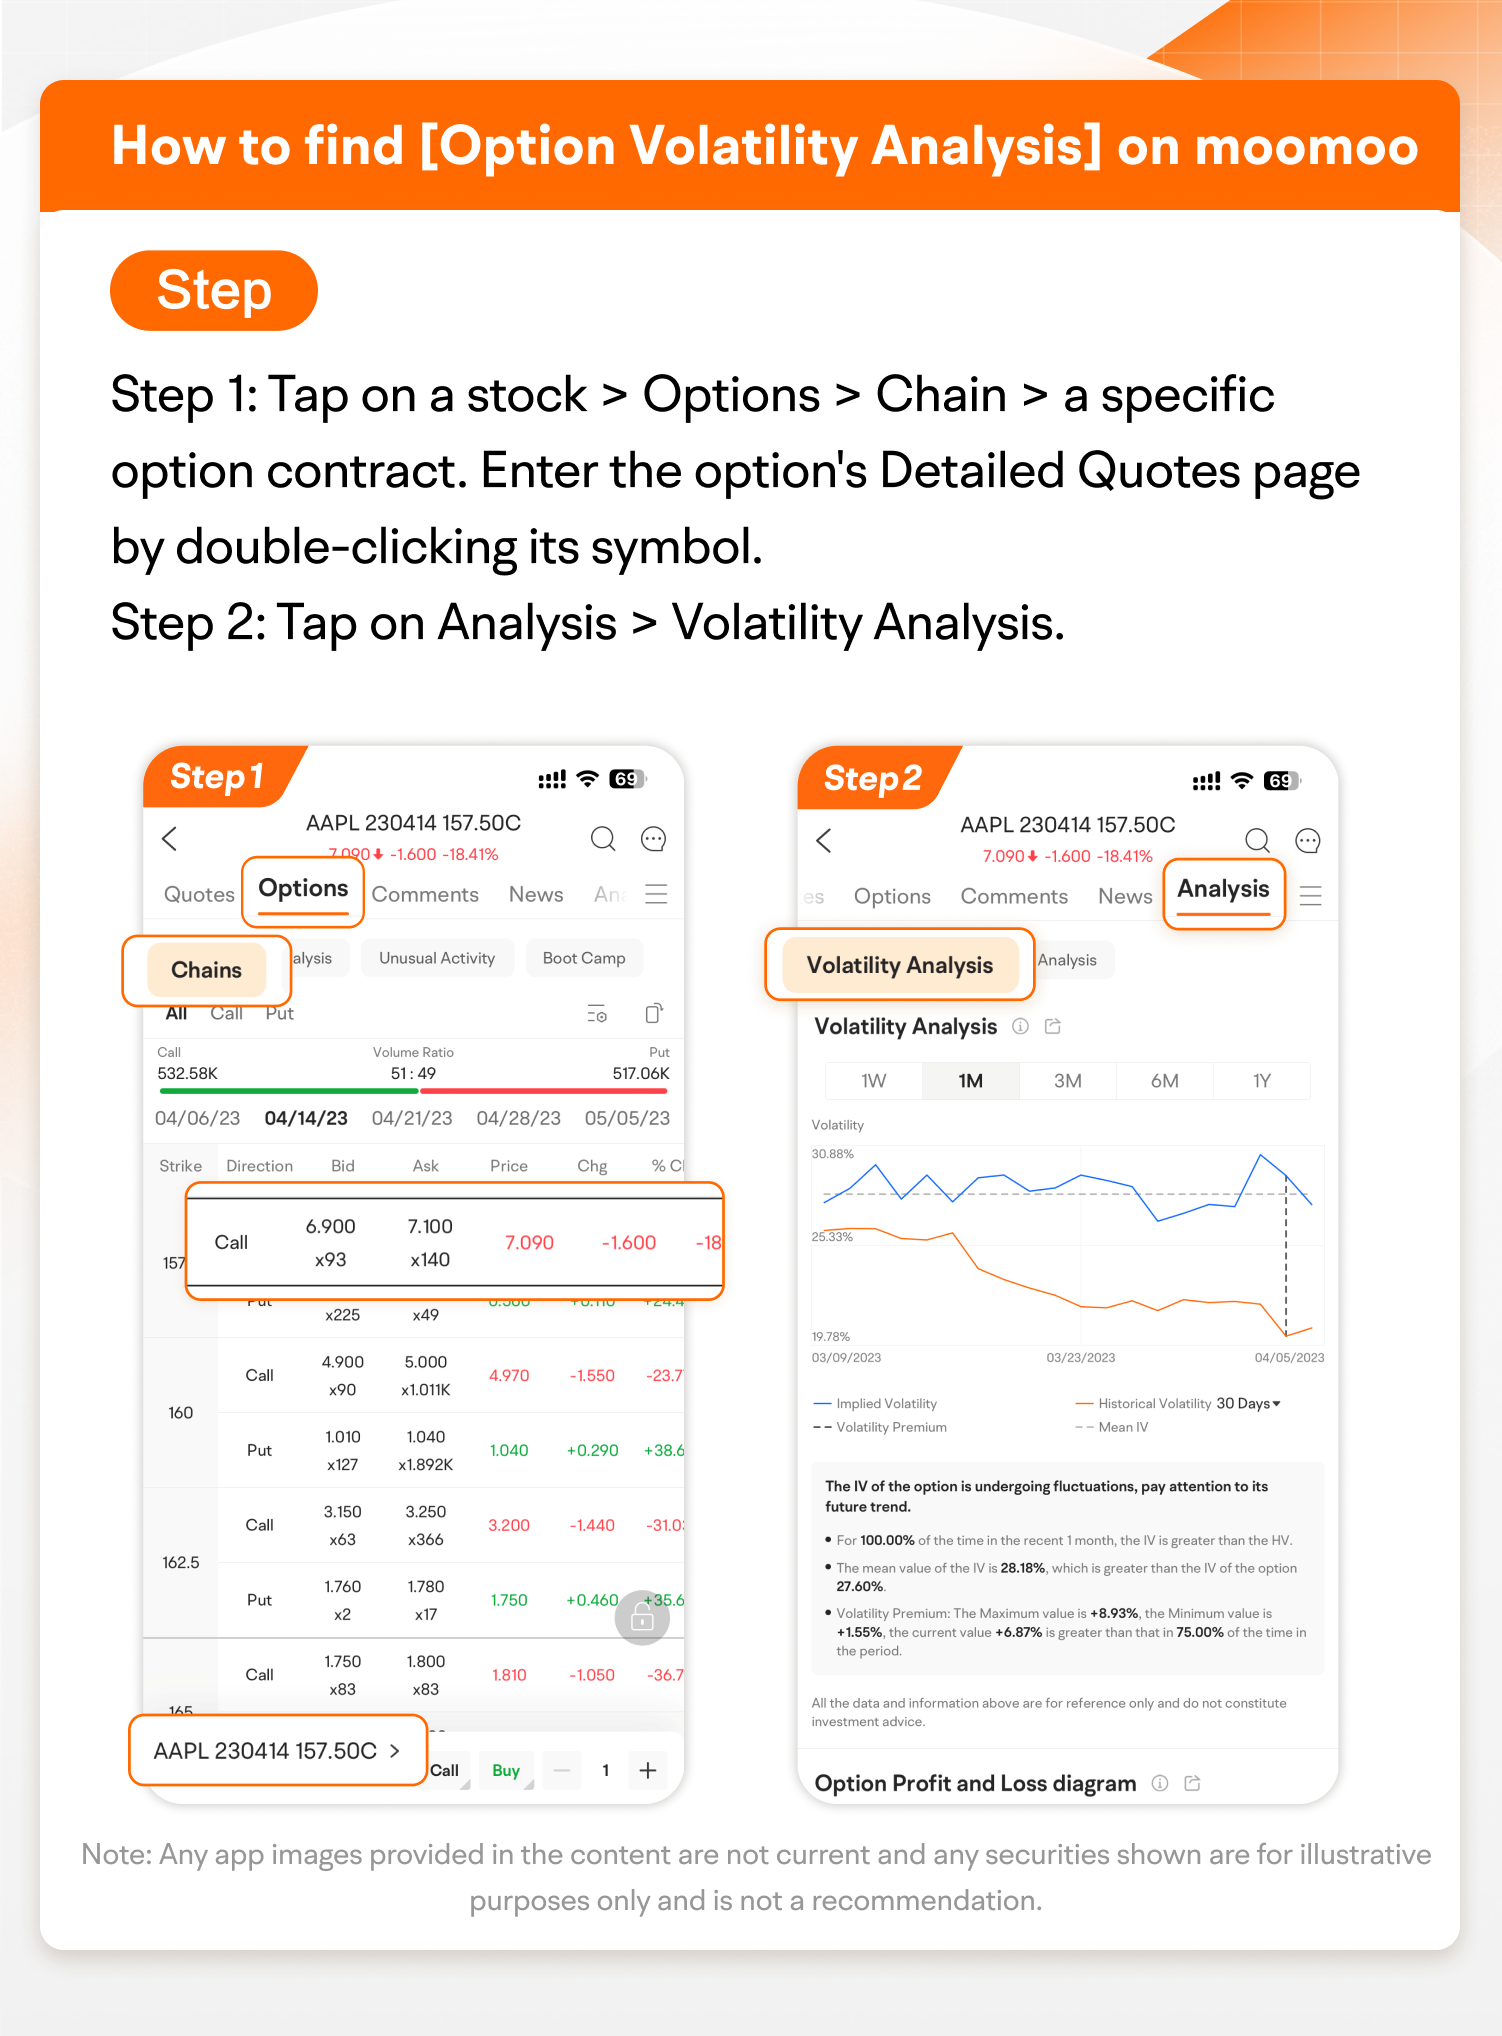
Let's now dive into the options tools on moomoo that offer key information about implied volatility.
③ Comparing implied volatility with historical volatility
Analyzing implied volatility of a single option contract can help us determine a potentially profitable trading direction and measure market sentiment.
The general consensus in the market is that:
Implied volatility has a nature of mean reversion, meaning that it tends to revert to its historical average over time.
The implication for investors is the opposite:
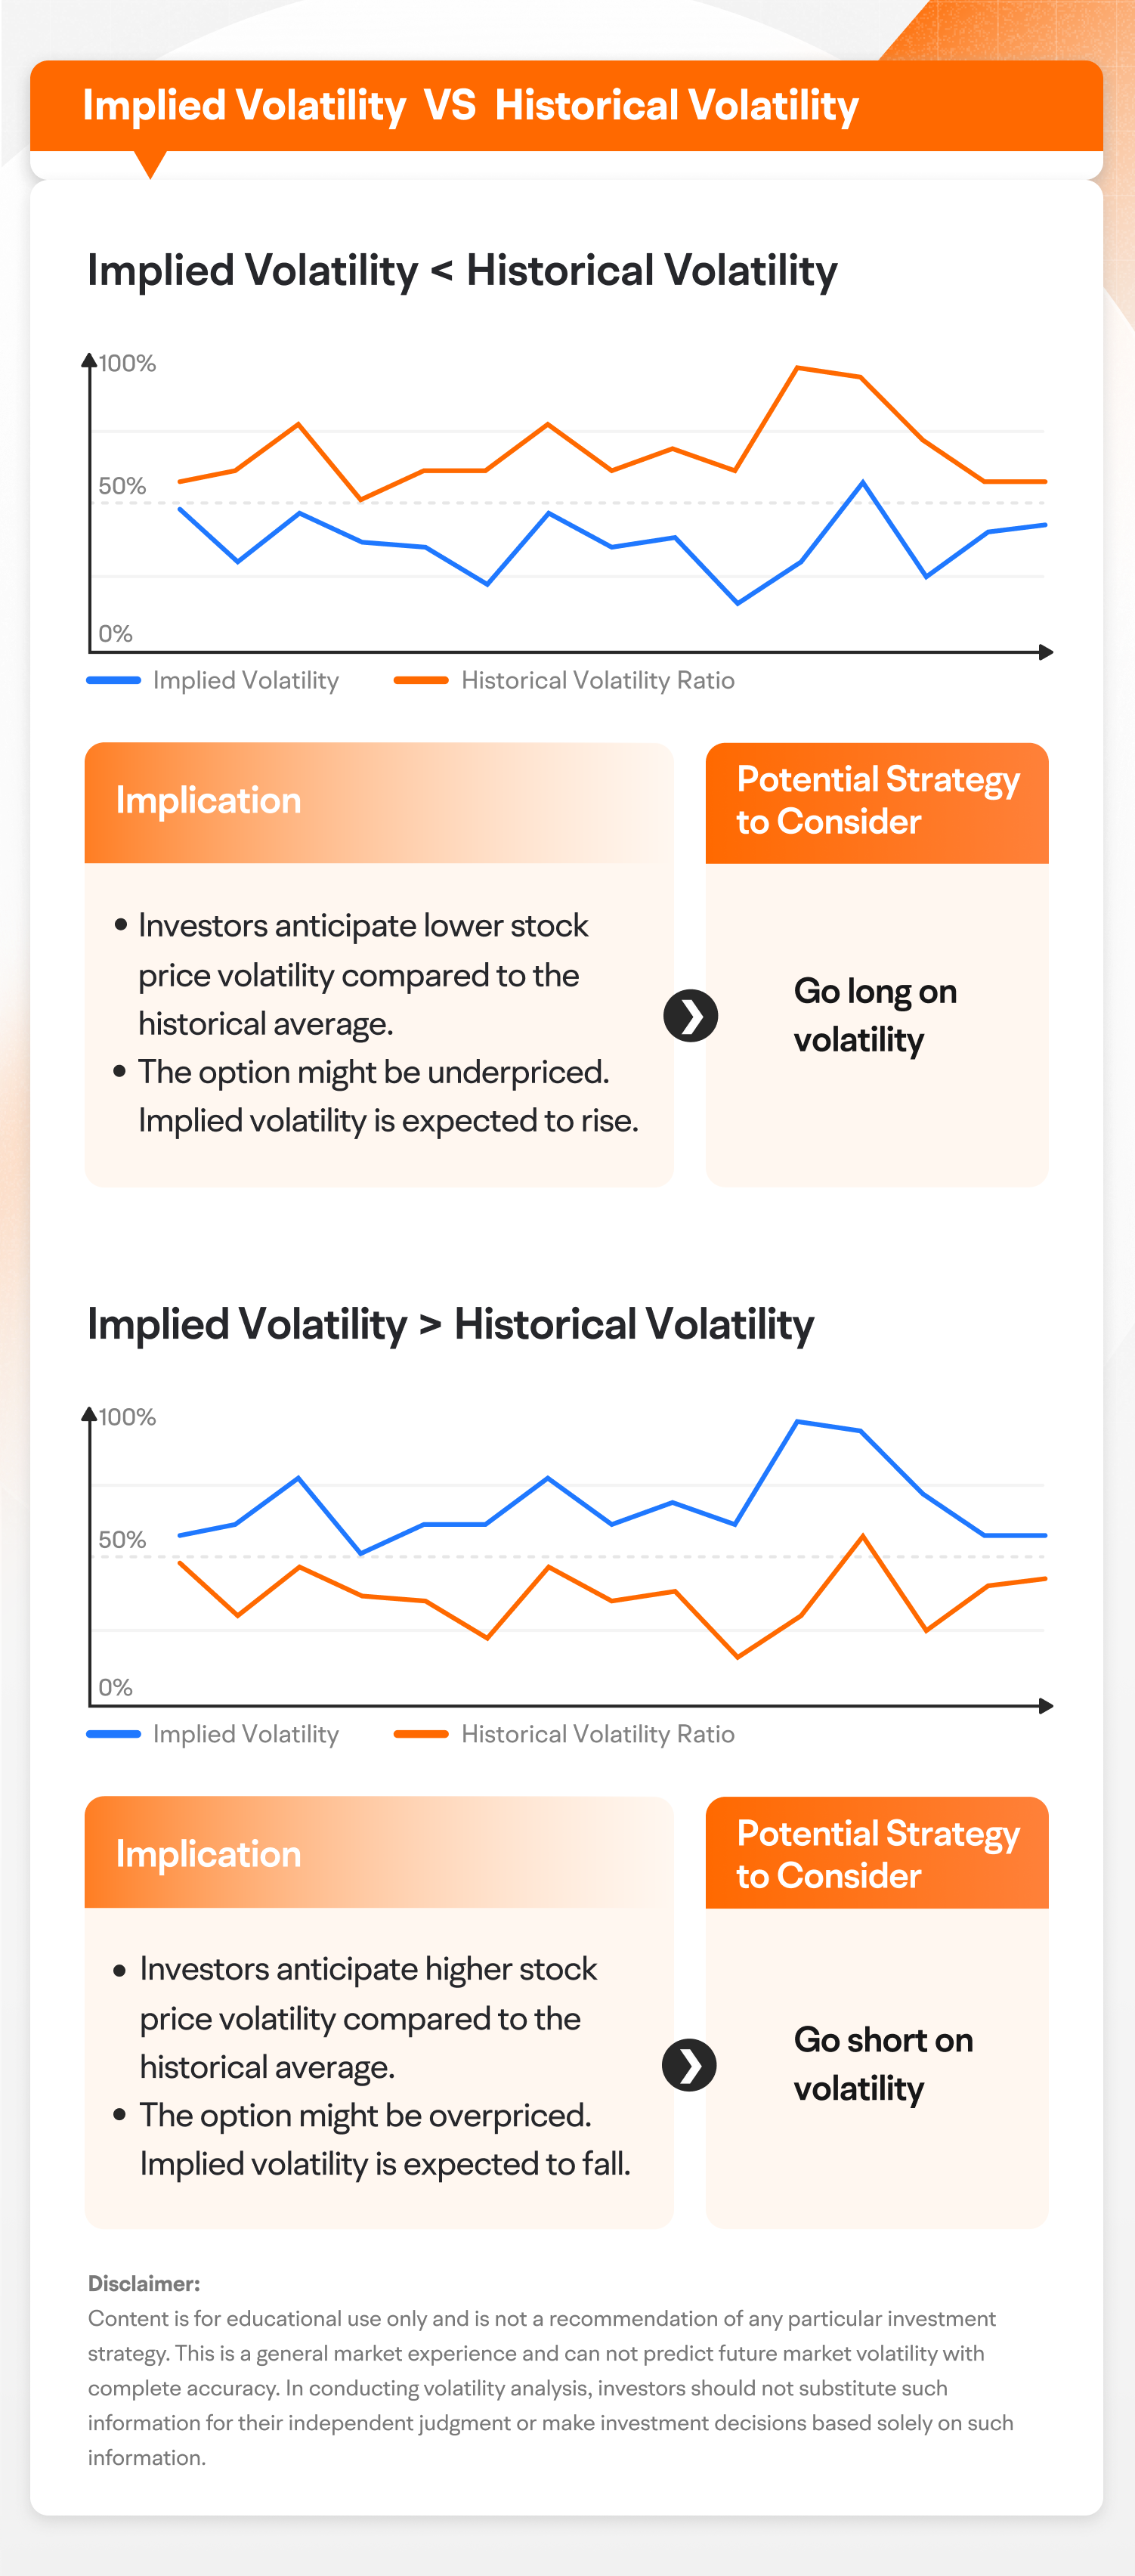
Without considering the direction (delta neutral). When the implied volatility is low, we may consider buying options. When the implied volatility is high, we may consider selling options.
So, how to determine the level of implied volatility? That will be compared with historical volatility.
As a general rule of thumb:
④ Using implied volatility with the underlying price trend to gauge market sentiment
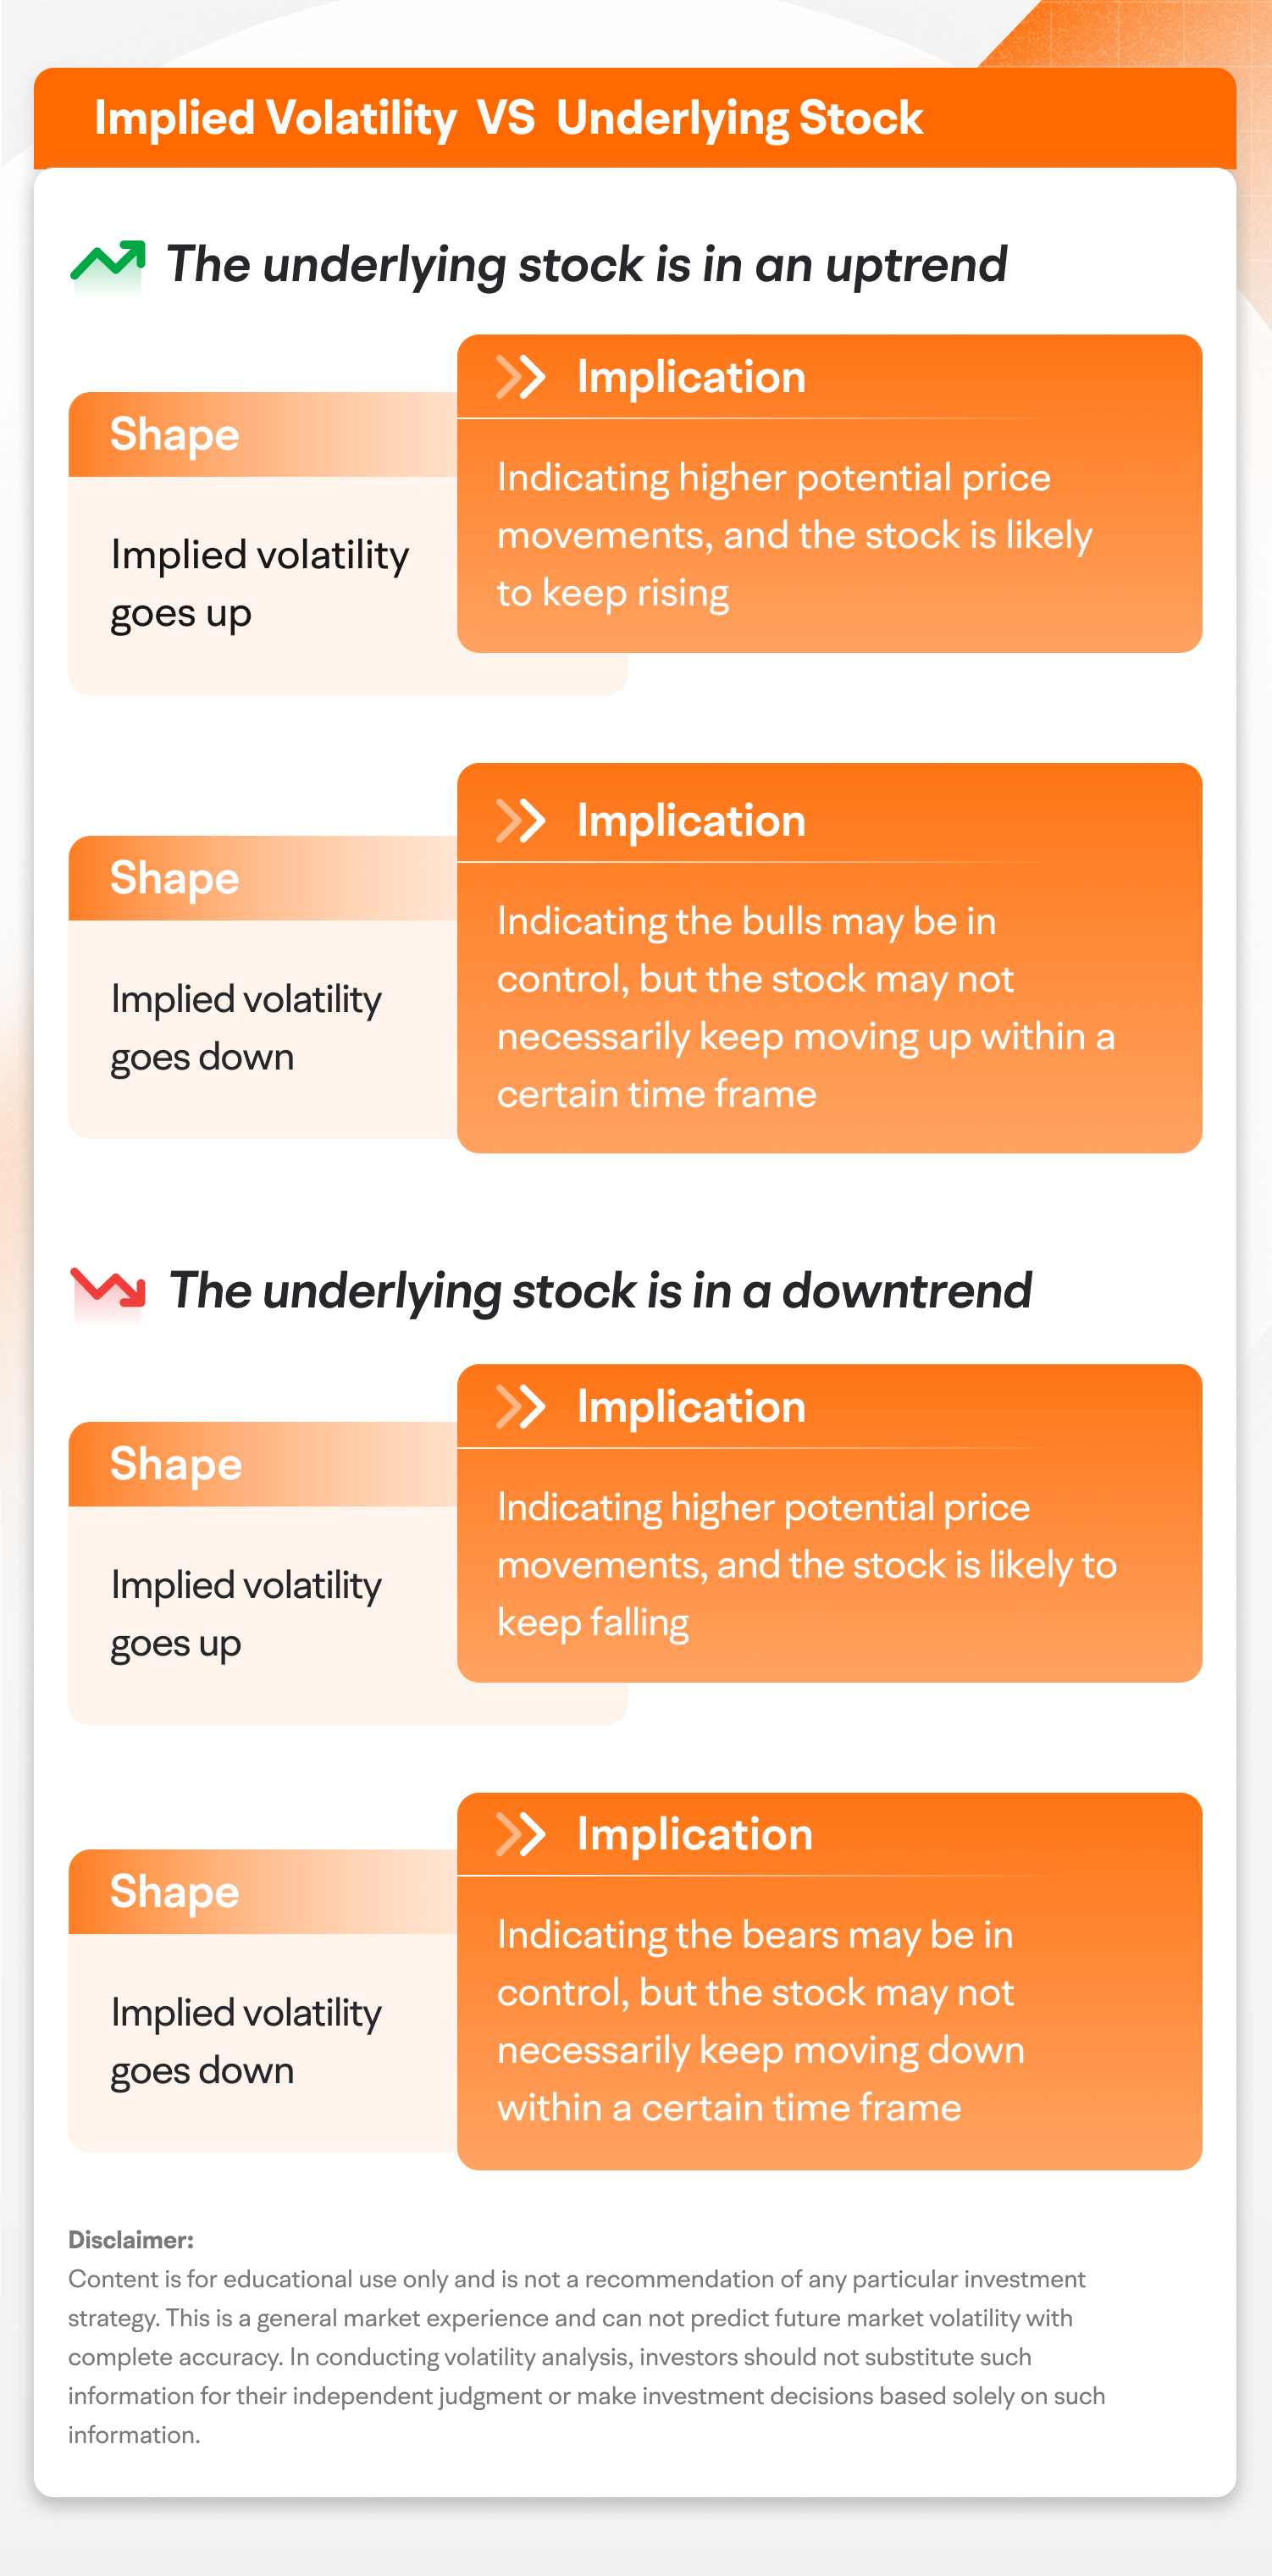
Since implied volatility reflects the market's expectations of the underlying stock's future price movements, it can be an indicator of market risk and uncertainty.
When used in conjunction with the underlying price trend, implied volatility can help us estimate where the market could be heading.
In many cases:
That's what today's lesson is all about. If you want to learn more about options, please follow [Moo Options Explorer] for timely updates!

This presentation is for informational and educational use only and is not a recommendation or endorsement of any particular investment or investment strategy. Investment information provided in this content is general in nature, strictly for illustrative purposes, and may not be appropriate for all investors. Read more