Options P/L Curve Tutorial: Simulate your Options Trade to Visualize Potential Profit and Loss
In the fast-paced world of finance, options trading is a favorite due to its flexibility. However, traditional profit and loss (P&L) tools often don’t meet the needs of advanced traders looking for deeper insights.
That’s where our new Options P/L Curve comes in—a next-level upgrade to the standard P&L chart. This tool lets you easily adjust your options orders for different market scenarios and simulate potential profits and losses for various expiration dates.
With the Options P/L Curve, you can enhance your trading strategies with ease. And the best part? It’s completely free for all users. Option traders, give it a try and see how it can improve your trading experience!
Ⅰ. What is the Options P/L Curve?
The Options P/L Curve is a dynamic tool that helps investors analyze the profit, loss, and risk associated with their options orders. It's especially useful for multi-leg options trades, providing a clearer view of risk-reward dynamics across various scenarios. Here are some highlights:
Convenient order management: Add options or underlying stocks directly on the chart and easily adjust strike prices, expiration dates, trading direction, and quantities.
Comprehensive analysis: Access detailed insights on theoretical max profit and loss, breakeven points, and the effects of time decay and volatility changes.
Scenario simulation: Simulate potential outcomes by adjusting time to expiration and implied volatility (IV) after placing your order
Ⅱ. How to use the Options P/L Curve
Imagine it’s earnings season, and you want to use a multi-leg options strategy to try to capitalize on potential stock price movements. Let’s use NVIDIA as an example and explore how the Options P/L Curve can enhance your strategy.
The Option Strategy Builder is intended to assist option investors in evaluating a strategy based on their market expectations and user-input specifications. The tool does not provide recommendations or investment advice, and the strategies presented may not be exhaustive. Some features of the tool use theoretical models which do not guarantee future results. Ensure any option strategy selected aligns with your personal investment goals and risk tolerance. Please review and confirm all trade details carefully before execution.
1) Access the feature
Path 1: Via Strategy Builder
Go to NVIDIA's stock quote page.
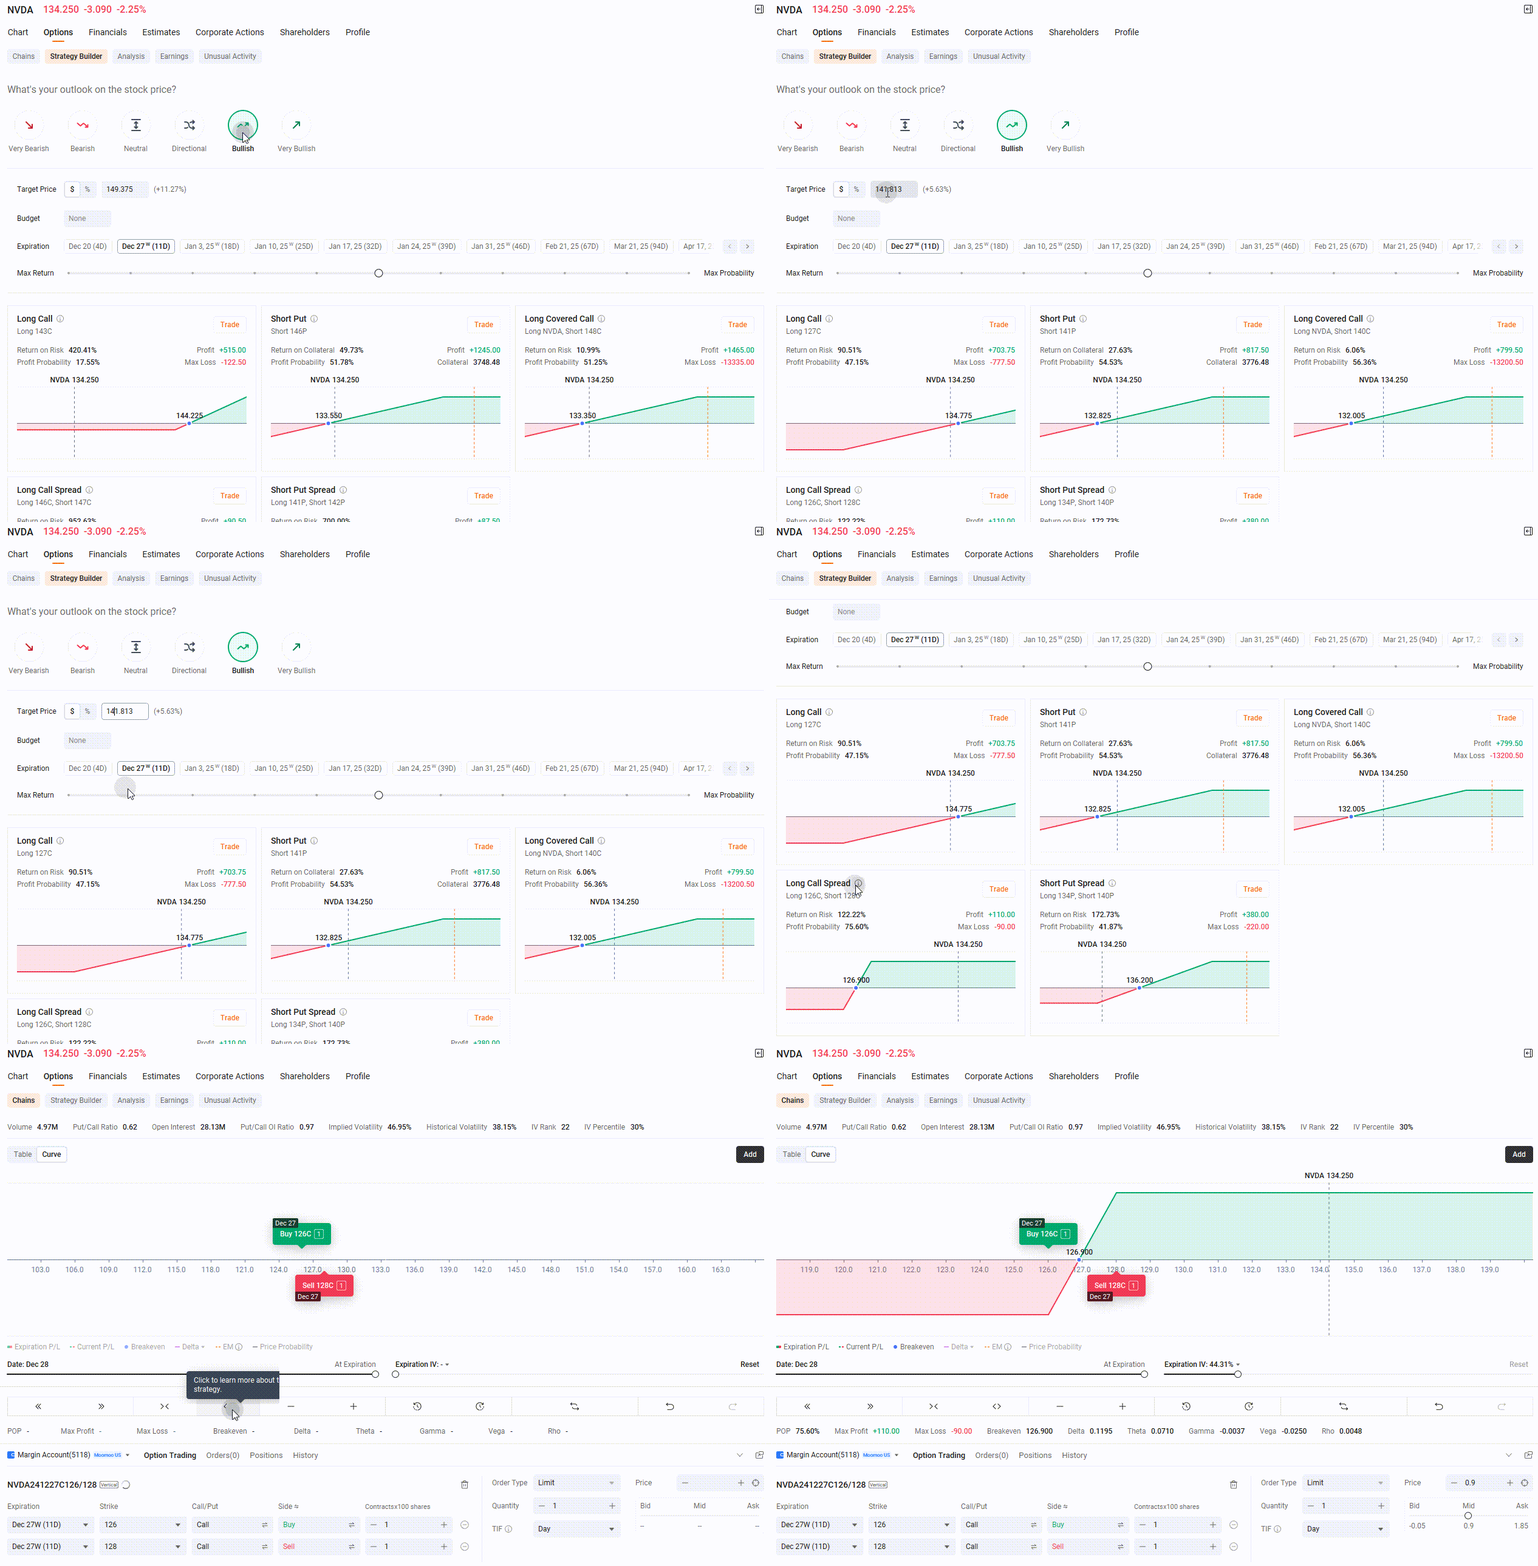
Click on Options > Strategy Builder.
Choose a market sentiment option based on your outlook: Very Bearish, Bearish, Neutral, Directional, Bullish, or Very Bullish. For an optimistic outlook, select Bullish.
Set your target price and budget. Five relevant strategies will appear: Long Call, Short Put, Long Covered Call, Cash-Secured Put, and Short Put Spread. Click the "i" icon next to each to learn more.
Select Long Call Spread. The system will direct you to the projected profit and loss curve chart specific to your chosen strategy.
NOTE: Images provided are not current and any securities are shown for illustrative purposes only and is not a recommendation.
Path 2: Via Options Chain
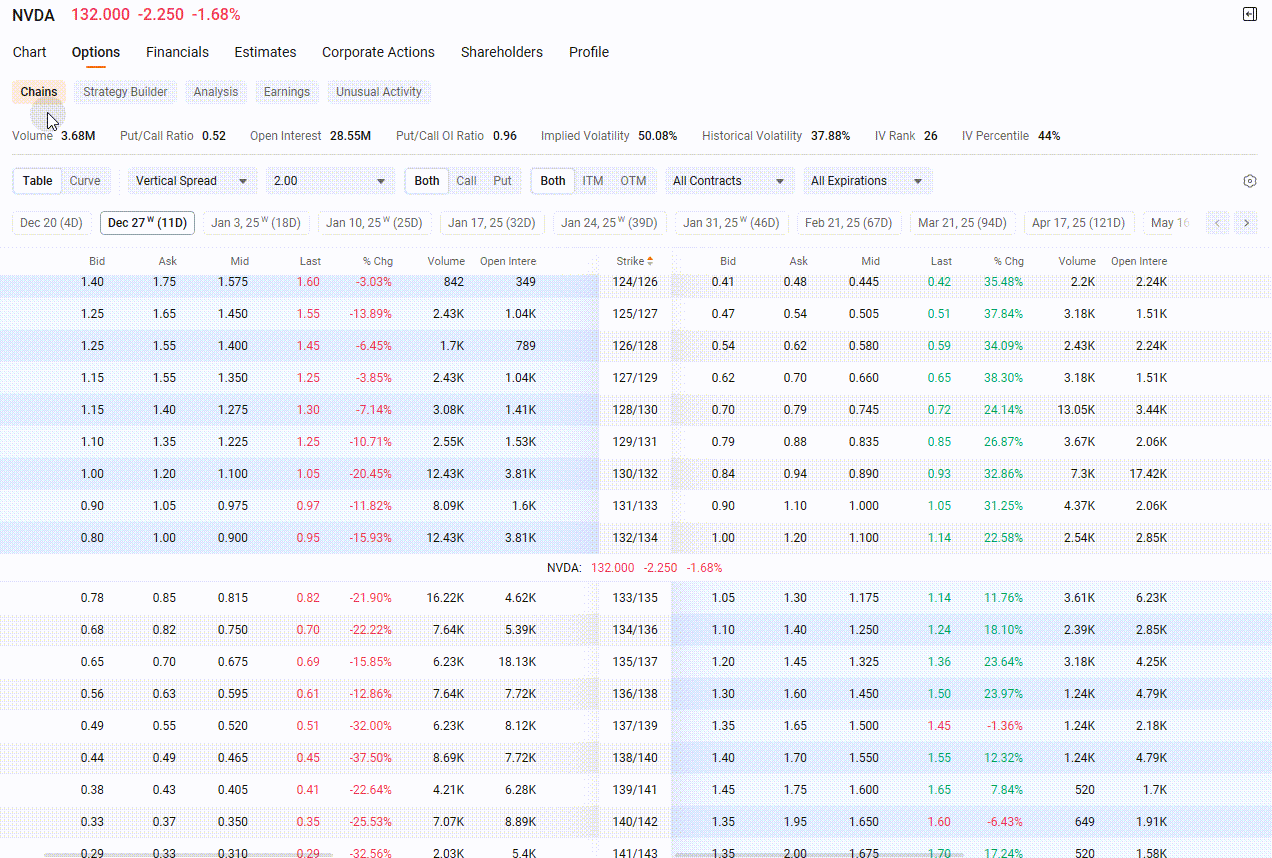
Go to NVIDIA's stock quote page and click on the Options tab, then select Chains.
Choose Vertical Spread as your options strategy and choose an appropriate strike price and expiration date.
Right-click the option picked and select Buy Options Strategy to indicate a Long Call Spread.
Click on Curve to access the curve page.
NOTE: Images provided are not current and any securities are shown for illustrative purposes only and is not a recommendation.
2)Understand Options P/L Curve
Once on the curve page, you'll find valuable chart data to analyze your options strategy's potential risk and reward.
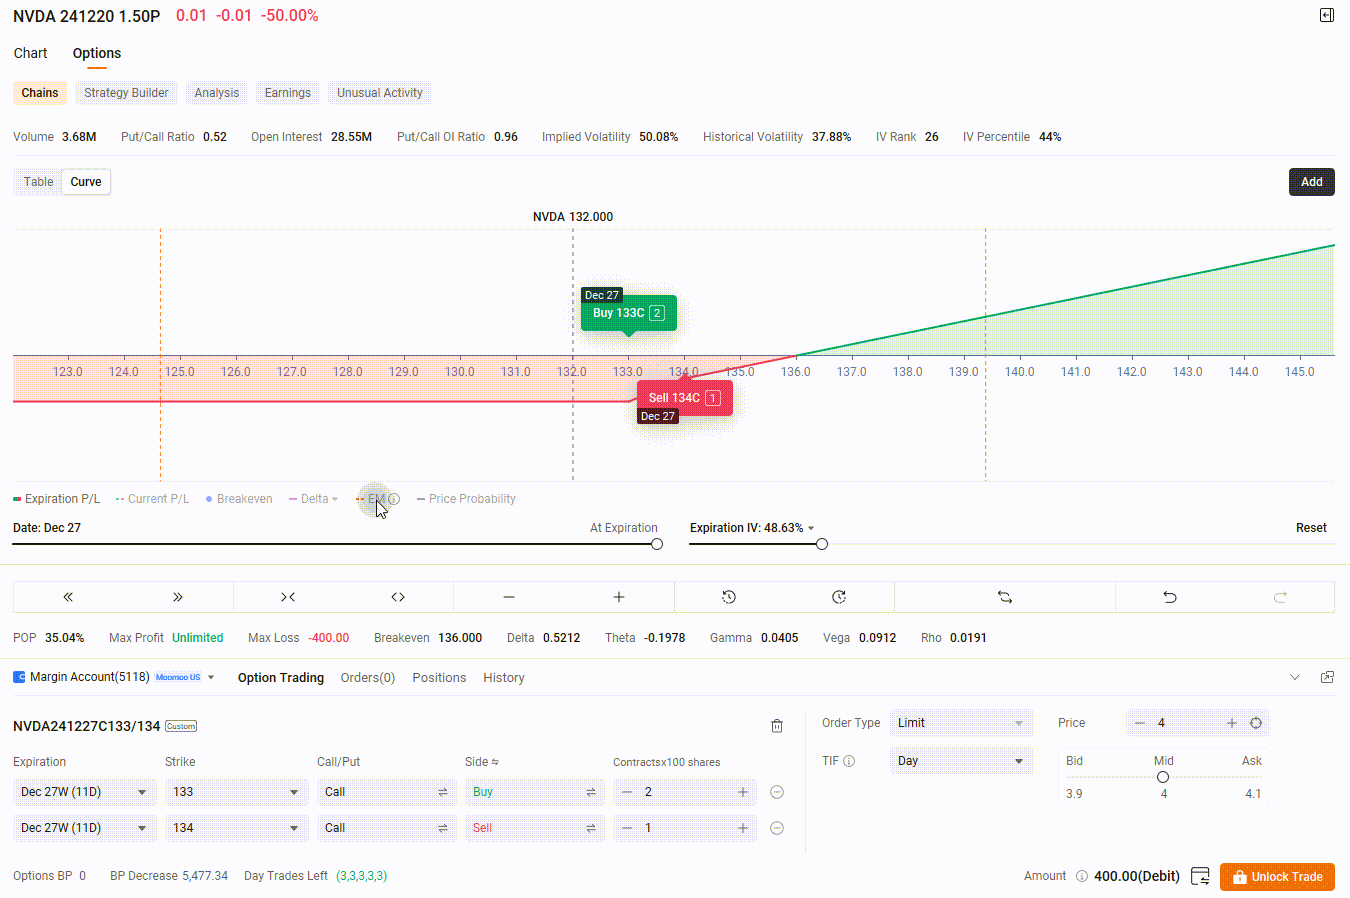
Initially, you'll see the Expiration P/L for your chosen strategy. To customize your view, use the legends in the lower left corner to display or hide additional indicators such as Current P/L, Breakeven, Greeks, Expected Move (EM), and Price Probability.
For instance, if you want to focus on risk exposure, click the arrow next to a Greek and select the ones you find relevant to display on the chart. If the indicators become cluttered, you can simplify your view by greying out all indicators except Expiration P/L and Current P/L.
The Options P/L Curve includes two fixed indicators and three variable indicators:
Fixed indicators:
Expiration P/L: This shows the profit or loss of your order on expiration day at various stock prices.
EM: This indicates the potential range of stock price fluctuations.
NOTE: Images provided are not current and any securities are shown for illustrative purposes only and is not a recommendation.
Variable indicators:
Current P/L Curve: Simulates the dynamic profit and loss of your order at different times and IV levels. As the expiration date approaches, the Current P/L and Expiration P/L charts will start to overlap.
Greek Values: Displays the dynamic changes in Delta, Gamma, Theta, Vega, and other Greeks for your order based on the selected date and IV.
Price Probability: Shows the potential stock price movement at the specified date and IV.
Implied Volatility (IV): Expiration IV shows the option’s volatility at the maturity of option contract, Underlying IV reflects overall market expectations for the selected symbol, and Historical Volatility (HV) shows how much the underlying's price has changed in the past.
You can adjust the date and expected implied volatility (IV) using the sliders below the chart. For example, to analyze your profit and loss strategy for December 18th with an expected IV of 50.08%, slide the date to December 14th and you have a choice of looking at 3 options: Expiration IV, Underlying IV or HV.
Once adjusted, hover over the chart to view expiration P/L at a specific stock price.
NOTE: Images provided are not current and any securities are shown for illustrative purposes only and is not a recommendation.
3)Adjust strike price, expiration date, direction, and contract quantity:
If you want to modify the strike price or expiration date of your options, you can easily do so directly within the Options P/L Curve page without returning to the options chain. Here are three methods to make adjustments:
On the chart:
Hover your mouse over the strike selector on the chart and right-click. A pop-up menu will appear with options for Expiration, Strike, Call/Put, Side, and Quantity.
Select the parameter you want to adjust and make your changes.
You can also click and hold the strike selector to drag it left or right to change the strike price, or up and down to alter the trading direction.
NOTE: Images provided are not current and any securities are shown for illustrative purposes only and is not a recommendation.
In the order section:
The order area is at the bottom of the page. Here, you will see options for Expiration, Strike, Call/Put, Side, and Quantity.
Click on the parameter you wish to modify and enter the new values.
Using icons:
Below the chart, you will find small icons that allow for quick adjustments.
Click these icons to increase or decrease the strike price, adjust the difference between strike prices, change the quantity of contracts, extend or shorten the expiration date, or switch trading direction.
NOTE: Images provided are not current and any securities are shown for illustrative purposes only and is not a recommendation.
Change your options strategy:
If you want to modify your strategy, such as transitioning from a Long Call Spread (Bull Call Spread) to a Long Call Butterfly by adding two legs, follow these steps:
Right-click on your current strategy, or click the Add button located at the top right of the page.
Select the new option legs you want to add to create your Long Call Butterfly.
Once you’ve made the adjustments, the page will automatically update to display the profit and loss analysis for your new Long Call Butterfly strategy.
Certain option strategies including multi-leg trades are more complex and carry additional risk. There may also be additional costs associated with multi-leg option strategies, such as spreads, straddles, and collars.
NOTE: Images provided are not current and any securities are shown for illustrative purposes only and is not a recommendation.
Explore these tools to enhance your investment journey!
Disclaimer
Options trading entails significant risk and is not appropriate for all customers. It is important that investors read Characteristics and Risks of Standardized Options before engaging in any options trading strategies. Opening new options positions close to or on their expiration date comes with substantial risk of losses for reasons that include potential volatility of the underlying security and limited time to expiration. Options transactions are often complex and may involve the potential of losing the entire investment in a relatively short period of time. Certain complex options strategies carry additional risk, including the potential for losses that may exceed the original investment amount. Supporting documentation for any claims, if applicable, will be furnished upon request.
Options trading subject to eligibility requirements. Strategies available will depend on options level approved.
The Option Strategy Builder is intended to assist option investors in evaluating a strategy based on their market expectations and user-input specifications. The tool does not provide recommendations or investment advice, and the strategies presented may not be exhaustive. Some features of the tool use theoretical models which do not guarantee future results. Ensure any option strategy selected aligns with your personal investment goals and risk tolerance. Please review and confirm all trade details carefully before execution.
Options volatility rankings: Keep in mind that implied volatility values, IV Rankings, and IV Percentiles are theoretical estimates, and the actual market conditions may not always align with the theoretical information shown. Therefore, traders should exercise caution and use multiple sources of information when making investment decisions. There is no guarantee or assurance that the use of any tools or data provided on the moomoo app will result in investment success or reduce investment risk.
This information is provided without respect to individual investors’ financial sophistication, financial situation, investment objectives, investing time horizon, or risk tolerance. You should consider the appropriateness of this information having regard to your relevant personal circumstances before making any investment decisions. Past investment performance does not indicate or guarantee future success. Returns will vary, and all investments carry risks, including loss of principal.
Moomoo is a financial information and trading app offered by Moomoo Technologies Inc. Securities offered through moomoo Financial Inc, Member FINRA/SIPC.
This presentation is for informational and educational use only and is not a recommendation or endorsement of any particular investment or investment strategy. Investment information provided in this content is general in nature, strictly for illustrative purposes, and may not be appropriate for all investors. Read more