Micron shares at a crossroads. What will happen next? (06/27/2024)

Hello, everyone! This week, our focus is on Micron Technology, Inc. $Micron Technology(MU.US)$, a global leader in memory-chip manufacturing. In this article, we’ll explore the latest trends and take a close look at the company’s recent market activity.
What’s new?
On June 27, 2024, Micron’s shares, which had been considered one of the AI-beneficiary stocks over the past year, tumbled over 7% following the release of the company’s latest earnings report.
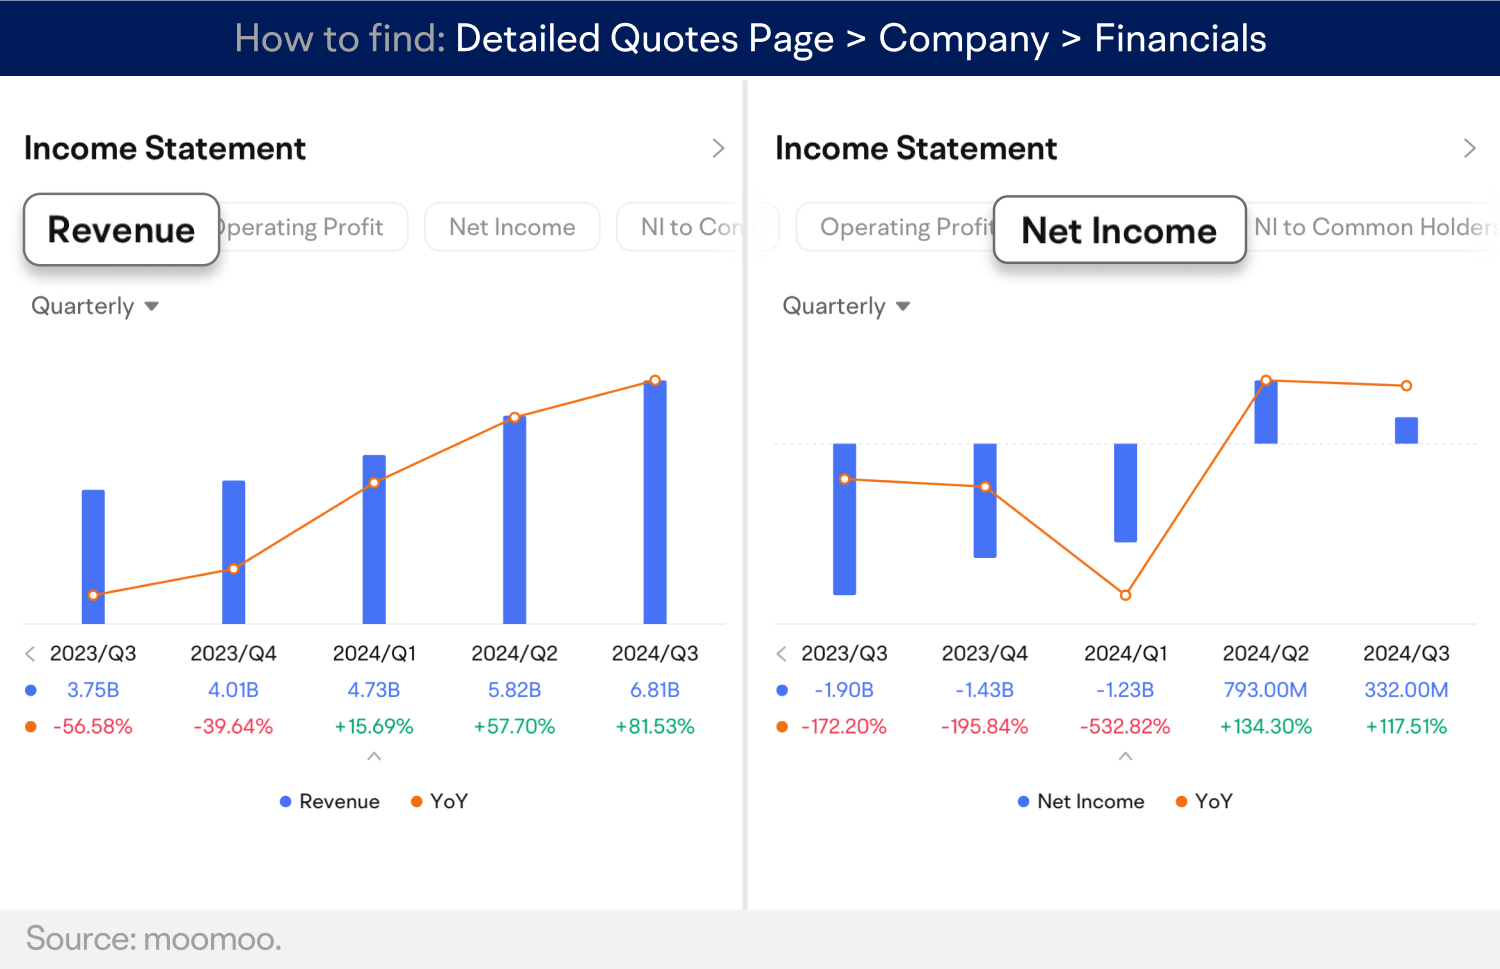
Although Micron reported stronger-than-expected financial results for the fiscal third quarter, its outlook for the fourth quarter was just in line with current expectations. As a result, the company was punished for not surpassing elevated expectations.
Over the past 18 months, Micron’s share price has tripled as investors pinned their hopes on the increased demand for memory to run AI applications in everything from data centers to personal computers. Micron’s new high-bandwidth memory (HBM) chips, which are a candidate for use alongside industry-leading chips from Nvidia for training large language models, are ramping up in volume.
For fiscal year 2025, Micron has only forecasted “record revenue and significantly improved profitability,” while also noting that this is not a formal forecast. Many analysts had expected Micron to beat and raise their forecasts for the fiscal fourth quarter and the next fiscal year. However, semiconductors often roll out slower than expected, and HBM chips were still described as being in the ramping phase.
Goldman Sachs analysts viewed the stock’s pullback as an opportunity to add positions, expecting the company to gain more market share in the lucrative HBM market.
Chart of the day
Trend analysis:
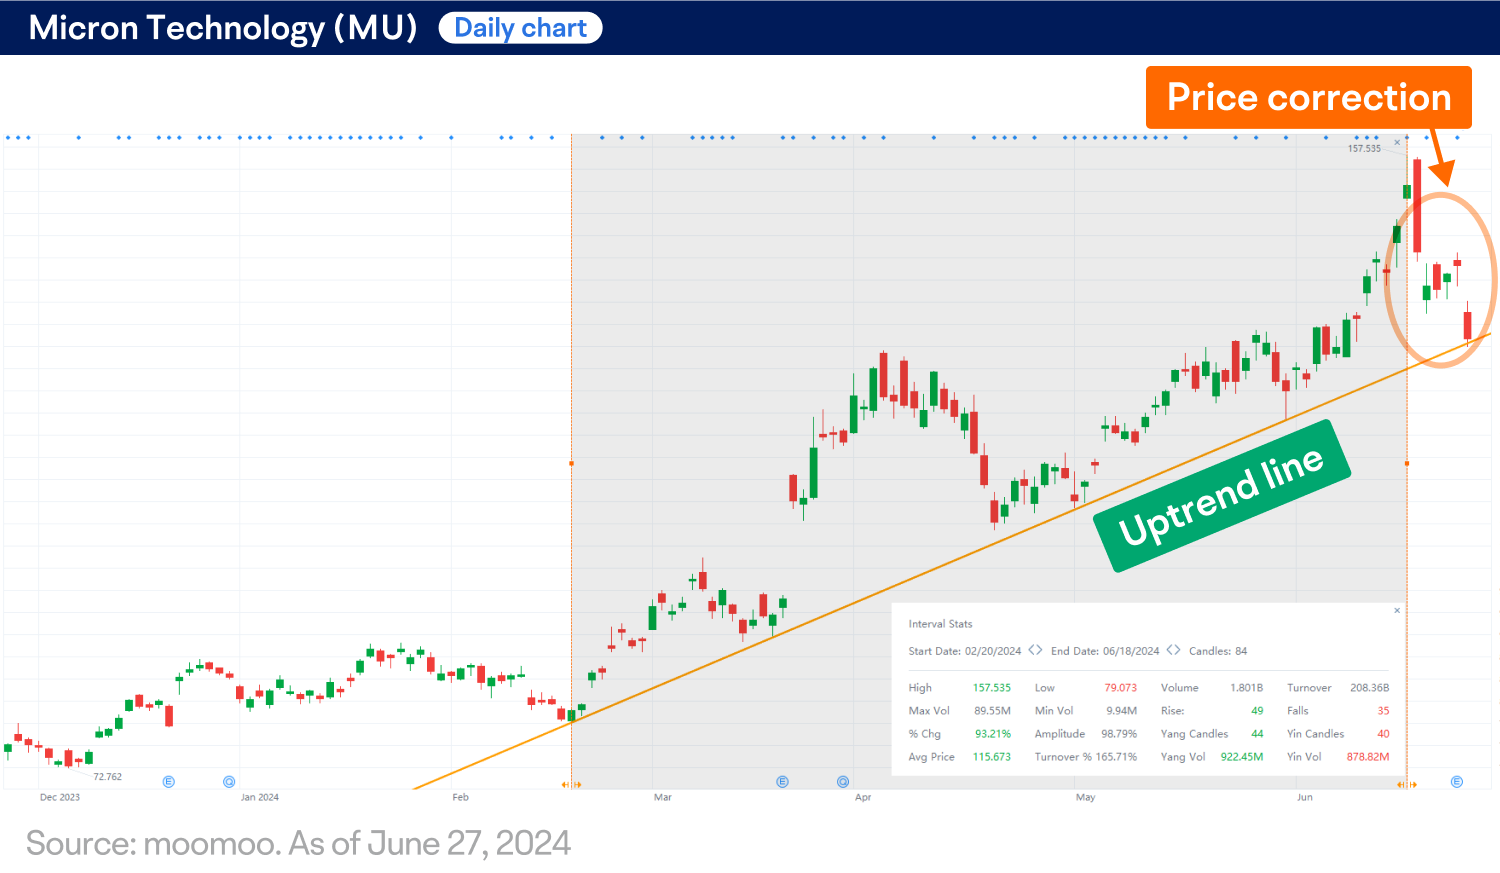
Micron’s shares (MU) have been on an upward trend since late February 2024, almost doubling within four months, as shown in the daily chart. Although recent selloffs have brought the stock into what is typically referred to as a correction territory, defined as a drop of between 10% and 20% from a bull-market high, the uptrend line remains intact.
Technical indicators:
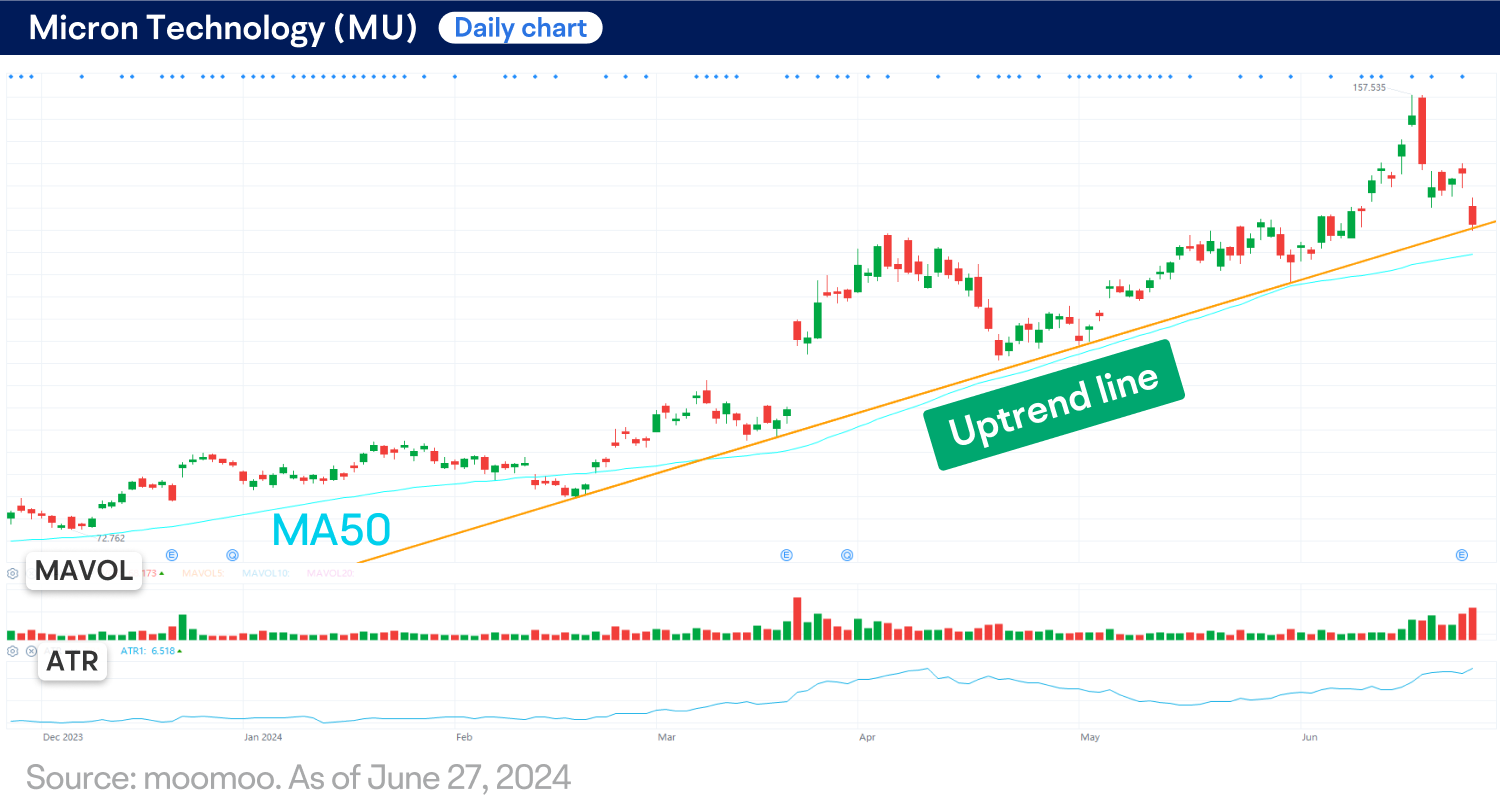
MU has been trading above the 50-day moving average (MA50) for over four months, signaling a mid-term bull market.
The trading volume has surged following the price pullback, indicating more selling pressures in the short term.
The average true range (ATR) indicator, which measures volatility at an absolute level and smooths out with a 14-day moving average, is increasing to an all-time high. This reflects a choppy market and the potential for a price breakout or reversal in the near future.
Next move?
Currently, MU is trading at a crucial level, where the uptrend line in the daily chart is being tested. The stock might receive some support around that level. However, a potential breakout of the line may signify more of a price reversal than a correction.
Traders may also monitor the potential support of the MA50 and the potential resistance around $144, which was the prior day’s high.
This presentation discusses technical analysis, other approaches, including fundamental analysis, may offer very different views. The examples provided are for illustrative purposes only and are not intended to be reflective of the results you can expect to achieve.
All investing involves risk, including the potential loss of principal, and there can be no guarantee that any investing strategy will be successful.
This presentation is for informational and educational use only and is not a recommendation or endorsement of any particular investment or investment strategy. Investment information provided in this content is general in nature, strictly for illustrative purposes, and may not be appropriate for all investors. Read more