Understanding divergence in technical analysis
01 What is divergence?
Divergence is a concept in technical analysis where the direction of the price movement and the behavior of a technical indicator do not align. It’s a signal that the current price trend may be losing strength, which could hint at an impending trend reversal.
Traders can spot divergence across various technical indicators and time frames, making it a versatile tool within a broader trading strategy.
There are three main types of divergence: bullish, bearish, and hidden.
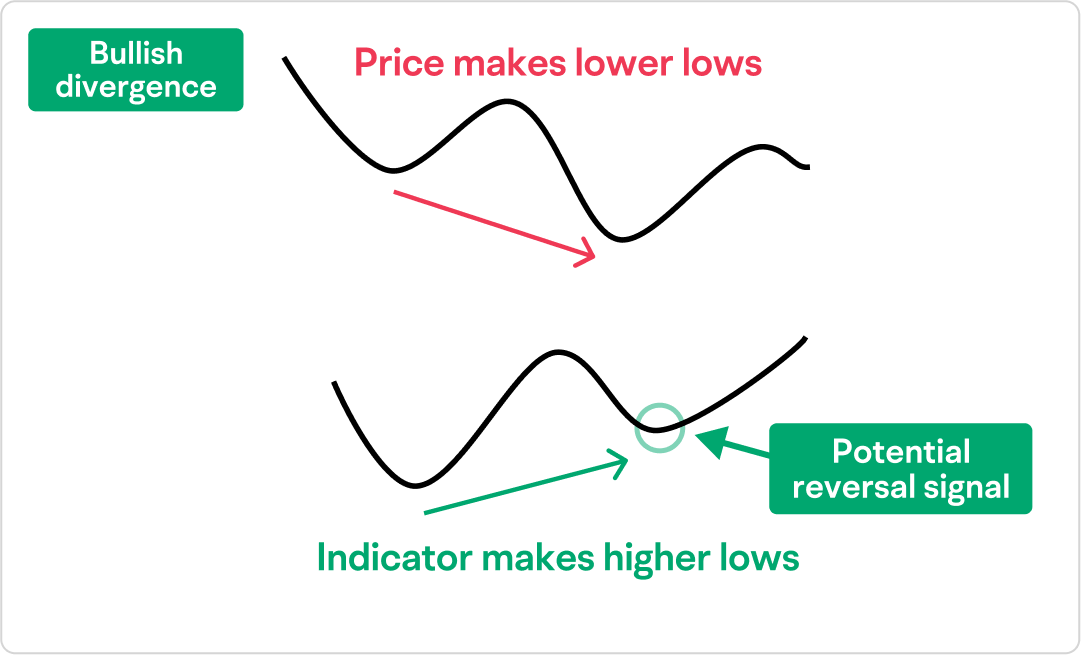
Bullish divergence takes place when the price records a lower low, but the indicator charts a higher low. This pattern indicates that the downward momentum is fading, suggesting that a price uptrend may be on the horizon.
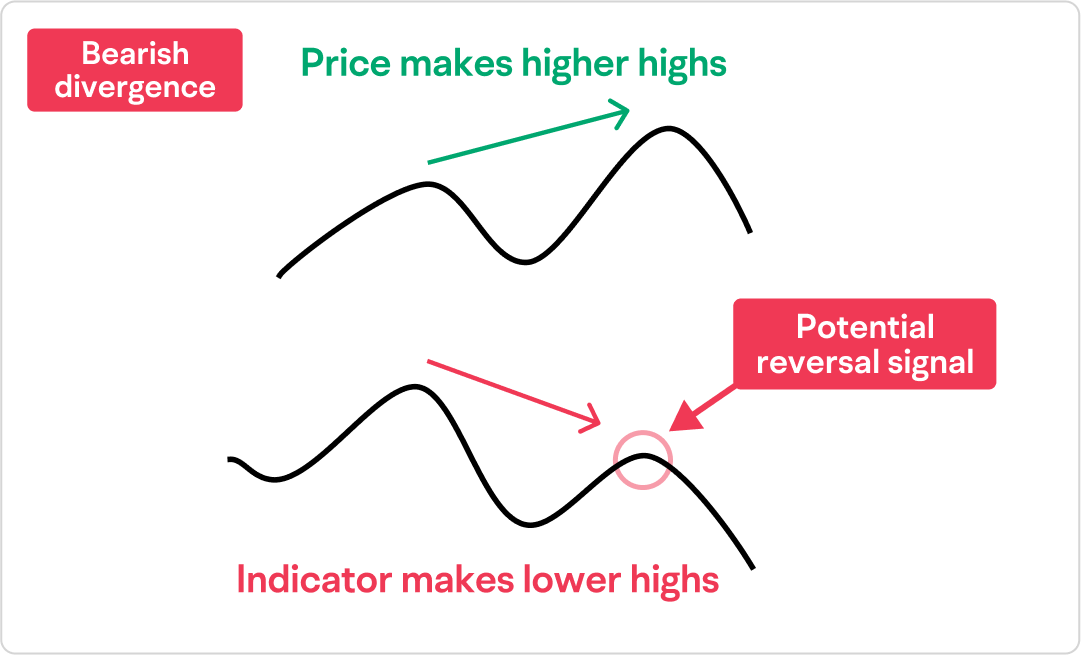
Bearish divergence occurs when the price makes a higher high, but the indicator makes a lower high. This discrepancy suggests that the strength behind the price’s upward trajectory is waning, and it could signal that a downward trend is imminent.
Some traders often refer to bullish and bearish divergences as “regular divergence,” and they consider these patterns as potential indicators of an upcoming trend reversal.
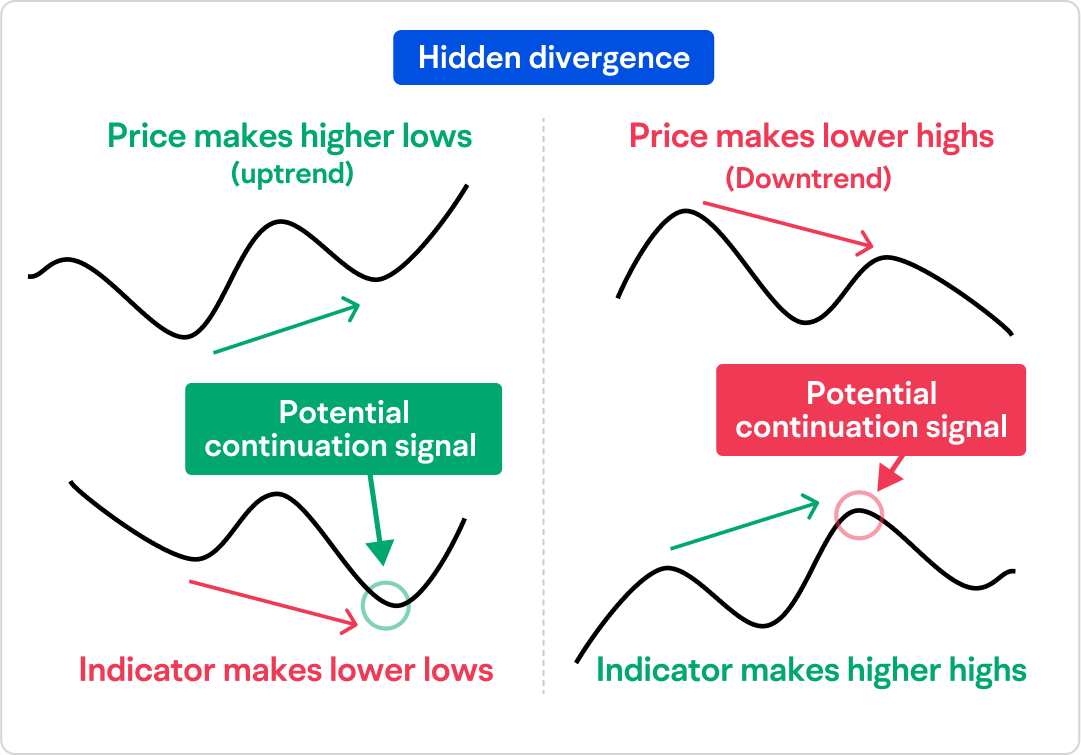
Hidden divergence, in contrast, may signal trend continuation. It occurs when the price forms a higher low during an uptrend, or a lower high during a downtrend, which suggests the indicator does not correspondingly reflect this price movement. This divergence suggests that the current trend still has momentum and is likely to persist.
02 How to spot divergence?
Traders often use various momentum-based oscillators to identify potential divergence signals. Two popular tools for this purpose are the Moving Average Convergence/Divergence (MACD) and the Relative Strength Index (RSI).
It’s important to note that divergence signals are generally more dependable when observed on larger time frames, such as daily or weekly charts. Shorter time frames may often lead to a higher incidence of false signals.
To detect a regular divergence, traders observe the latest highs (peaks) or lows (troughs) in the price and compare them to the corresponding highs and lows on an oscillator. When there is a notable discrepancy between the trends observed in price movements and those indicated by oscillators, a divergence signal may considered to be present.
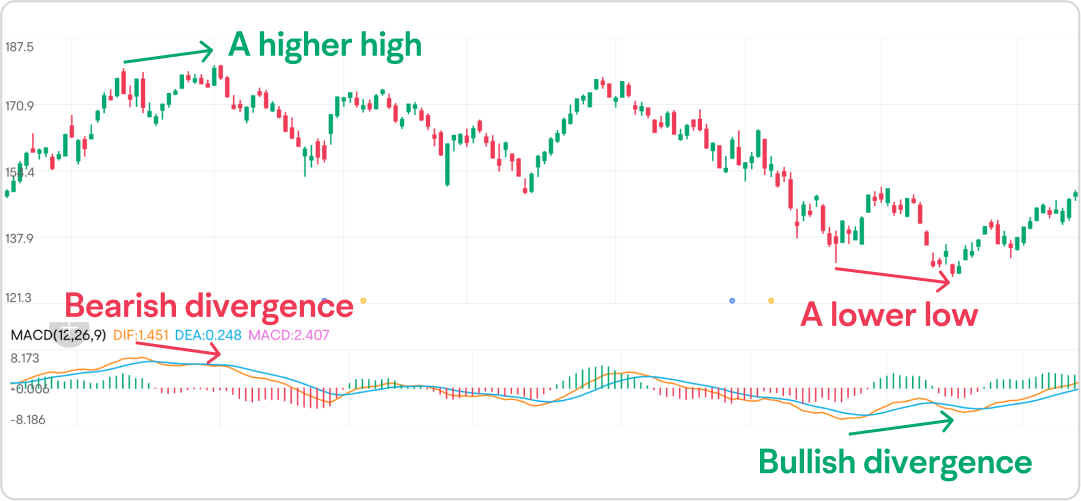
Bullish divergence usually emerges during a sustained downtrend when the price records a new low while some technical indicators begin to trend upward. In contrast, bearish divergence tends to manifest in a prolonged uptrend when the price reaches a new high but some technical indicators start to trend downward.
It’s smart to check several different indicators at once to better spot these divergence signals. Remember, divergence is just a hint — not a green light to make a trade. Before deciding to buy or sell, traders should use other tools and methods to make sure the signal is strong.
Divergence is useful when prices are clearly moving up or down but might not work well when prices are stuck moving sideways.
Hidden divergence isn’t easy to spot — that’s why it’s called “hidden.” But traders can use trend lines to help find it and figure out what might happen next in the market.
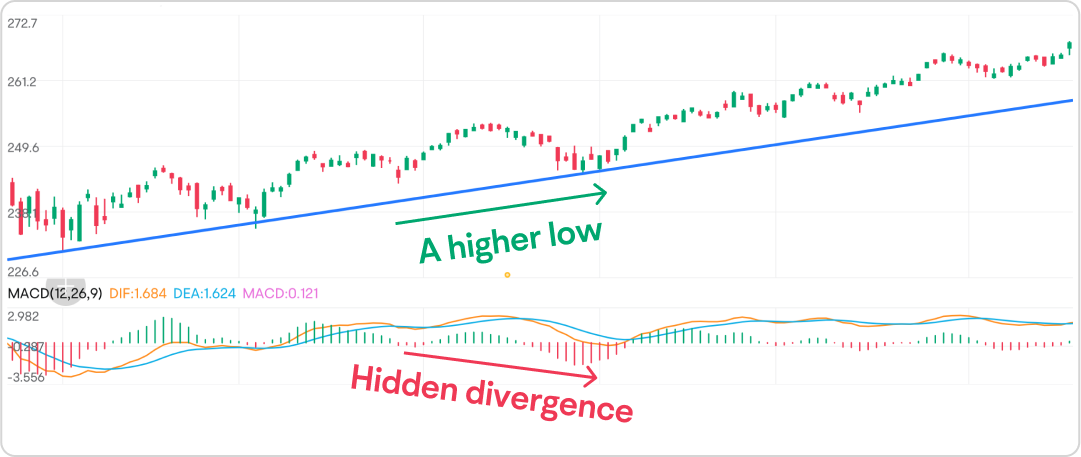
Hidden divergence happens when the market trend takes a brief break. In an uptrend, this means the price drops a bit but doesn’t go lower than the previous low, while the indicator does go lower. In a downtrend, it’s when the price bumps up a little but doesn’t go higher than the previous high, while the indicator goes higher. These signs can show that the market is either too bought or too sold for a moment. This gives traders a chance to join the trend at a good time.
03 Case study
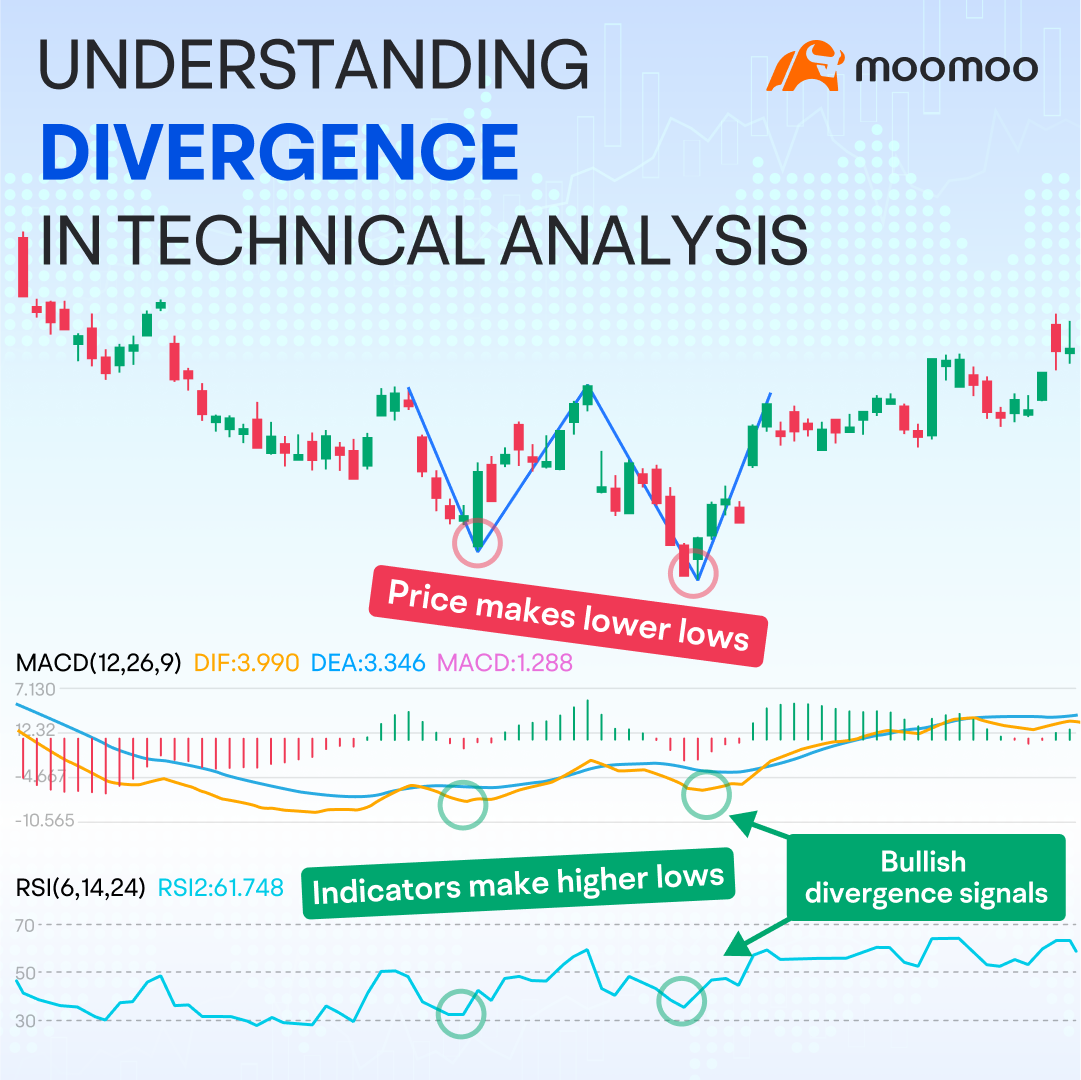
Chart 1 shows prices going down, hitting lower points each time, and it looks like a Double Bottom pattern might be forming, which is a shape that suggests prices could start rising. While the price is going lower, some tools that measure momentum, like the MACD and RSI, are showing higher lows.
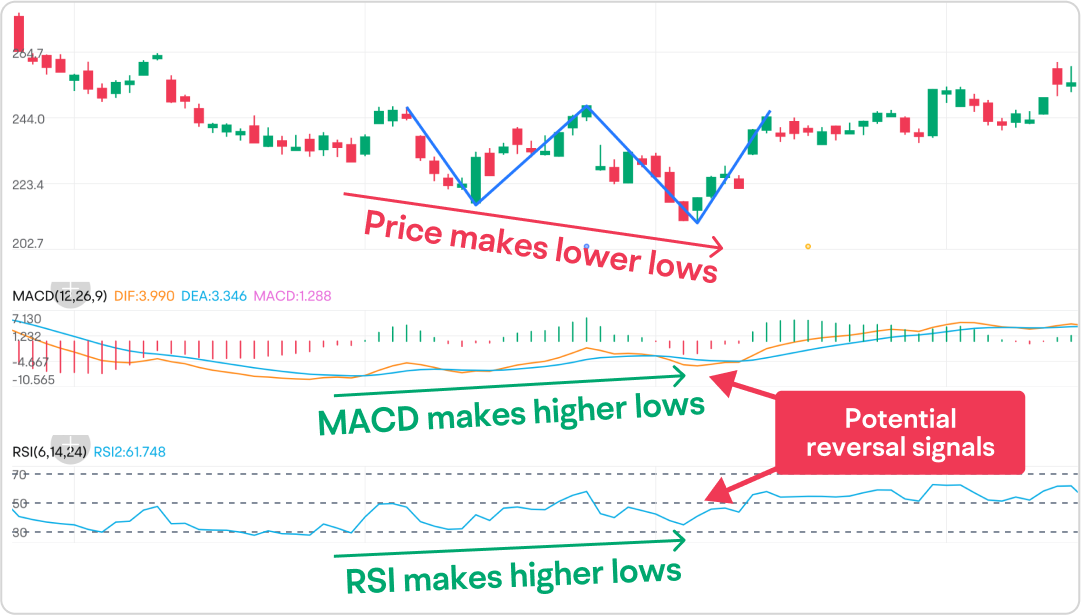
This is a clue of bullish divergence, meaning the downward push of the price is getting weaker, and prices might start to go up.
Chart 2 illustrates a stock’s price that’s been climbing for a while, and there’s a line drawn that connects the low points of the climb, showing the uptrend. Hidden divergence happens here when the price makes a higher low, which is a shallow dip in the uptrend, but the MACD and RSI show lower lows.
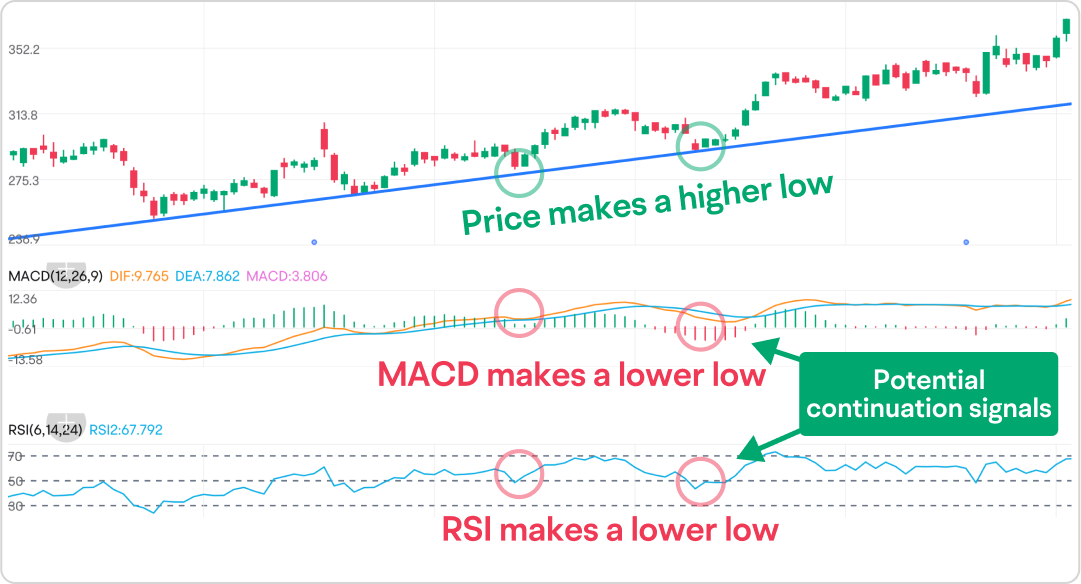
This suggests that even though there’s a bit of opposite momentum, the overall upward trend is still strong. This can be a good chance for traders to get in on the action, especially if the price bounces up from that uptrend line.
This presentation discusses technical analysis, other approaches, including fundamental analysis, may offer very different views. The examples provided are for illustrative purposes only and are not intended to be reflective of the results you can expect to achieve.
All investing involves risk, including the potential loss of principal, and there can be no guarantee that any investing strategy will be successful.
This presentation is for informational and educational use only and is not a recommendation or endorsement of any particular investment or investment strategy. Investment information provided in this content is general in nature, strictly for illustrative purposes, and may not be appropriate for all investors. Read more