How to Use Moomoo's Ticks Feature
Stock prices are constantly changing because investors around the globe are placing orders at different prices in a variety of sizes at any given time. The supply and demand in the market, characterized by sell orders and buy orders, respectively, move stock up and down after the market opens, and at the end of regular trading hours, the last price a stock traded is known as its closing price.
Having said that, identifying orders in "an unusual size" might help us identify the stock trend. But where can we find such information? What order size can be defined as "unusual"? And what are they telling us?
The Ticks feature on moomoo can help you identify "unusual" orders so you can answer these questions.
It captures instant market behavior presented in bids, asks, and trading volume, which is especially useful for traders to identify potentially exploitable trends. Moreover, the historical trades recorded on a trading day can help retail investors.
Let's take a closer look together if you want to know the big players' intent or spot potential trading opportunities.
1. Where to find the Ticks on moomoo?
Go to your Watchlist and tap a stock.
Tap the gear icon on the right to show Ticks. Then you'll see ticks tapes appearing to the right of the candlestick chart.
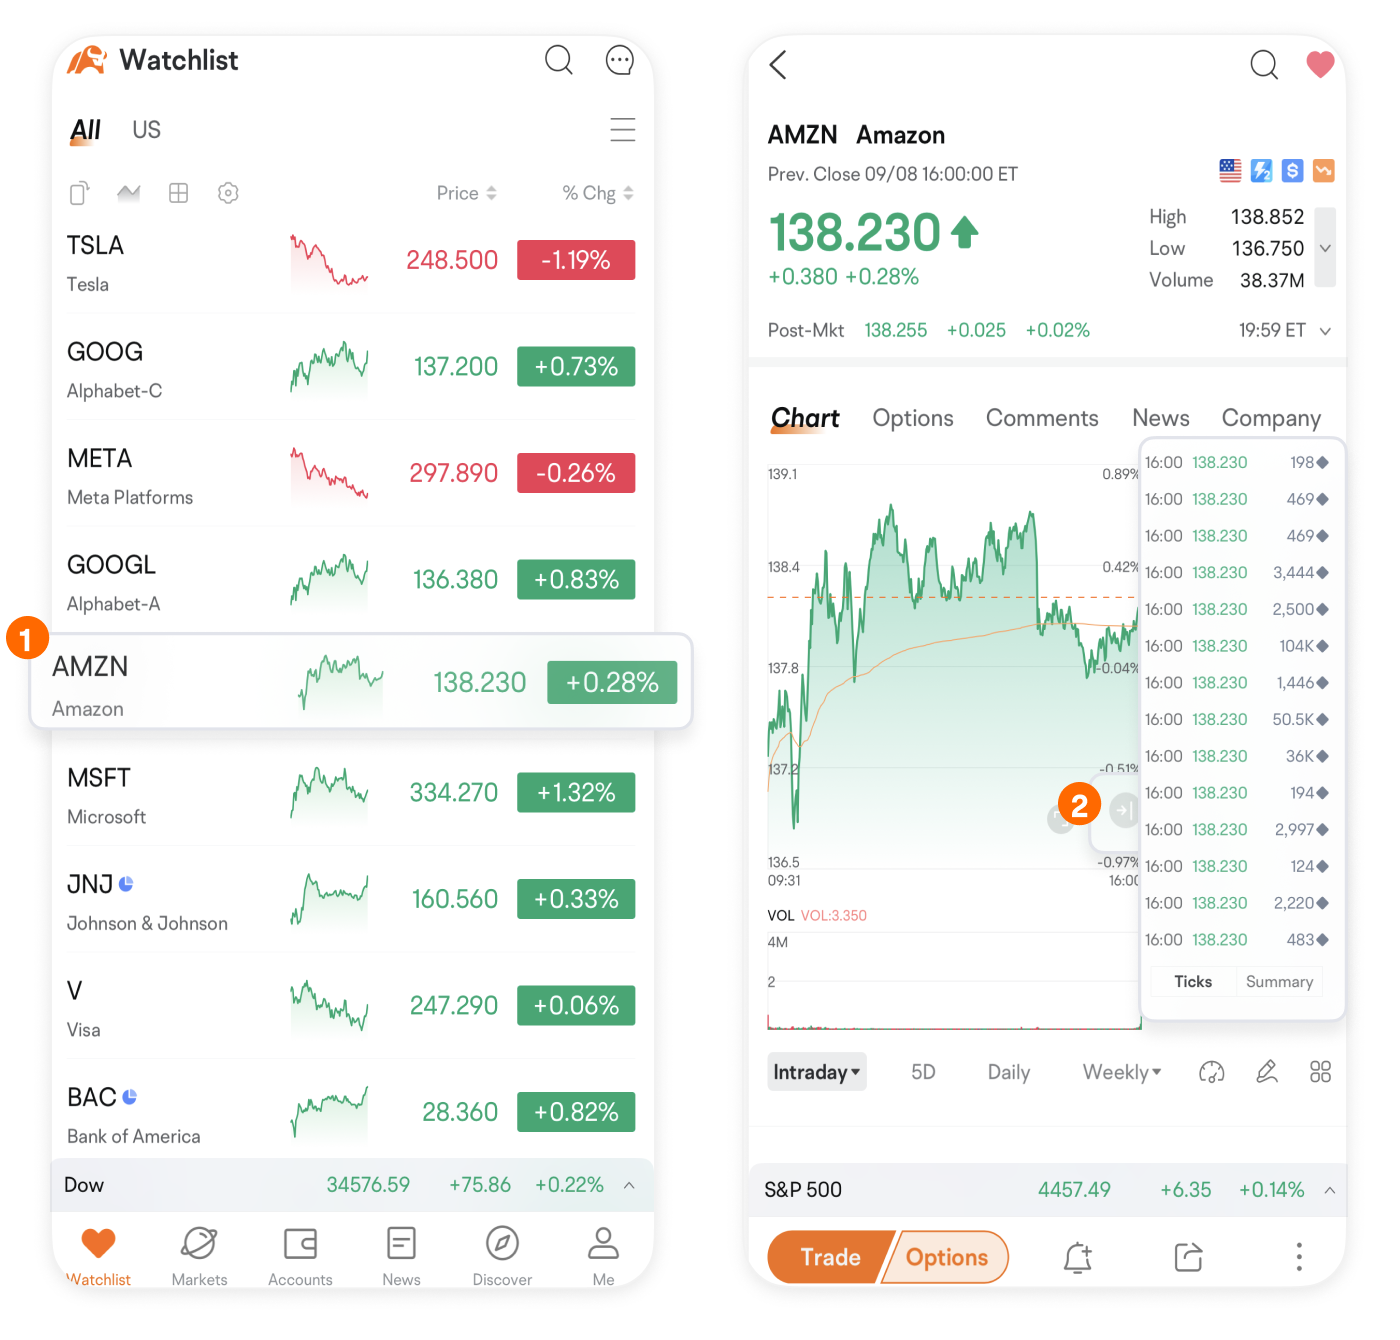
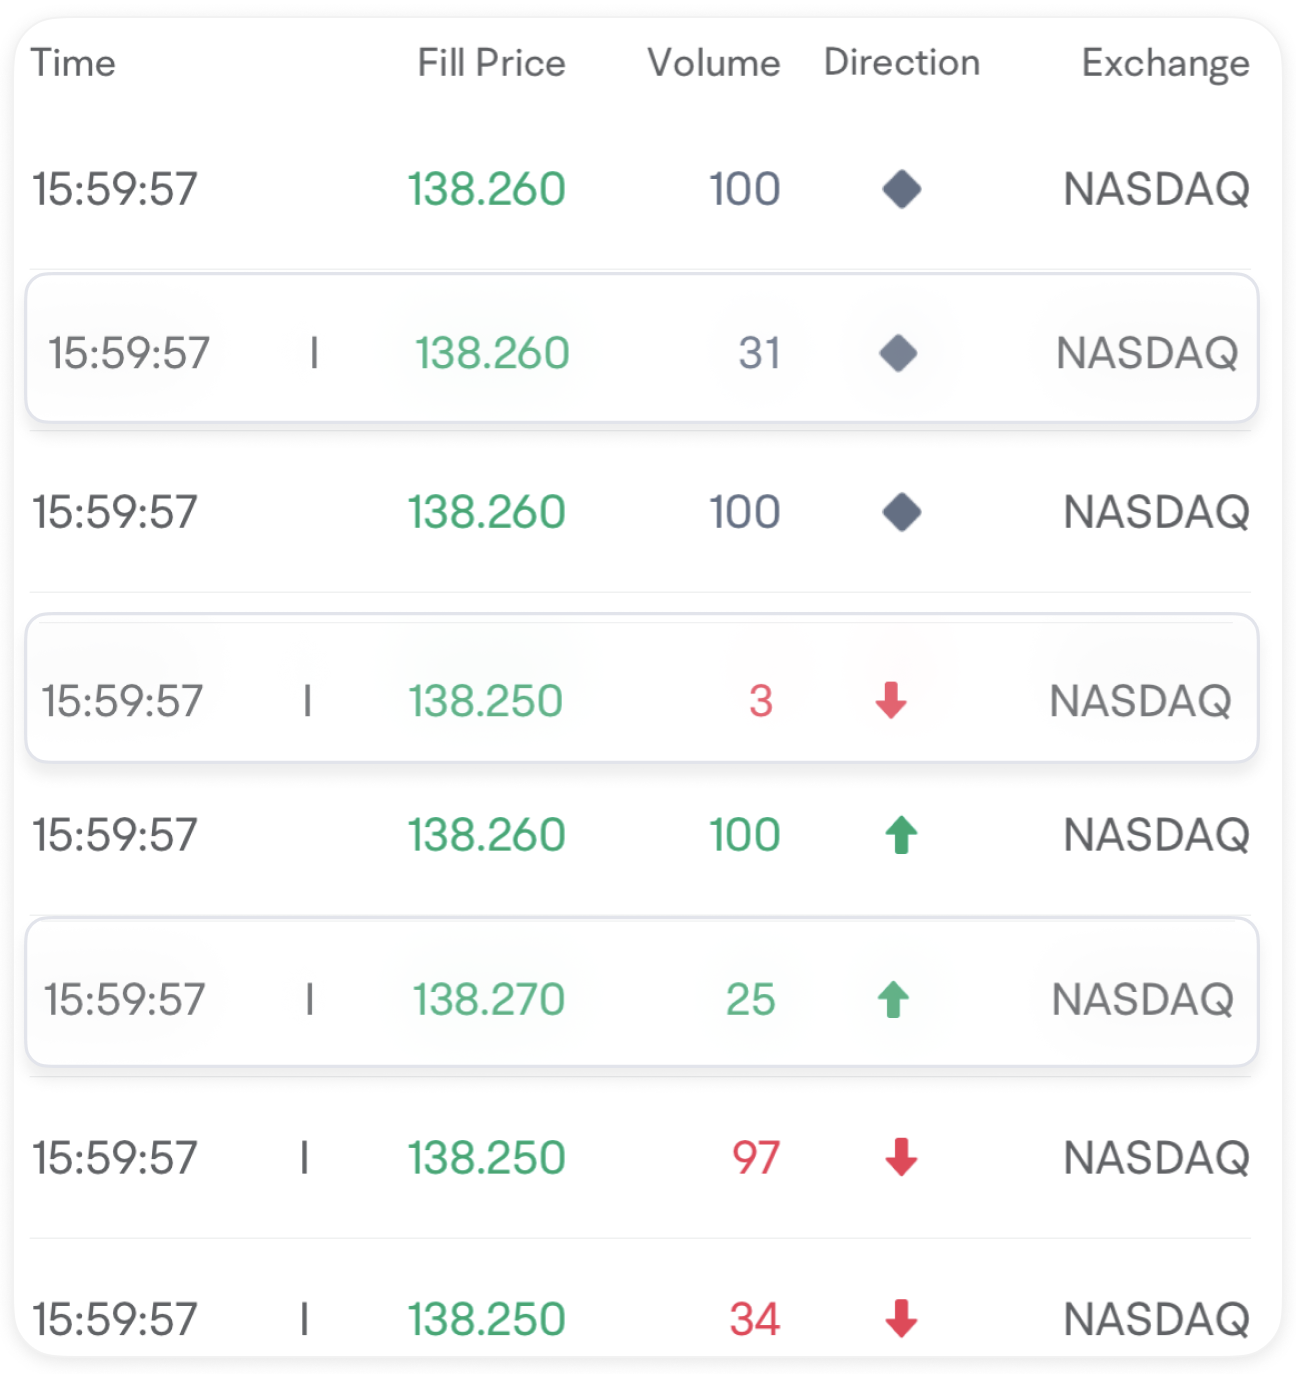
Tap any transaction to enter the Ticks page. Here we can see many transactions and their price, quantity of shares, and trade direction.
Let's take Amazon stock as an example.
In Image 1, we can see the following orders were filled on the Nasdaq:
a. A 25-share order was filled at 15:59:57. The arrow following the volume number on the ticks means the trade was executed at the offer (or ask) price, considered "an active buy."
b. A 31-share order was filled at 15:59:57. The ◆ symbol after the volume number on the ticks means this trade was executed between the bid and ask prices, known as "a neutral trade."
c. A 3-share order was filled at 15:59:57. There is an inverse arrow following the volume number, indicating this trade was executed at the bid price, known as "an active sell."
If you feel the information in the ticks is too fragmented, another moomoo feature may come to help. Tap Summary next to Ticks, or simply swipe right, and you'll find an overview of the stock's transactions on a trading day.
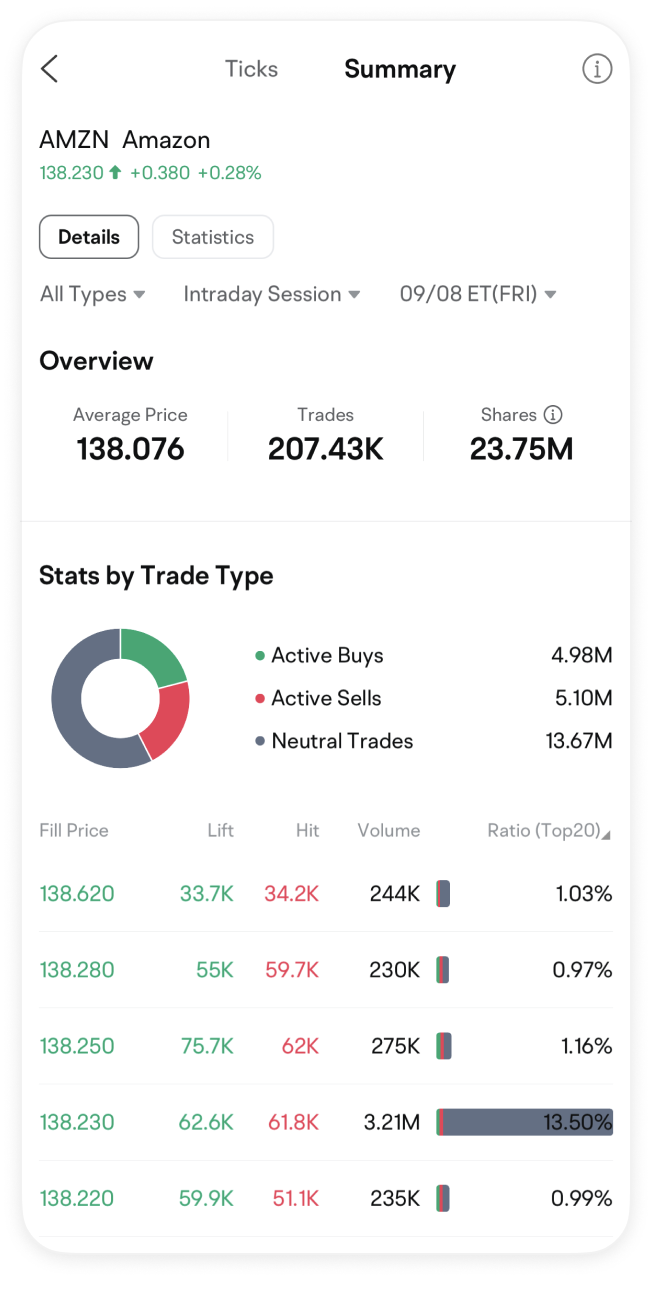
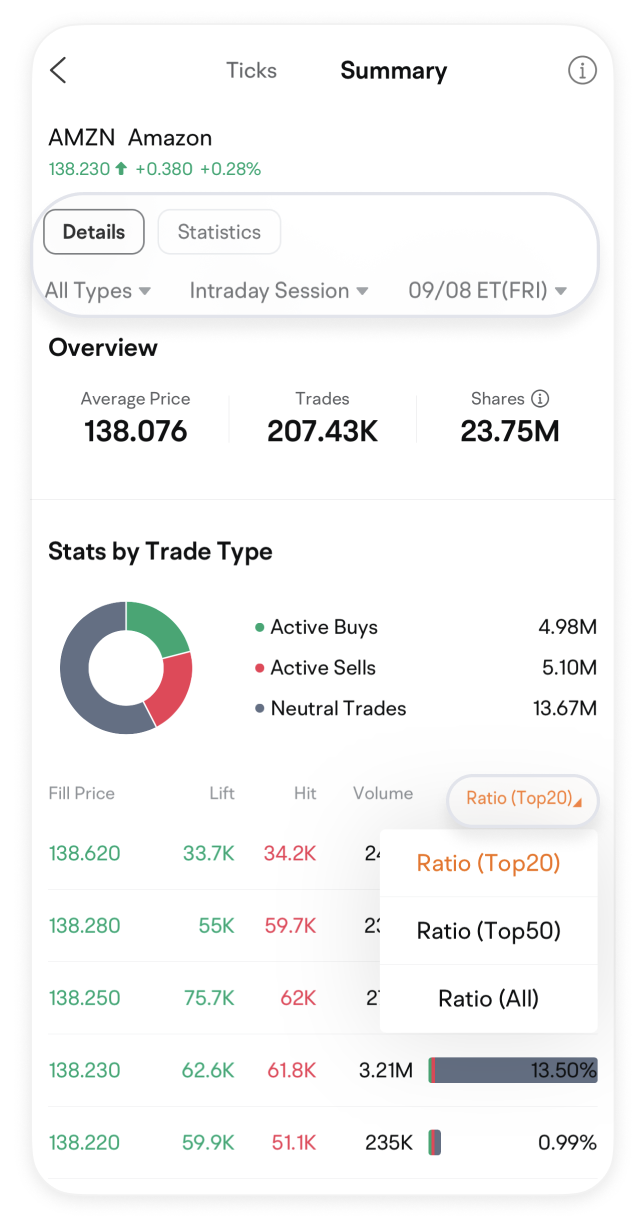
After entering Summary, you can filter order types, Intraday sessions, and trading days, then you'll see a trading overview, stats by trade types, and an integrated transaction chart.
In the transaction chart, you can tap the Ratio icon on the right corner to show the top 20/50/All fill prices.
2. What orders are considered in "unusual sizes"?
When looking at the ticks, we look for information about time, fill price, lots, and order types. In the previous example, we mentioned three types of orders: active buys, neutral trades, and active sells, and now we'll take a closer look.
When traders seek to fill their trades as quickly as possible, they usually have to do so at the expense of getting a better price. Orders placed under this circumstance are named "active orders," which have two types: "active buys" and "active sells." The former suggests capital inflow, whereas the latter indicates capital outflow.
Moreover, the size of an active trade matters. Generally, big-sized orders are from institutional investors, while orders placed by retail investors are much smaller in size.
Orders that are abnormally large or small are considered "unusual." This is what we would want to look for on the ticks.
3. What are these "unusual orders" telling us?
By analyzing price highs, lows, and trends alongside the information on the ticks, we can get some insights into trader behaviors, helping us anticipate potential price movements.
Let's look at some scenarios.
a. When seeing a stock trading at low levels with more active buy-order shares (lift) than sell-order shares (hit), we should consider the possibility of institutional investors accumulating positions at market lows, especially if there are many block buy orders shown on the ticks.
b. When a stock is trading at high levels with more active buy-order shares than sell-order shares, it is possible that big market players are pulling up the stock price. In this case, retail buyers may be attracted to buying into the stock later for fear of missing out, thus taking over the long positions of smart money. This assumption is more likely true if we can find a lineup of block sell orders on the ticks. But if the majority of orders are odd lot trades without visible big-sized sell orders, it suggests that retail traders are piling into the stock while institutional investors are still bullish. In this case, the stock might continue to go up, but the trend might reverse once those big market players decide to distribute their positions.
c. When a rising stock has more active sell-order shares than buy-order shares, and we can identify most buy orders are block trades while most sell orders are small in size, it might indicate institutional investors are taking over positions from smaller retail investors. This might be a good sign for stockholders because big market players with deep pockets might pull up the stock price later.
4. Summary
Now let's recap what we've learned about the Ticks feature.
First, this feature visualizes real-time and historical price actions, making it easier for traders to identify key information. Traders might modify their strategies after gaining insights from institutional investors' moves.
Second, this feature is especially useful for retail traders.
Third, remember it is not 100% accurate to distinguish retail investors from institutional investors based on the order size. That's because block orders can be broken down into smaller pieces when traded on some stock exchanges.
Fourth, traders can use this feature alongside other functions on moomoo to make more informed trading decisions. For example, Order Capital Size to look at the direction of different-sized orders more specifically. Also, after getting an idea about where the stock might move next from the Ticks, we can go to Real-Time Quotes to find at which price levels most orders are placed, which can be considered a potential support or resistance.
This presentation is for informational and educational use only and is not a recommendation or endorsement of any particular investment or investment strategy. Investment information provided in this content is general in nature, strictly for illustrative purposes, and may not be appropriate for all investors. Read more