How to discover potential entry points? Support and resistance help!
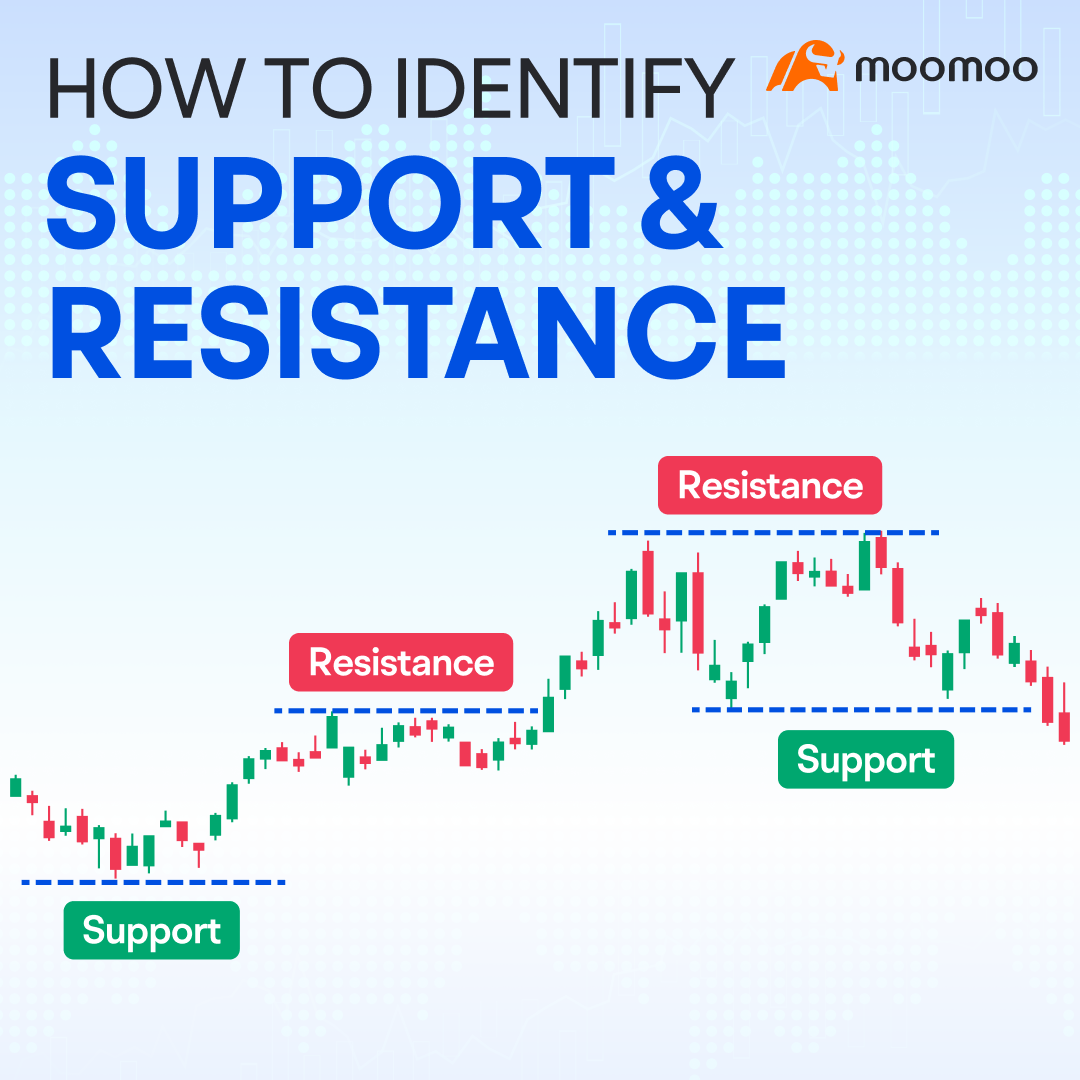
Are you tired of struggling to potentially time your market entries, and constantly worrying about potential risks?
Look no further than the powerful technical tools of support and resistance.
Whether you're a seasoned trader or new to the game, understanding how to identify and leverage these key market indicators can be the difference between success and failure.
In this guide, we'll show you how to harness the power of support and resistance to enhance your trading strategy, reduce risk, and uncover optimal entry points with confidence.
01 What are support and resistance?
We know that the price of an asset moves in a series of peaks and troughs, which can determine the trend of the market.
In technical analysis, those peaks and troughs are commonly referred to as support and resistance.
Support is the level or area where demand is strong enough to potentially stop the price from falling further. When the price drops and approaches a support level, buying interest might increase and selling pressure tends to subside.
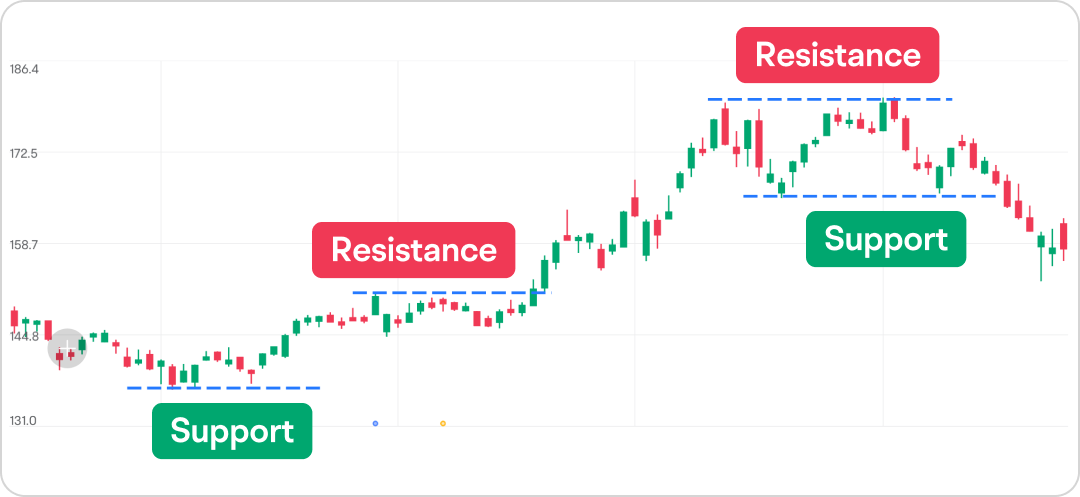
Resistance is the opposite of support and represents the level or area where supply is strong enough to potentially stop the price from rising further. When the price rises and approaches a resistance level, buying interest might subside and selling pressure generally increases.
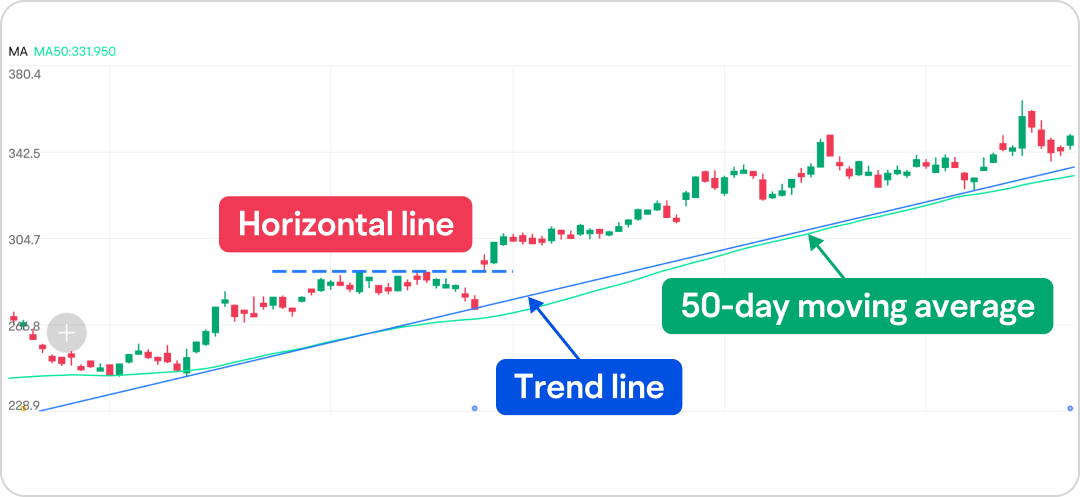
There are three main types of support and resistance: horizontal, trend line, and dynamic (e.g. a moving average).
02 The psychology of support and resistance
The market participants can be divided into three categories: the longs, the shorts, and the uncommitted.
The longs are those who have already purchased securities, the shorts are those who have already committed themselves to the sell side, and the uncommitted are those who have been out of the market or remain undecided about which side to enter.
Suppose the price of a security starts to move higher from a support level where prices have been fluctuating or accumulating for some time.
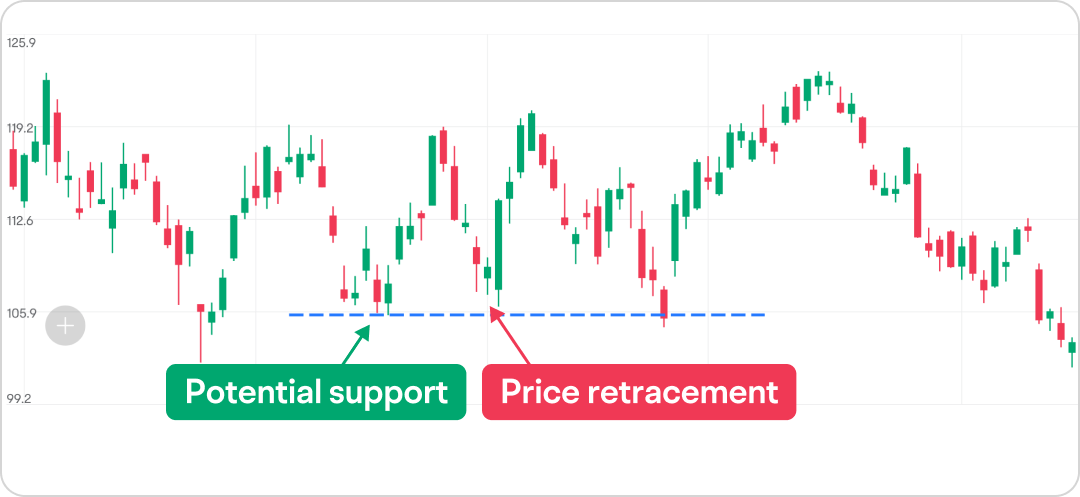
The longs might enjoy the rising market but regret not having bought more. If the market retraces near that support, they might consider buying more securities.
The shorts might recognize that they are on the wrong side of the market. Some of them may be looking forward to a potential price retracement near that support where they went short, so they can get out of the market.
The uncommitted might realize that the price has an upside momentum. Some of them would like to go long when there is a potential buy signal in the market.
With each category of investors choosing to potentially “buy the dip”, the price could be expected to get some boost around that support.
Once a support or resistance is broken, its role can be reversed.
In the previous case, imagine what would happen if the price declines instead of moving higher.
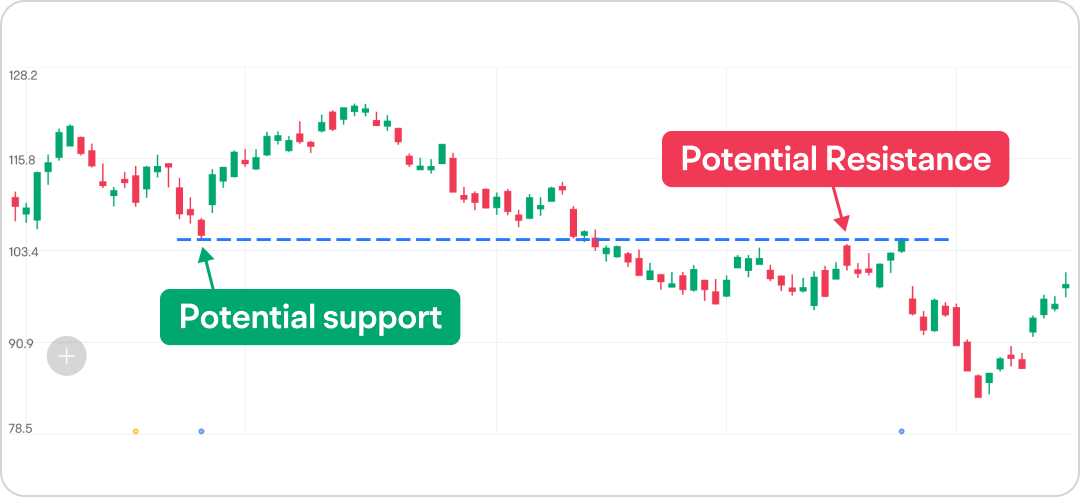
The combined reaction of the longs, shorts, and uncommitted can be reversed. For example, the longs might recognize that they are on the wrong side of the market as the price continues falling. Some of the longs might choose to close out positions if the price trades back up to the previous support, potentially making it a new resistance.
03 What to look for?
Traders can keep an eye on the following factors to help identify how significant a potential support or resistance can be.
Volume
Trading volume is considered an important aspect of measuring the significance of support and resistance.
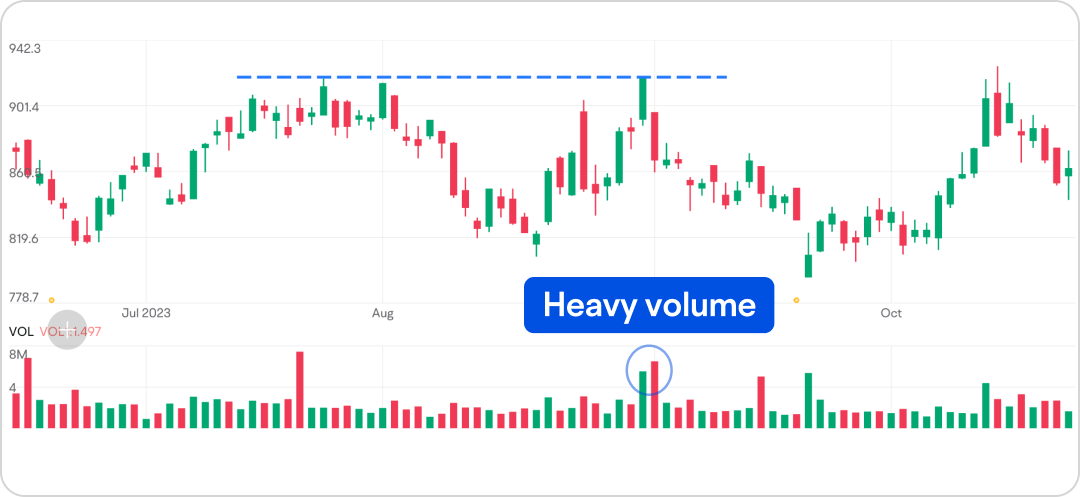
If a potential support or resistance is formed on heavy volume, meaning more trading activity has taken place around that level, it may be considered more important by some traders.
First-time retracement
The price tends to respect the potential support or resistance the first time when the market retraces to that level.
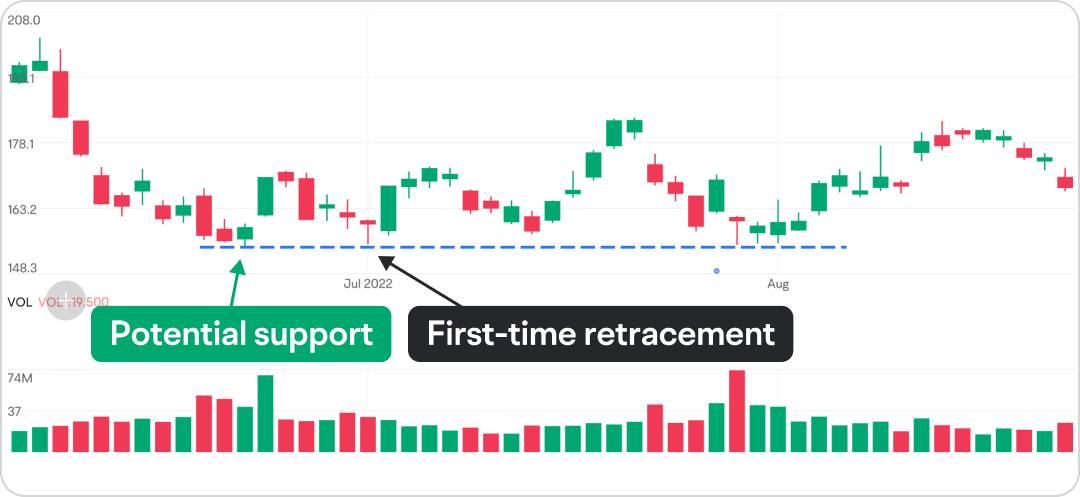
That’s because the reactions of market participants tend to be more alike when the price firstly tests a potential support or resistance.
Candlestick patterns
Some candlestick patterns could highlight the significance of price action.
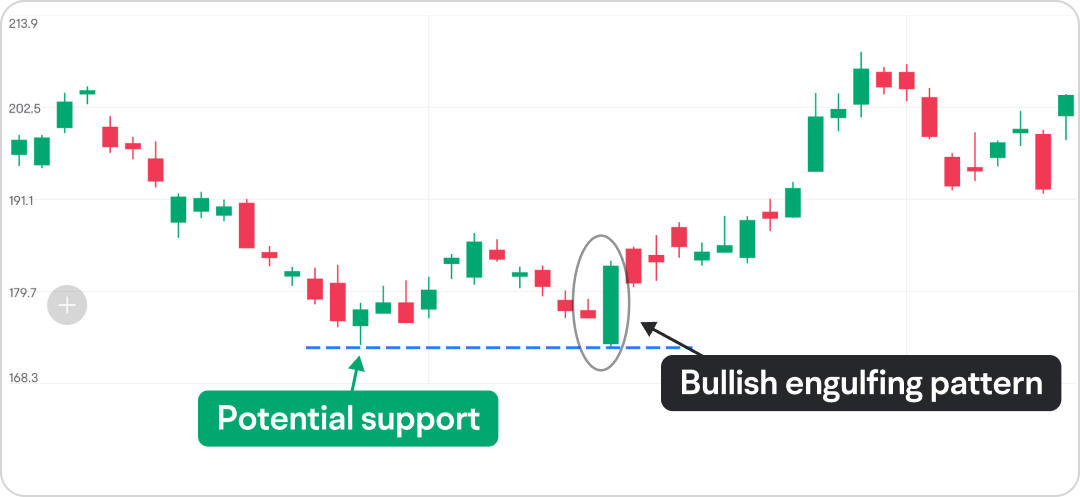
For example, a potential support forms on a bullish candlestick pattern, like the bullish engulfing pattern. The potential support could be considered more important. Similarly, if a potential resistance forms on a bearish candlestick pattern, like the shooting star, the potential resistance could be stronger.
In addition, traders can also pay attention to some classic chart patterns and technical indicators to potentially get more insight.
Time intervals
As previously discussed, a potential support or resistance level materializes when the three categories of market participants - the longs, shorts, and uncommitted traders – reach a consensus.
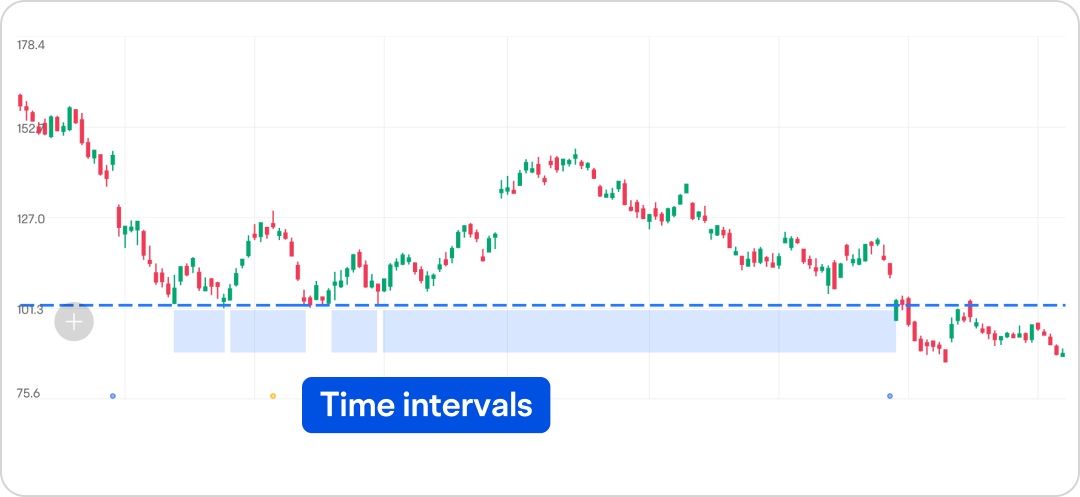
Over time, market participants’ psychology outlook may change, and their opinions can become divided. This has led some traders to argue that a more recently formed support or resistance level is likely to be more significant than one that has been established for a longer period.
This presentation discusses technical analysis, other approaches, including fundamental analysis, may offer very different views. The examples provided are for illustrative purposes only and are not intended to be reflective of the results you can expect to achieve.
All investing involves risk, including the potential loss of principal, and there can be no guarantee that any investing strategy will be successful.
This presentation is for informational and educational use only and is not a recommendation or endorsement of any particular investment or investment strategy. Investment information provided in this content is general in nature, strictly for illustrative purposes, and may not be appropriate for all investors. Read more

