Growth Stock Picking Strategy: CANSLIM

Growth stocks perform better in bull markets.
Since October 2022, the S&P 500 index has experienced a rebound of over 20% from its 52-week low, which is typically considered a technical bull market.
In bull markets, growth stocks tend to outperform value stocks, offering higher returns, as high-growth companies usually attract more attention and demand.
With so many growth stocks available, identifying those with explosive potential can be challenging.
This article introduces the CANSLIM model, a proven method for selecting high-potential growth stocks.
What is CANSLIM?
CANSLIM is a stock-picking model created by renowned investor William J. O'Neil. It combines fundamental, technical, and market analysis to identify promising growth stocks.
CANSLIM Investing System helped O'Neil achieve remarkable investing success and become the youngest person at the time to buy a seat on the New York Stock Exchange.
He later authored the bestselling investment book "How to Make Money in Stocks," which remains popular with over a million copies sold.
CANSLIM aims to seek out growth stocks with solid fundamentals and strong price momentum. It is well-suited for swing traders and trend traders.
The 7 Criteria of CANSLIM
CANSLIM model comprises seven important stock selection criteria, with each letter representing a key indicator or factor. C, A, N, and I are related to buying on the company's fundamentals, while S, L, and M measure technical and market sentiment.
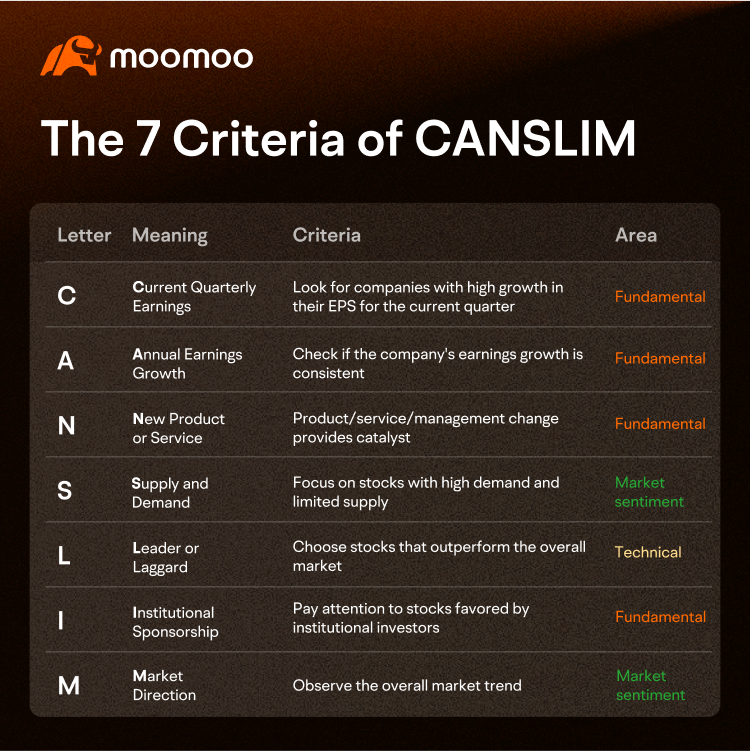
C - Current Quarterly Earnings: Look for companies with high growth in their earnings per share (EPS) to buy in the current quarter. Aim for at least a 25% YoY increase, with a preference for accelerating growth over multiple quarters.
A - Annual Earnings Growth: Check if the company's earnings growth is consistent. Look for a minimum 25% compound annual growth rate in EPS over the past three years.
N - New Product or Service: Look for companies with new products, new management teams, or stocks reaching new highs. For example, companies that introduce new products that drive performance or experience changes in the industry landscape, leading to increased market share.
S - Supply and Demand of Shares: Focus on stocks with high demand and limited supply. Look for increasing trading volume as the stock price rises and consider companies with a small float and ongoing share buybacks.
L - Leader or Laggard: Choose stocks that outperform the overall market. The relative strength of a stock can be measured using the technical indicator RPS (Relative Price Strength). Generally, an RPS value equal to or greater than 80 indicates that the stock has outperformed 80% of other stocks during a specific period of time.
I - Institutional Sponsorship: Pay attention to stocks favored by institutional investors. If you notice that the number of institutions holding the stock has consistently increased over the past few quarters, it could be a positive signal.
M - Market Direction: Observe the overall market trend. Even if a stock meets the other criteria above, it may still decline in a weak market. Consider buying stocks when the overall market is in an upward trend.
How can individual investors use it?
As an individual investor, you can use stock screeners based on the CANSLIM model for stock selection. Here's a simplified step-by-step approach:

First, quantify the criteria.
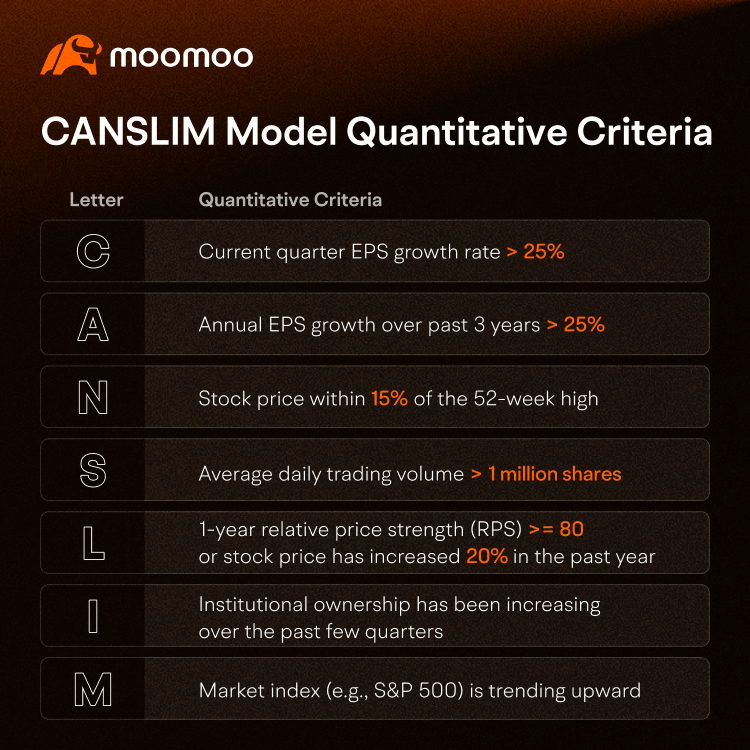
Within the CANSLIM stock selection model, some criteria are quantifiable while others are not. To measure the quantifiable ones, there are several indicators and methods available. These indicators are simplified and for reference only; you can adjust them based on your understanding and current market conditions.
● C: Current quarter EPS growth rate> 25%
● A: Annual EPS growth rate over the past three years> 25%
● N: Stock price within 15% of its 52-week high. Although new products and services can not be quantified, we can quantify the stock price nearing or pulling back from new highs.
● S: Average daily trading volume of at least 1,000,000 shares. In terms of supply and demand, consider float (shares available for trading) and average daily trading volume. Lower float and higher volume are generally preferred. While there are no specific quantified indicators provided, setting a minimum average daily trading volume of 1 million shares can help manage liquidity risk.
● L: One-year relative price strength (RPS)>= 80 or stock price increase of 20% over the past year. An RPS above 80 indicates that the stock has outperformed 80% of others. If the RPS indicator is unavailable, consider how much the stock price needs to increase in one year to surpass the performance of 80% of the market stocks. For example, a 20% increase can be derived based on current market conditions.
● I: Increasing institutional investor participation over several quarters. These institutions should also have a good performance record over the past three years. Since O'Neil did not provide specific quantitative criteria for this, there is no need to include this indicator in the stock screening tool.
● M: Overall market index (e.g., S&P 500) showing an upward trend. Likewise, since O'Neil did not provide specific, quantifiable criteria, there is no need to include this indicator in the stock screening tool.
Next, use a stock screening tool to identify potential stocks.
Once you have quantified the criteria into specific indicators, you can use a stock screening tool to identify stocks that meet the criteria. One such tool is the moomoo app, which provides a powerful stock selection feature. Let's take a closer look.
Opening the app, you can tap on Markets > Explore > Stock Screener. Here, you can create your own customized stock selection strategy. Simply tap on "New Strategy" and choose the indicators shown. If you can't find a specific indicator in the stock screener, you can customize it.
Once the criteria are set, the tool will generate a list of stocks that meet the chosen conditions. You can then review the selection results and save your preferred stock selection strategy for future analysis.
Are you getting interested? Go to moomoo and explore this feature now!

Also, it's important to analyze both the fundamental and technical of the selected stocks.
Fundamental analysis involves considering non-quantifiable factors like new products and services, and assessing if the company has potential breakthroughs such as Apple's iPhone or NVIDIA's AI innovations. Additionally, check for growth in institutional ownership.
However, sound fundamentals may not necessarily make growth stocks good investments. Pay attention to technical factors like price trends, trading volume, and technical indicators.
For example, O'Neil's book suggests using chart patterns as additional tools for analysis, such as cup and handle formations. The price breaking out of a pattern with a notable increase in trading volume could be considered a positive signal.
Finally, it's important to manage risks effectively.
CANSLIM is a helpful guideline, but it doesn't guarantee that the stocks selected using this method will always go up in value.
Investors need to manage risks and diversify their investment portfolios. Before buying stocks, it's important to create a clear trading plan that includes setting specific points to exit if the stock price falls (stop-loss) or reaches the desired profit level (take-profit). Additionally, controlling the size of the position is crucial.
By doing so, there is a better chance of achieving profits while minimizing potential losses.
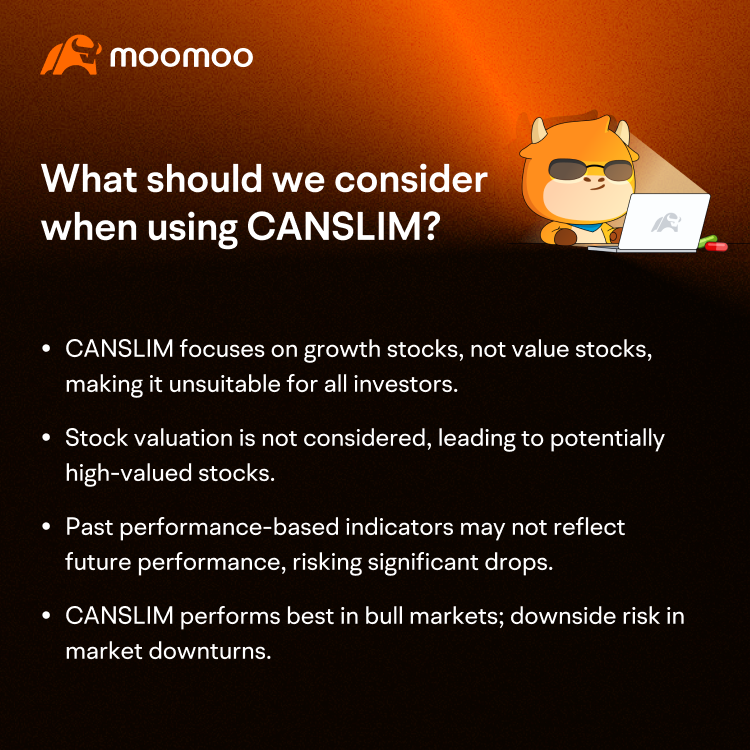
What should we consider when using CANSLIM?
While CANSLIM combines fundamental, technical, and market sentiment for stock selection, it has some limitations. You should keep the following factors in mind:
● CANSLIM focuses on growth stocks, not value stocks, so it may not be suitable for all investors.
● CANSLIM doesn't consider stock valuation, so the selected stocks may be overvalued.
● CANSLIM's fundamental indicators are based on past performance, and if future performance falls short of expectations, stock prices may drop significantly.
● CANSLIM works best in bull markets, with many selected stocks at their 52-week highs. If the market reverses, these stocks may be hit hard.
While CANSLIM isn't perfect, its design principles and approach are worth learning. It expands investing perspectives and allows investors to develop and validate their own strategies within the CANSLIM framework.
This presentation is for informational and educational use only and is not a recommendation or endorsement of any particular investment or investment strategy. Investment information provided in this content is general in nature, strictly for illustrative purposes, and may not be appropriate for all investors. Read more