
Moomoo Insights
Jul 16 15:38
TSMC Earnings: AI Demand Is Stronger Than the Chip Selloff Suggests
Moomoo Insights
Sep 30 05:04
Live Take | Anthropic’s $518B Compute Bet: Who Wins From the AI Buildout?
If you are new to indicator analysis or find it too complicated to comprehend by yourself, check out Technical Indicator Sentiment feature on moomoo, where we help make it easier to digest.
Follow the steps to find out where it is.
Tap a stock and enter its Detailed Quotes.
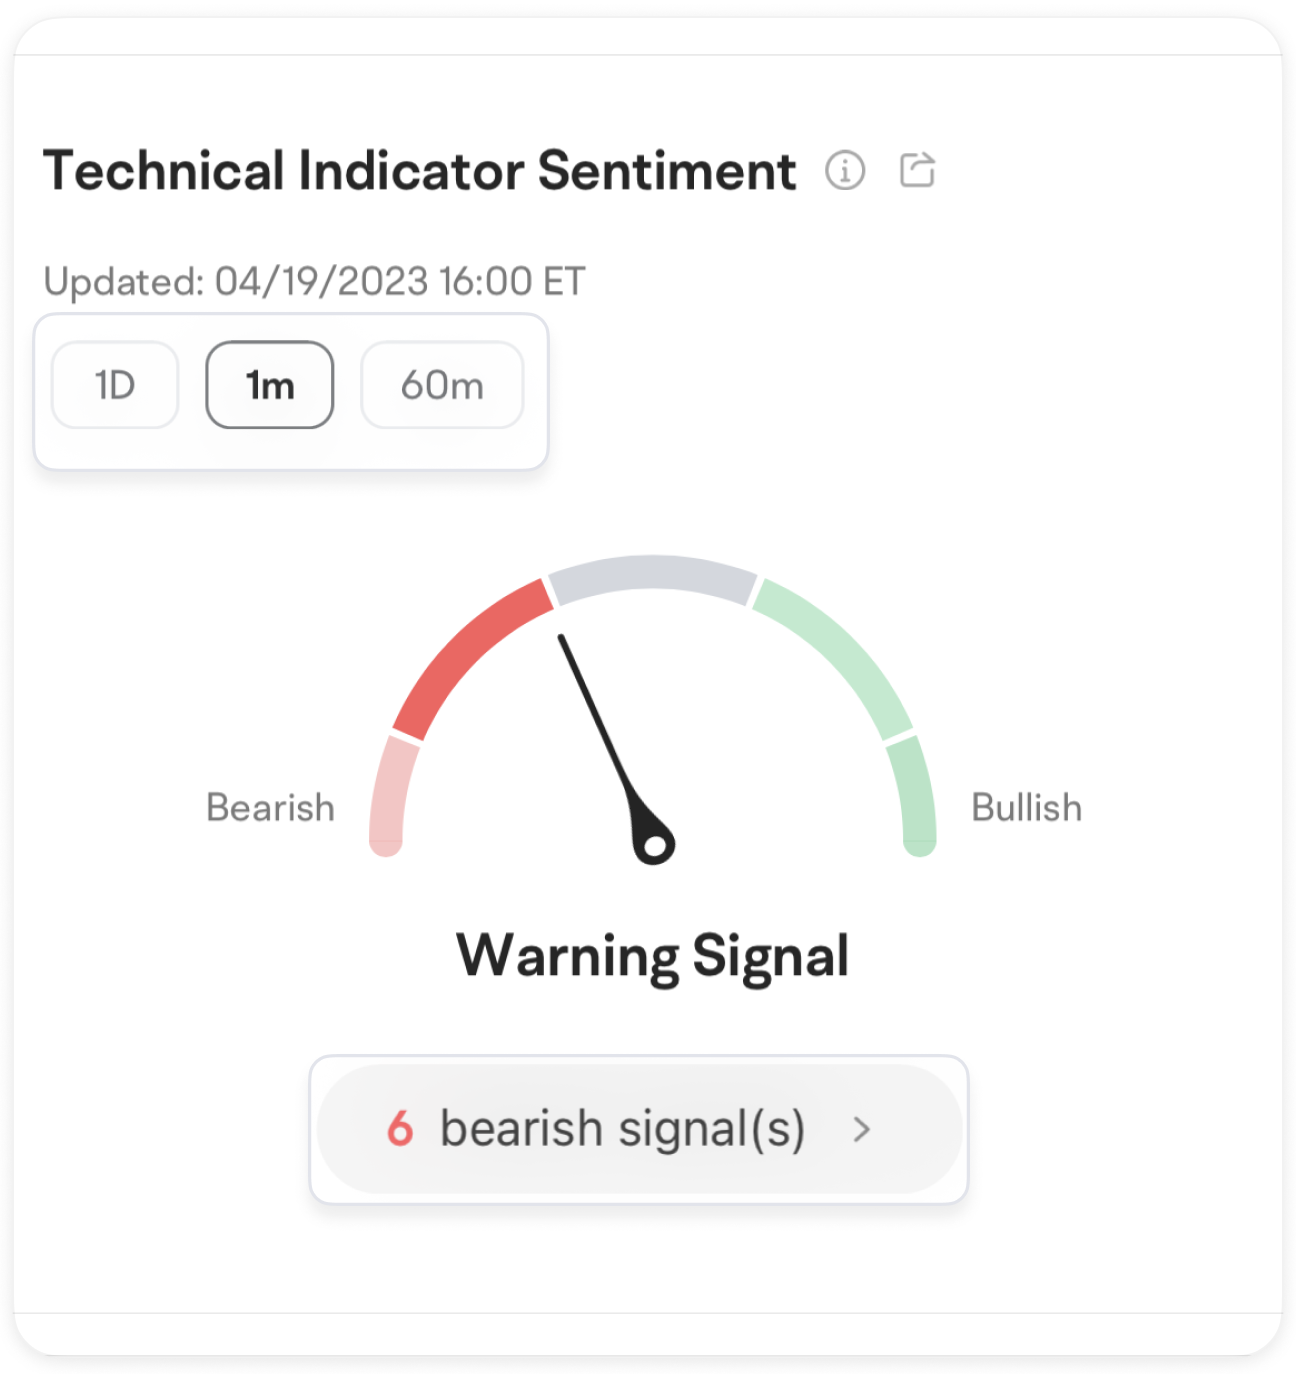
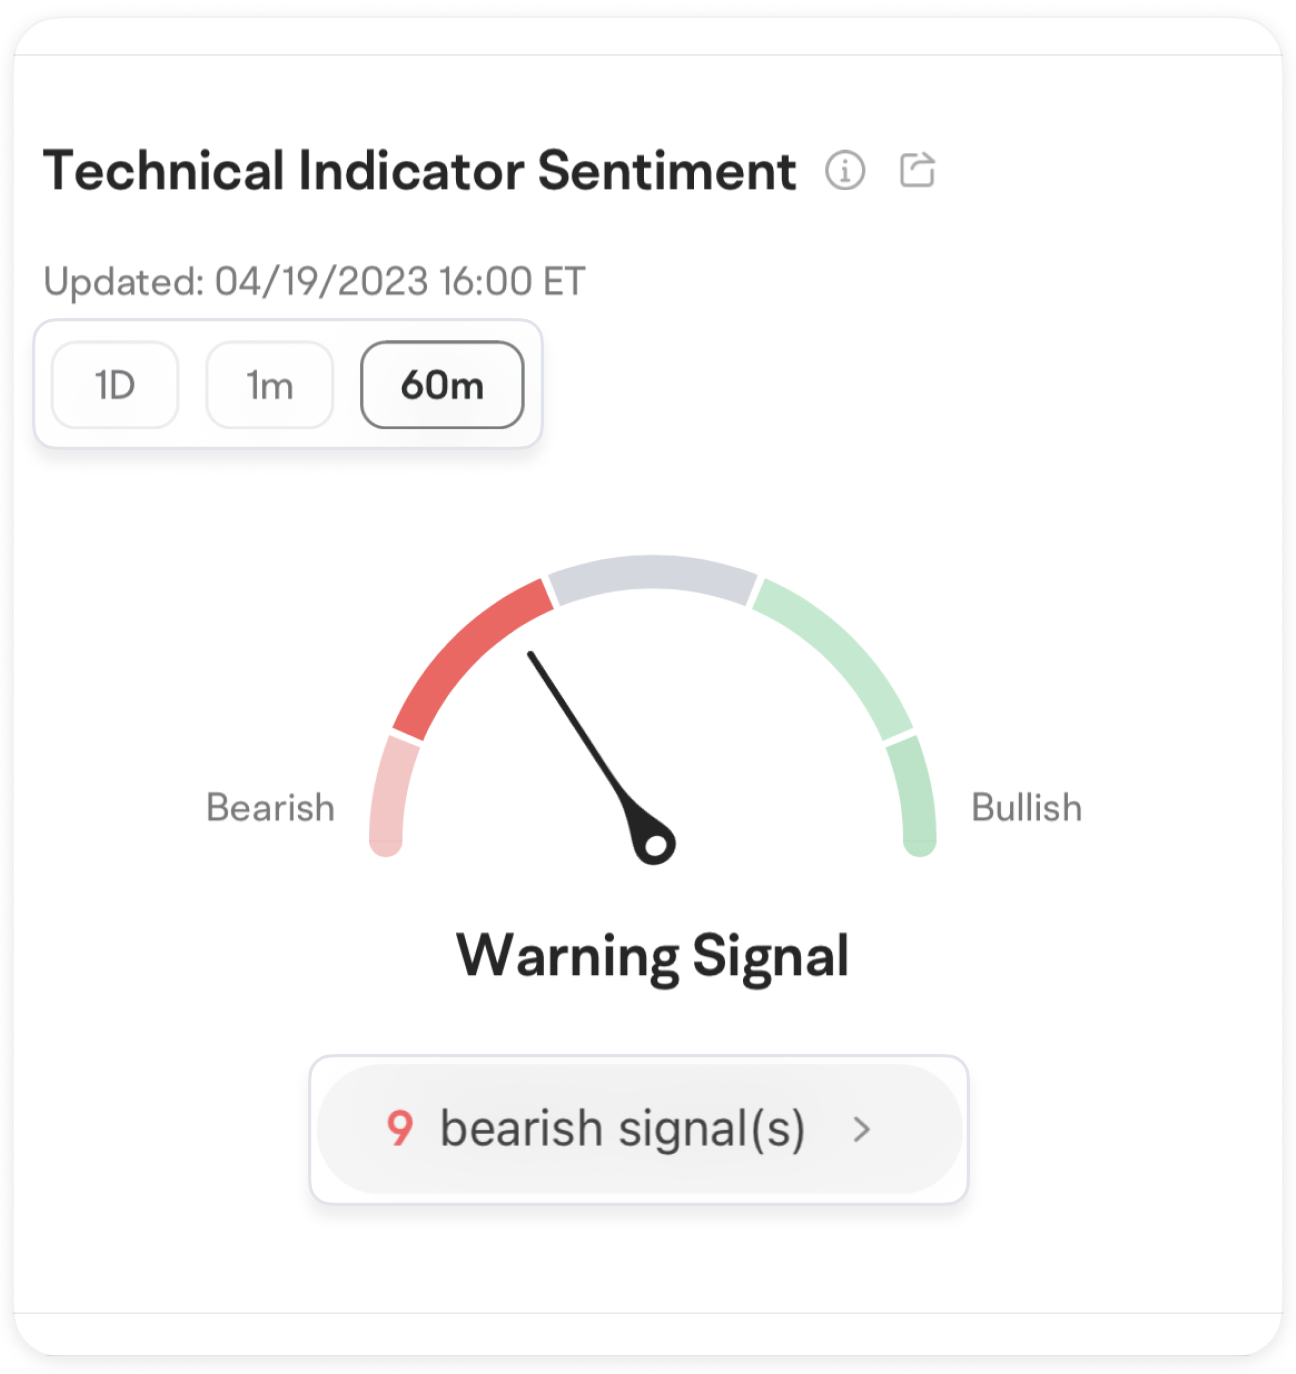
Scroll down to see a dashboard which integrates the signals provided by 15 common oversold and overbought indicators and technical patterns.
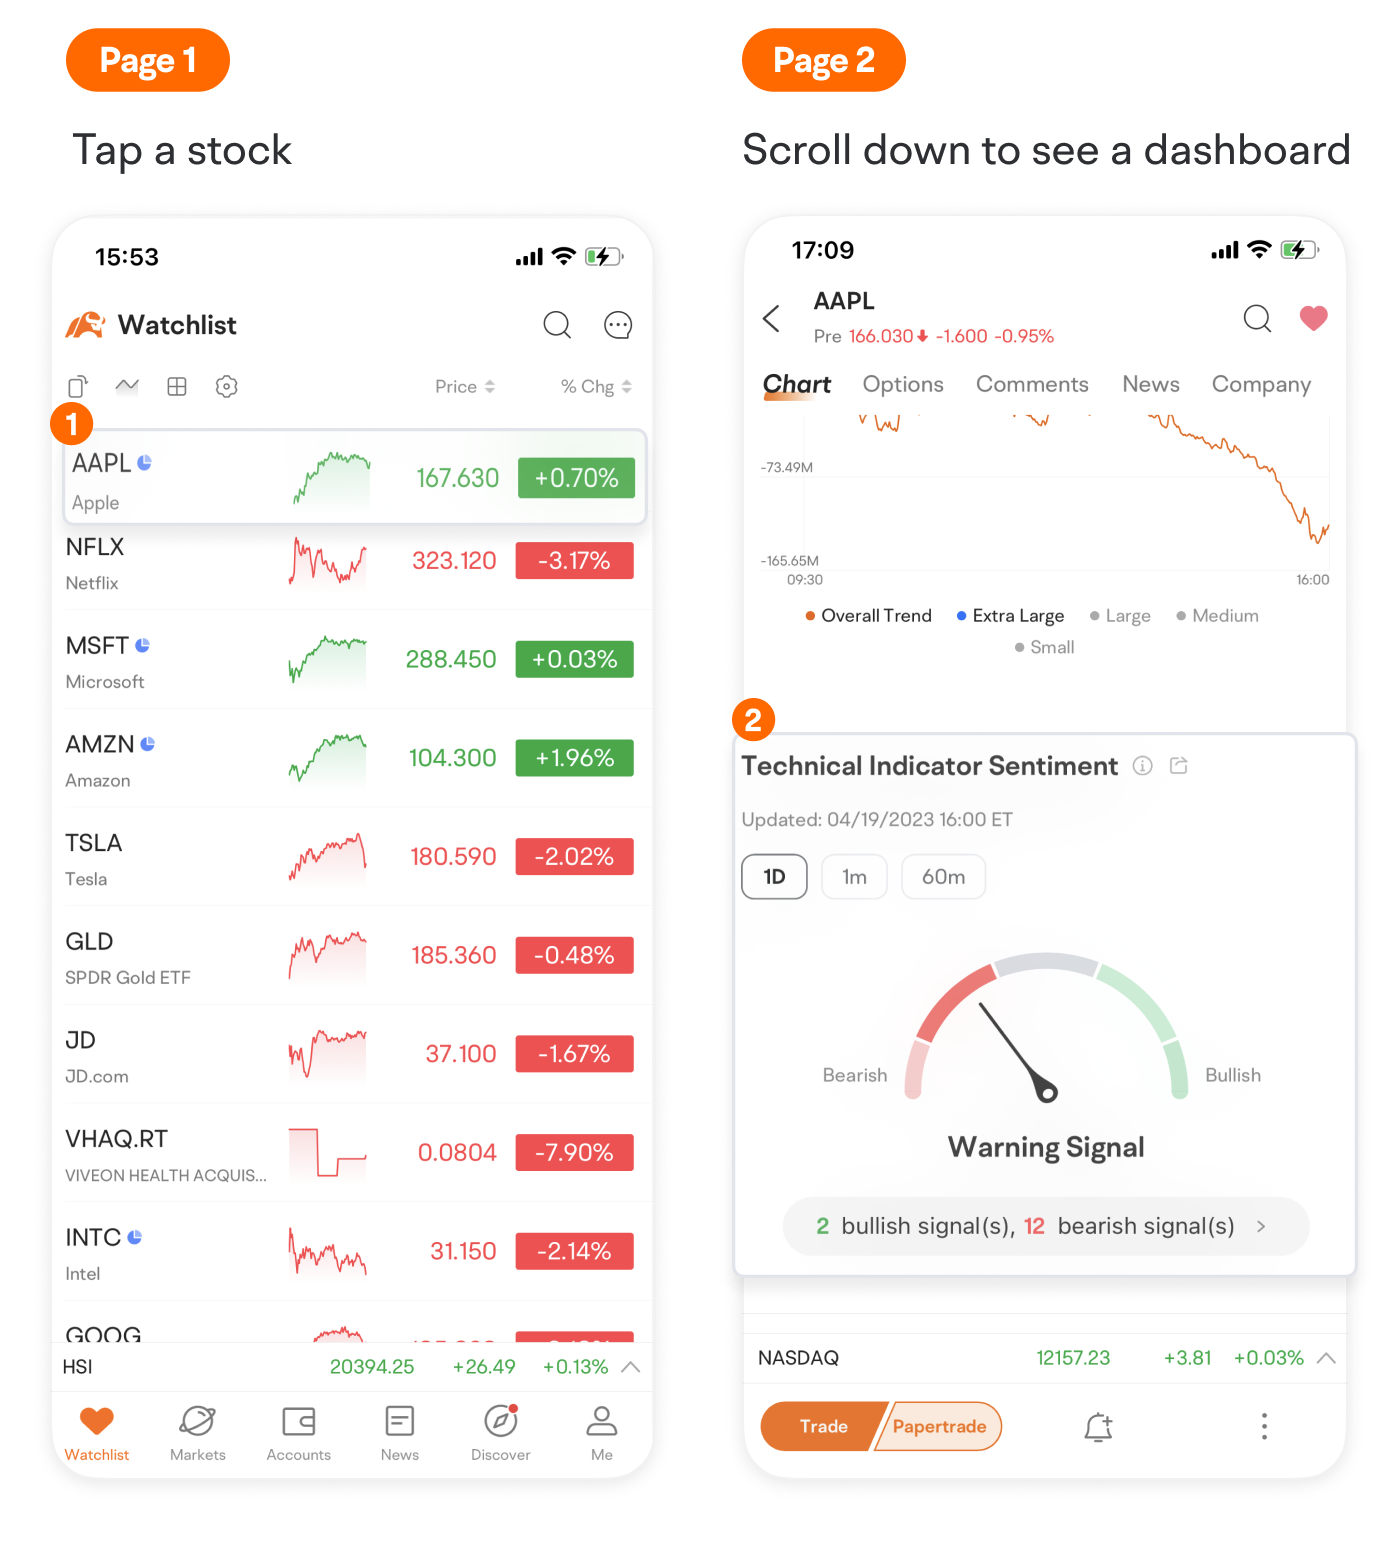
You can switch between 1 day, 1 minute and 60 minutes.
In this example, the daily chart, 1-minute chart and 60-minute chart all give bearish signals,
though the number of indicators is different.
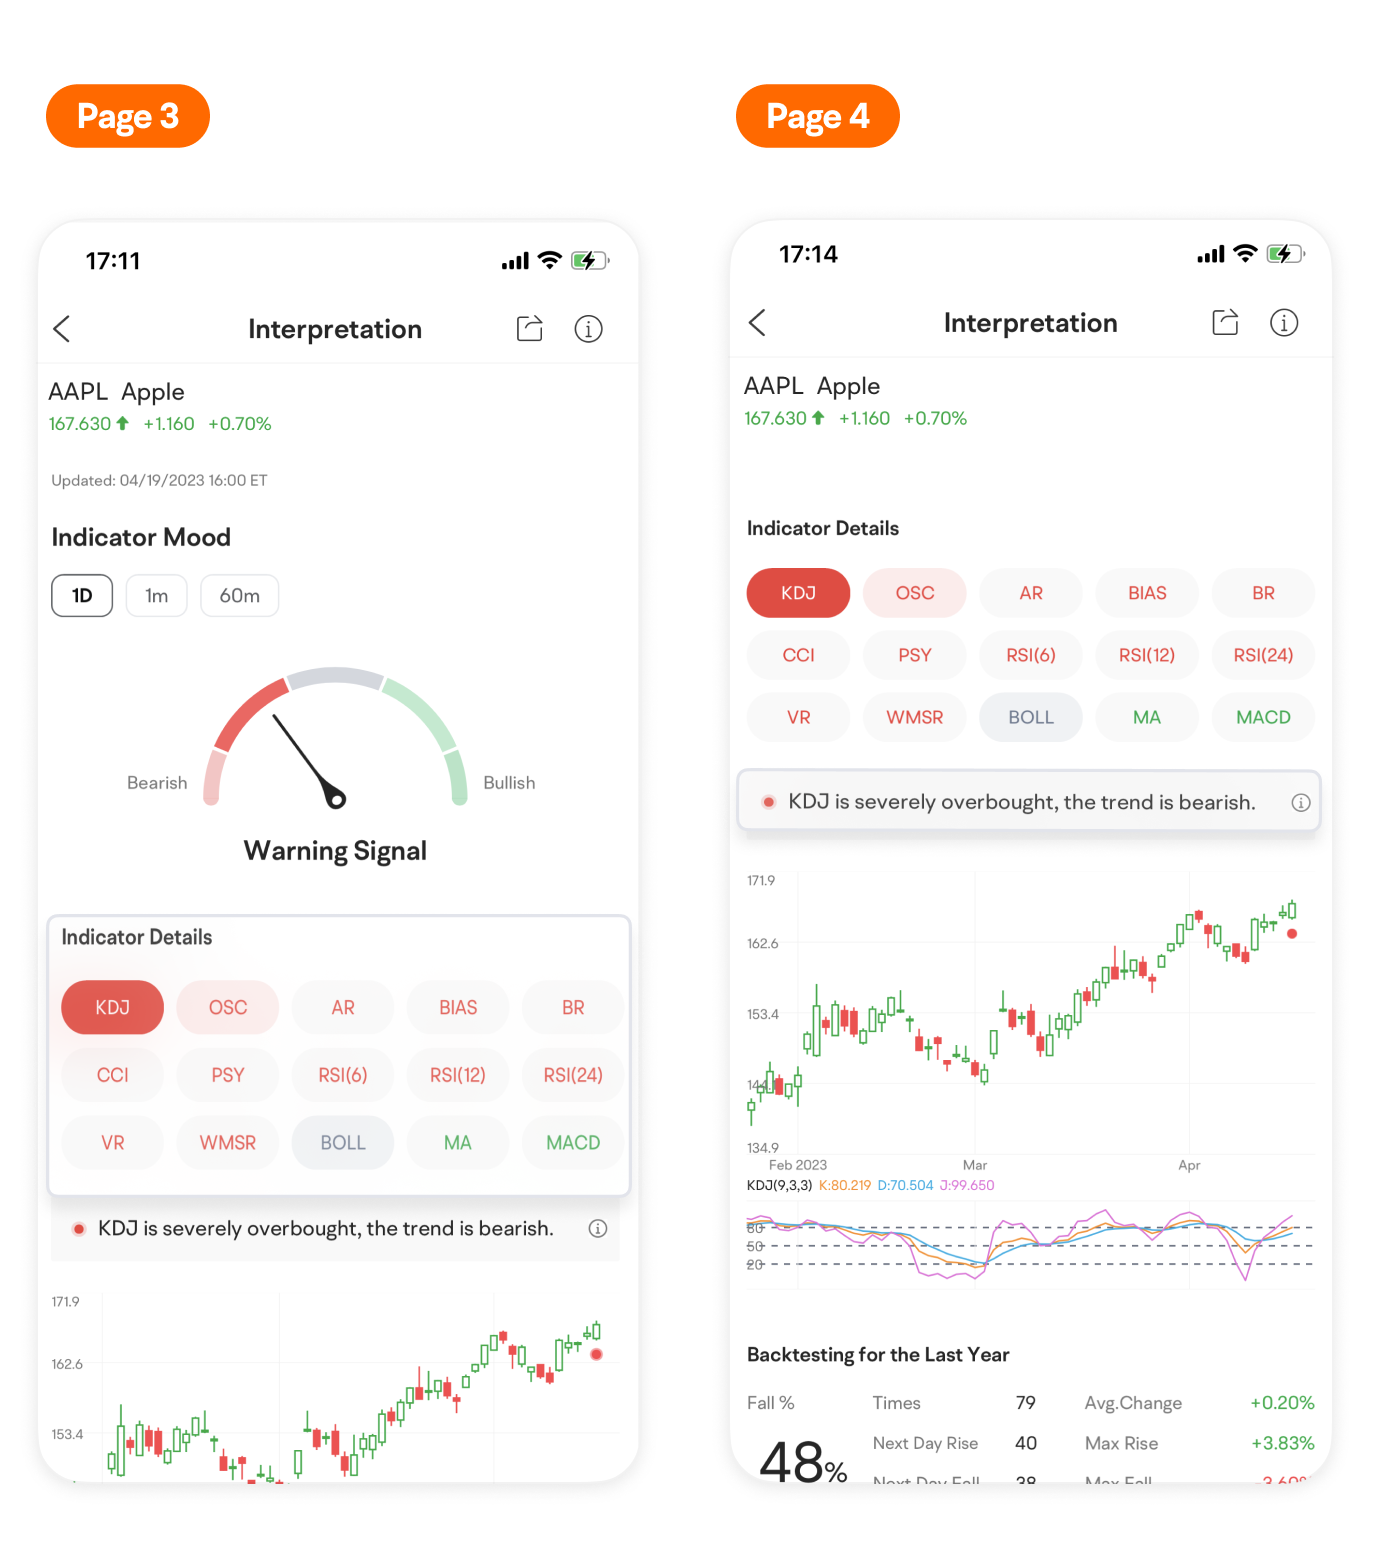
You can tap the signal bar to see details.
15 indicators are displayed respectively on the Technical Indicator Sentiment page.
Red indicates bearish, and the darker the shade, the more bearish the signal.
In this example, the KDJ indicates a highly overbought condition and is in dark red, suggesting a potential correction.
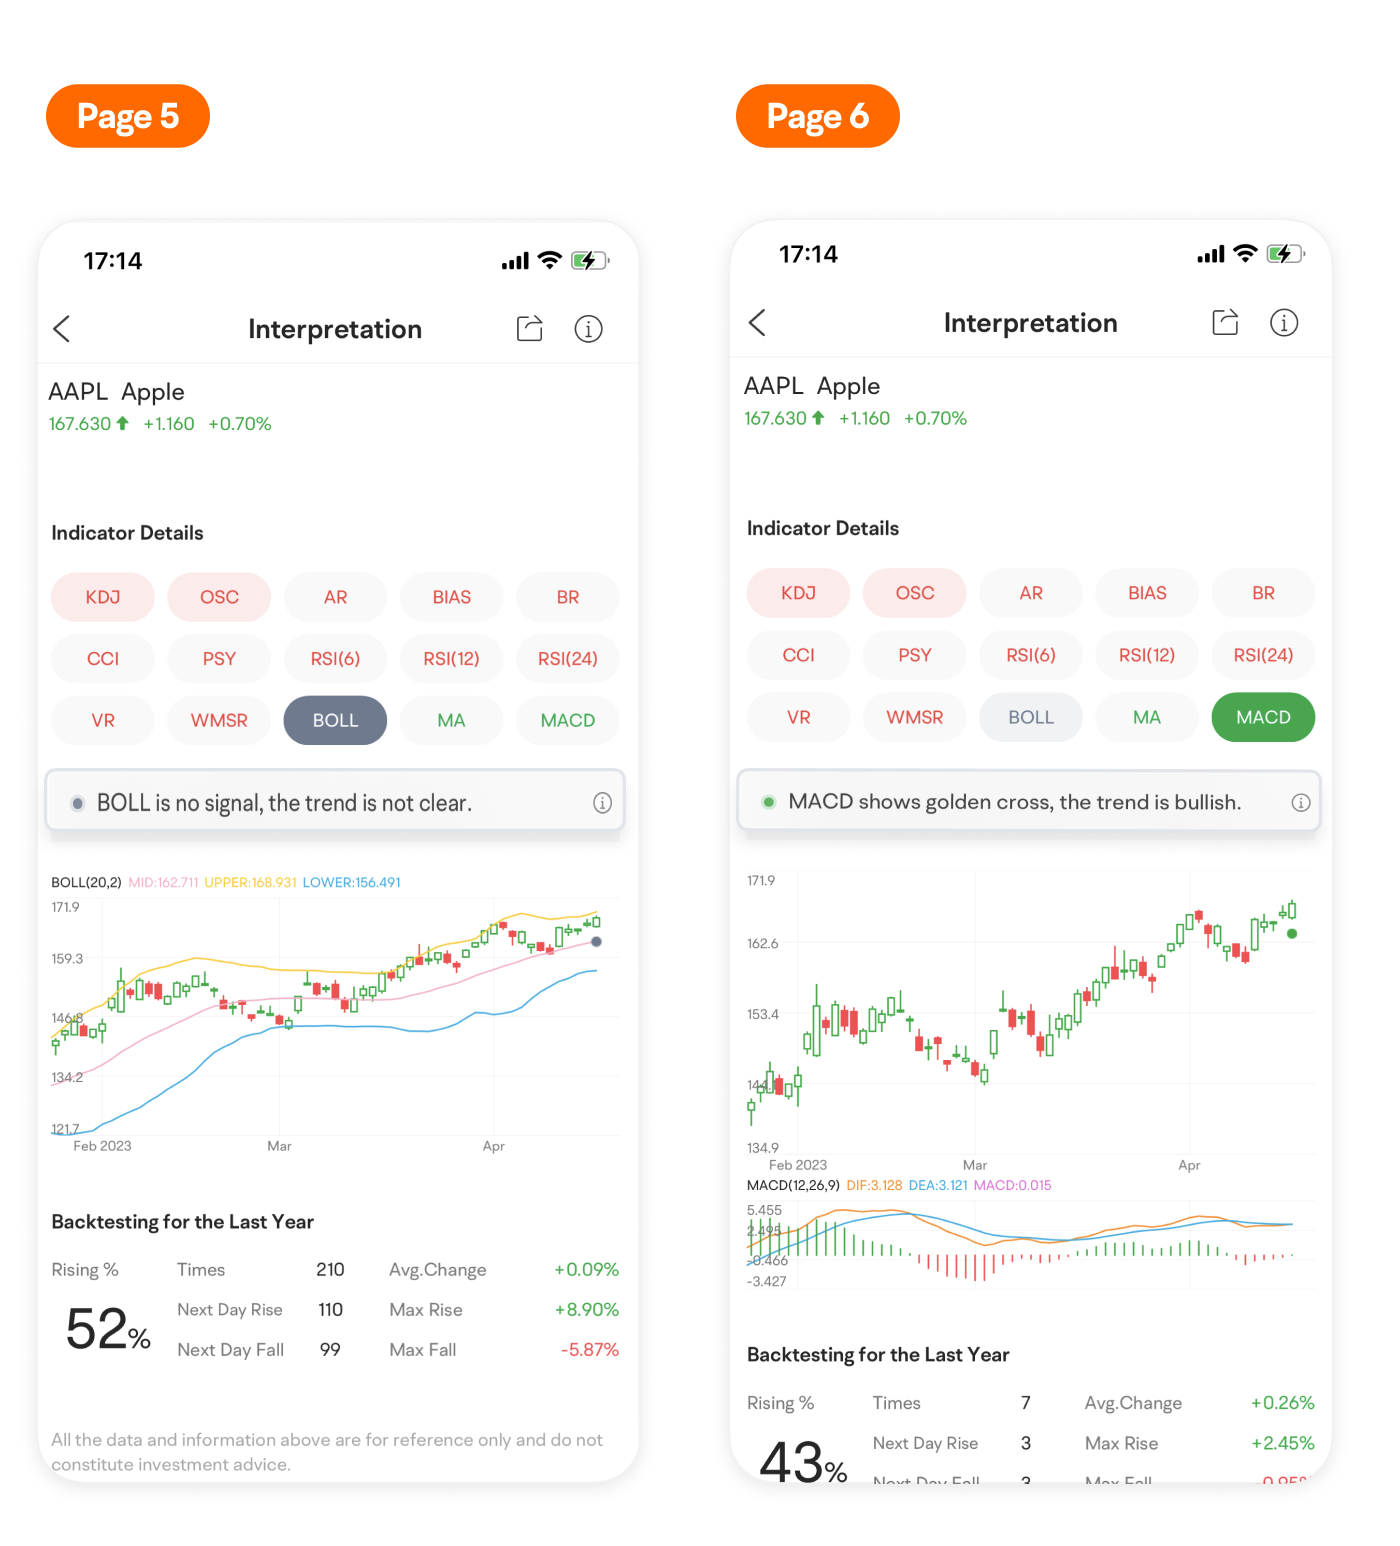
The color gray suggests an unclear trend, like the BOLL here, while green sends a bullish signal like the MACD.
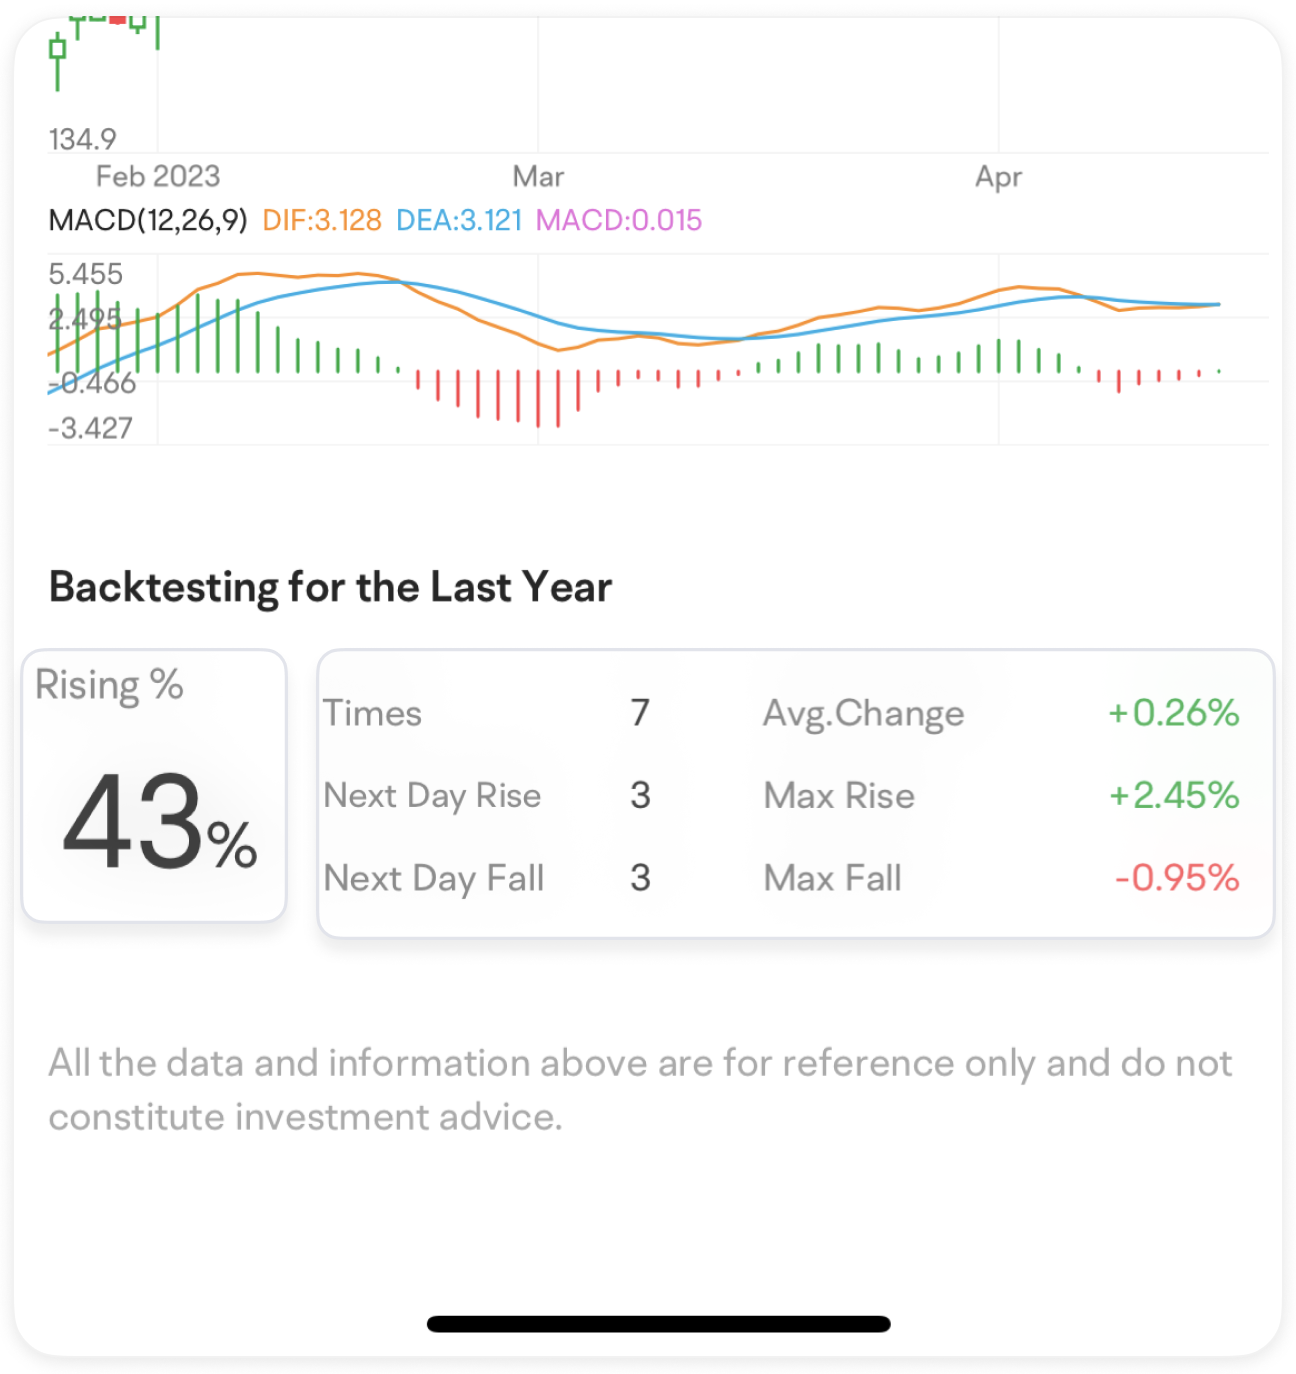
Scroll down and you’ll find Backtesting for the Last Year.
Here you can see how many times an indicator appeared over the past year and the up or down probability estimate.
The ratio is calculated by dividing the number of next day rises or falls by the times this indicator appeared.
Technical indicators can help traders better understand potential trends and price changes.
But it's worth noting that while technical indicators can be effective, they should not be relied upon exclusively when making trading decisions. Traders should take account of fundamental analysis and market sentiment before making any trades.
Join Moomoo courses to learn more about technical indicators.
This presentation is for informational and educational use only and is not a recommendation or endorsement of any particular investment or investment strategy. Investment information provided in this content is general in nature, strictly for illustrative purposes, and may not be appropriate for all investors. Read more
Recommend

Evaluating Stocks with Candlestick Patterns

Trade Overview and Capital Trend: Identify institutional investor Moves with moomoo

How to Trade 0DTE Options on moomoo

How to Papertrade Options
Moomoo AI:Invest Forward and Easier
How to Track Earnings Reports
How to Trade Crypto on moomoo
What is Technical Indicator Sentiment feature
How to subscribe to IPO using moomoo
How to Use Fibonacci Retracement Levels
How to Use Date/Price Range
How to Draw Trend Lines
How to Identify Candlestick Patterns
How to Use Drawing Tools on moomoo
How to Use MA in Real Trading
How to Use Technical Indicators on moomoo
How to Use MACD in Real Trading
Evaluating Stocks with Candlestick Patterns
Trade Overview and Capital Trend: Identify institutional investor Moves with moomoo
How to Trade 0DTE Options on moomoo
How to Papertrade Options
Moomoo AI:Invest Forward and Easier
How to Track Earnings Reports
How to Trade Crypto on moomoo
What is Technical Indicator Sentiment feature
How to subscribe to IPO using moomoo
How to Use Fibonacci Retracement Levels
How to Use Date/Price Range
How to Draw Trend Lines
How to Identify Candlestick Patterns
How to Use Drawing Tools on moomoo
How to Use MA in Real Trading
How to Use Technical Indicators on moomoo
How to Use MACD in Real Trading

