
Moomoo Insights
Jul 16 15:38
TSMC Earnings: AI Demand Is Stronger Than the Chip Selloff Suggests
Moomoo Insights
Sep 30 05:04
Live Take | Anthropic’s $518B Compute Bet: Who Wins From the AI Buildout?
It's hard to find stocks with potential? Moomoo might help.
Generally, we select stocks by analyzing fundamentals or technical indicators, such as candlestick patterns and chart formations.
In this tutorial, we'll show you how to access Candlestick Patterns on moomoo.
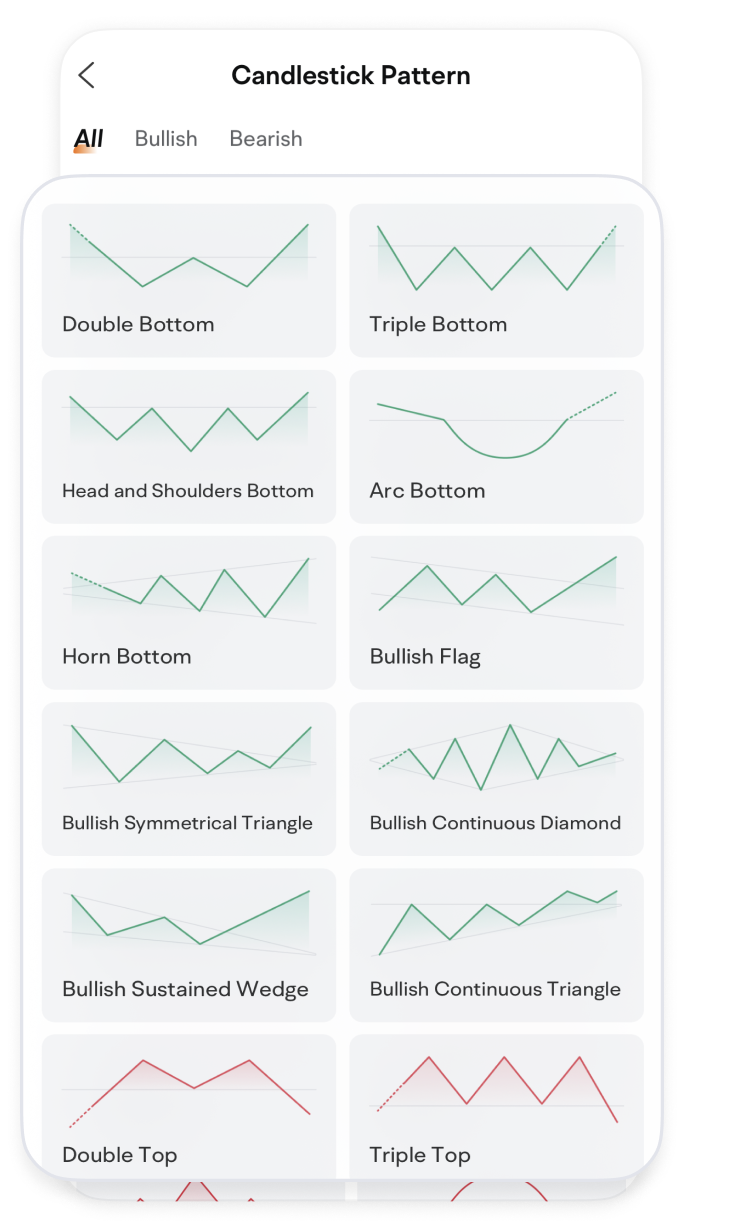
Tap Markets> US> Candlestick Patterns
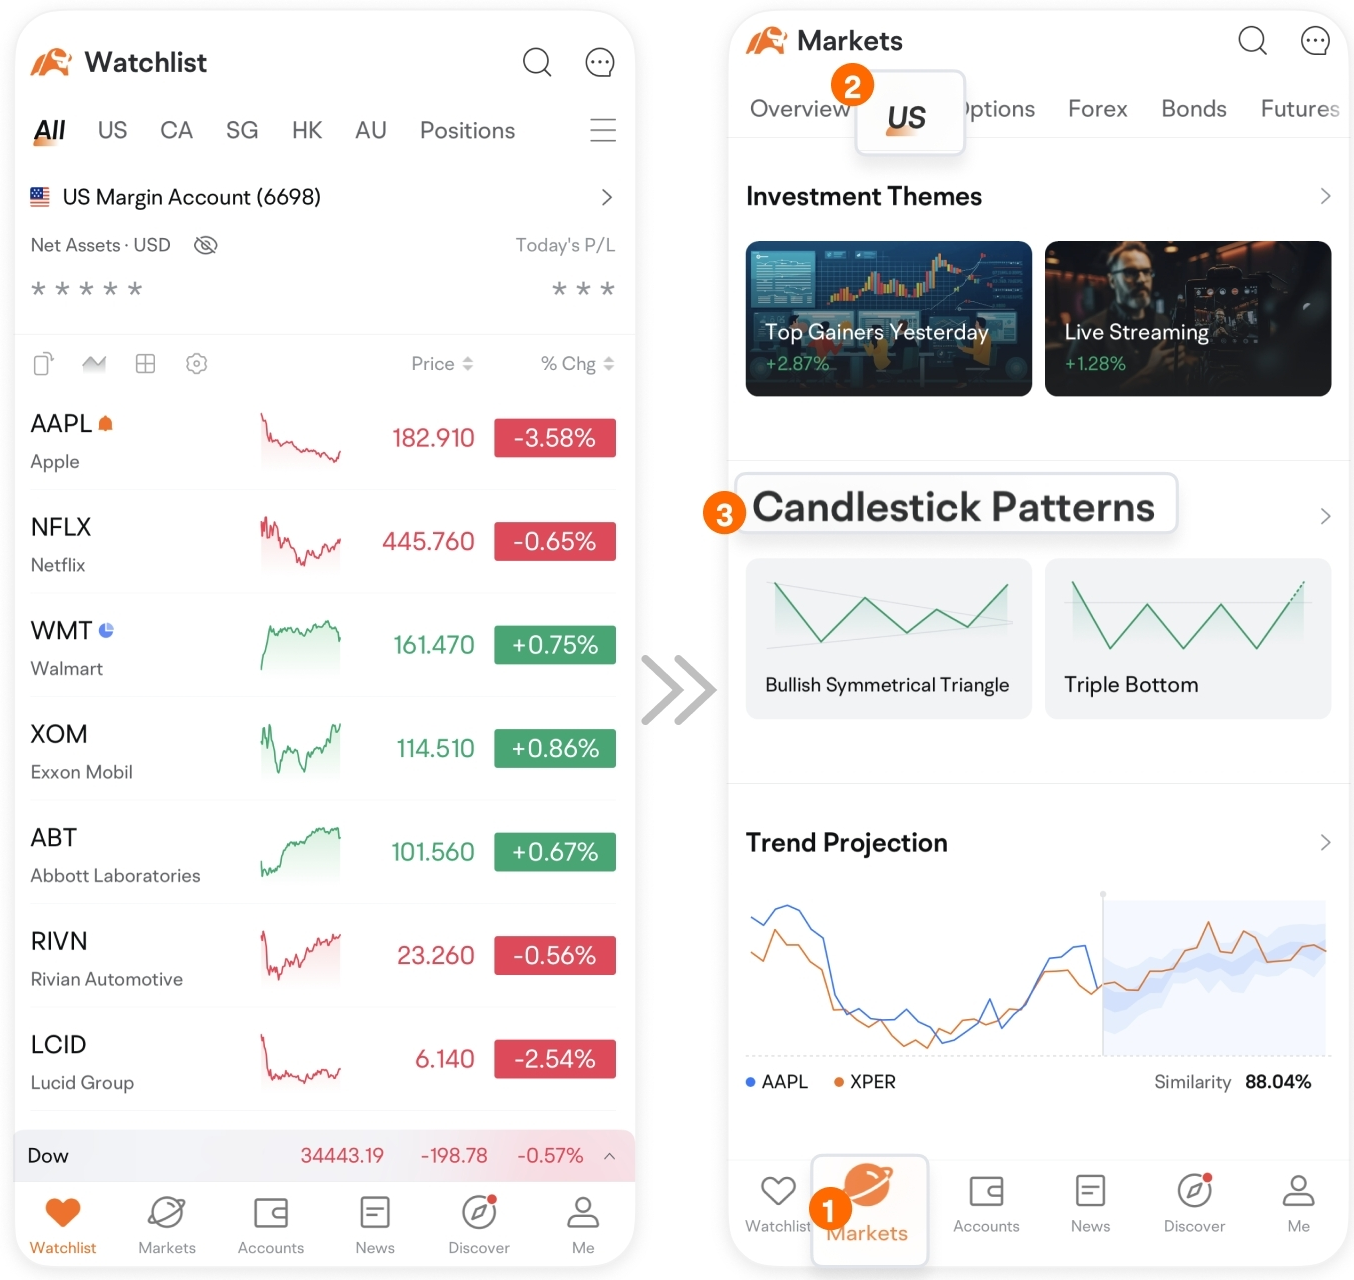
Here we list 20 common bullish and bearish patterns.
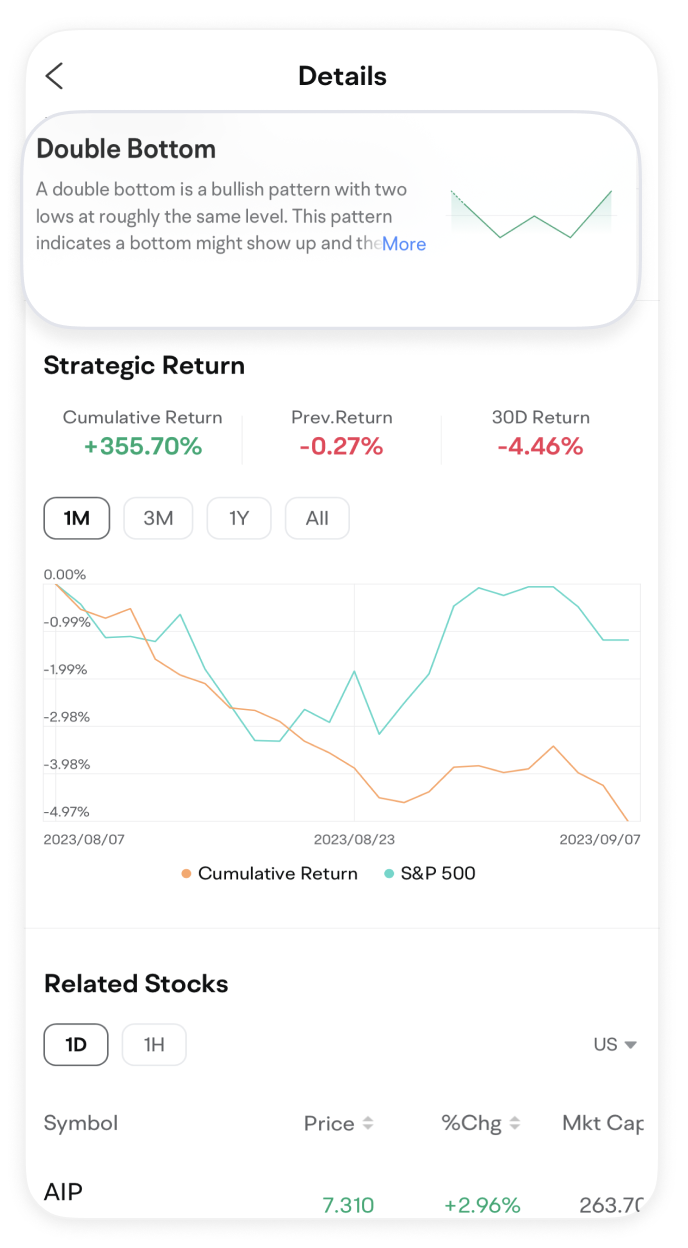
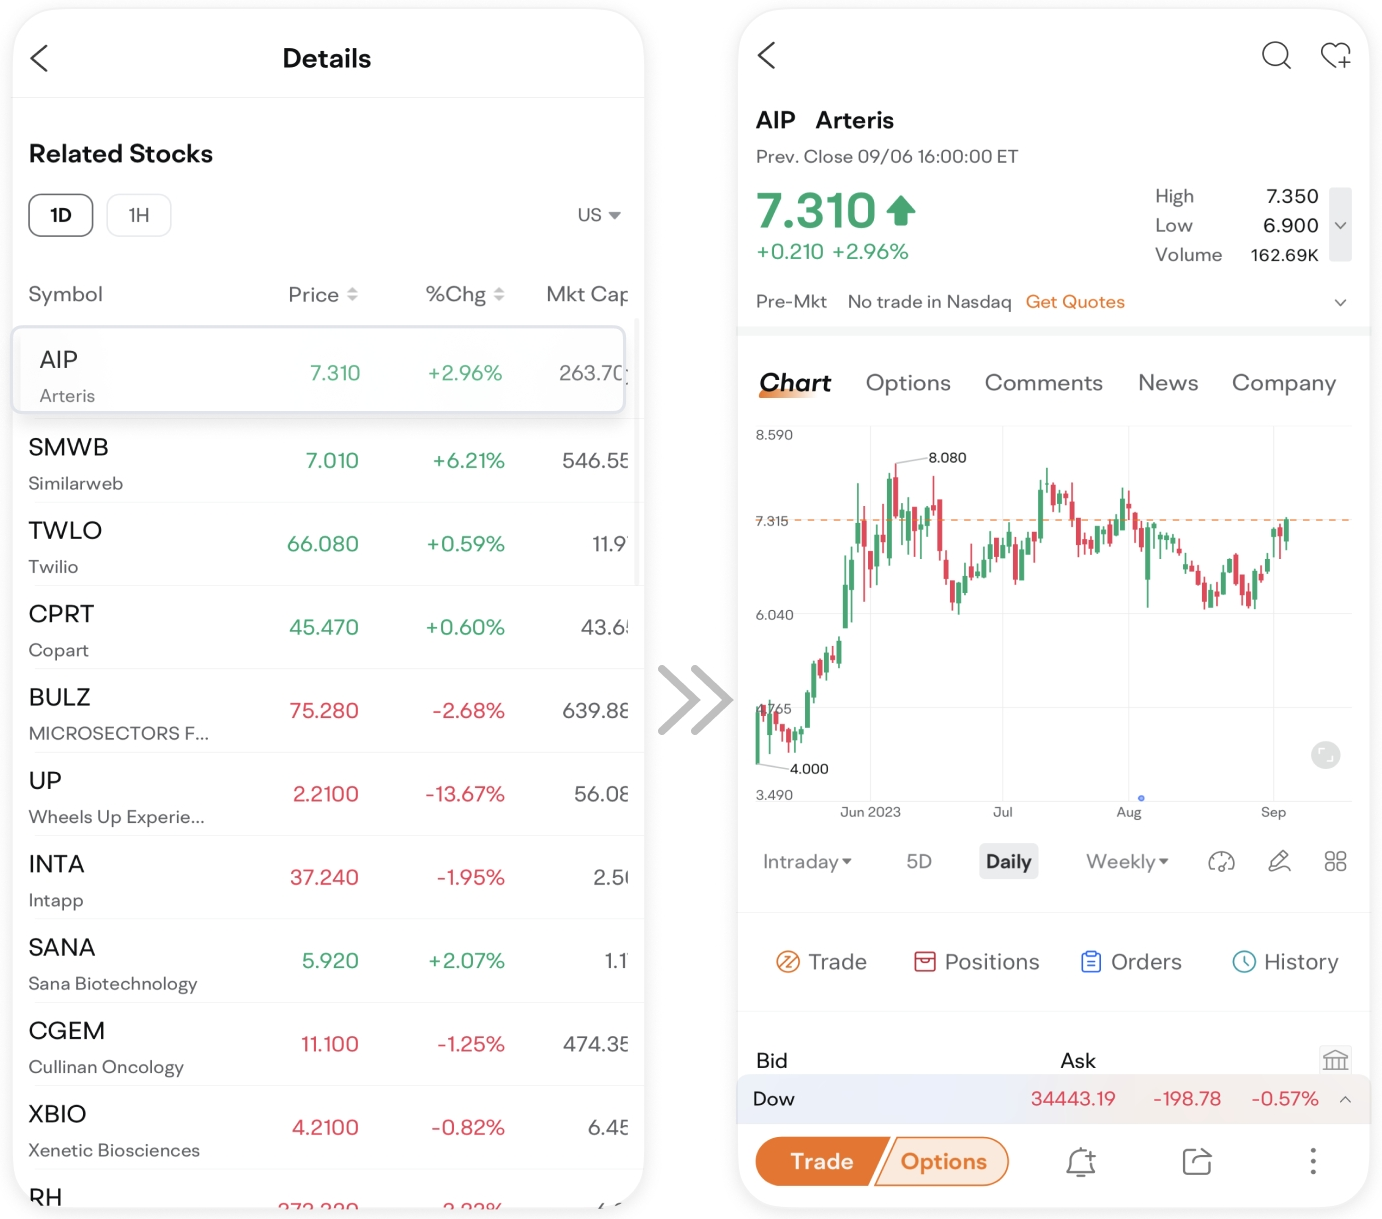
Tap on a pattern to see stocks with the most similar candlestick formations to the selected pattern.
Then select a screened stock to view its detailed quotes page for more information.
How to show the pattern on the stock's candlestick chart?
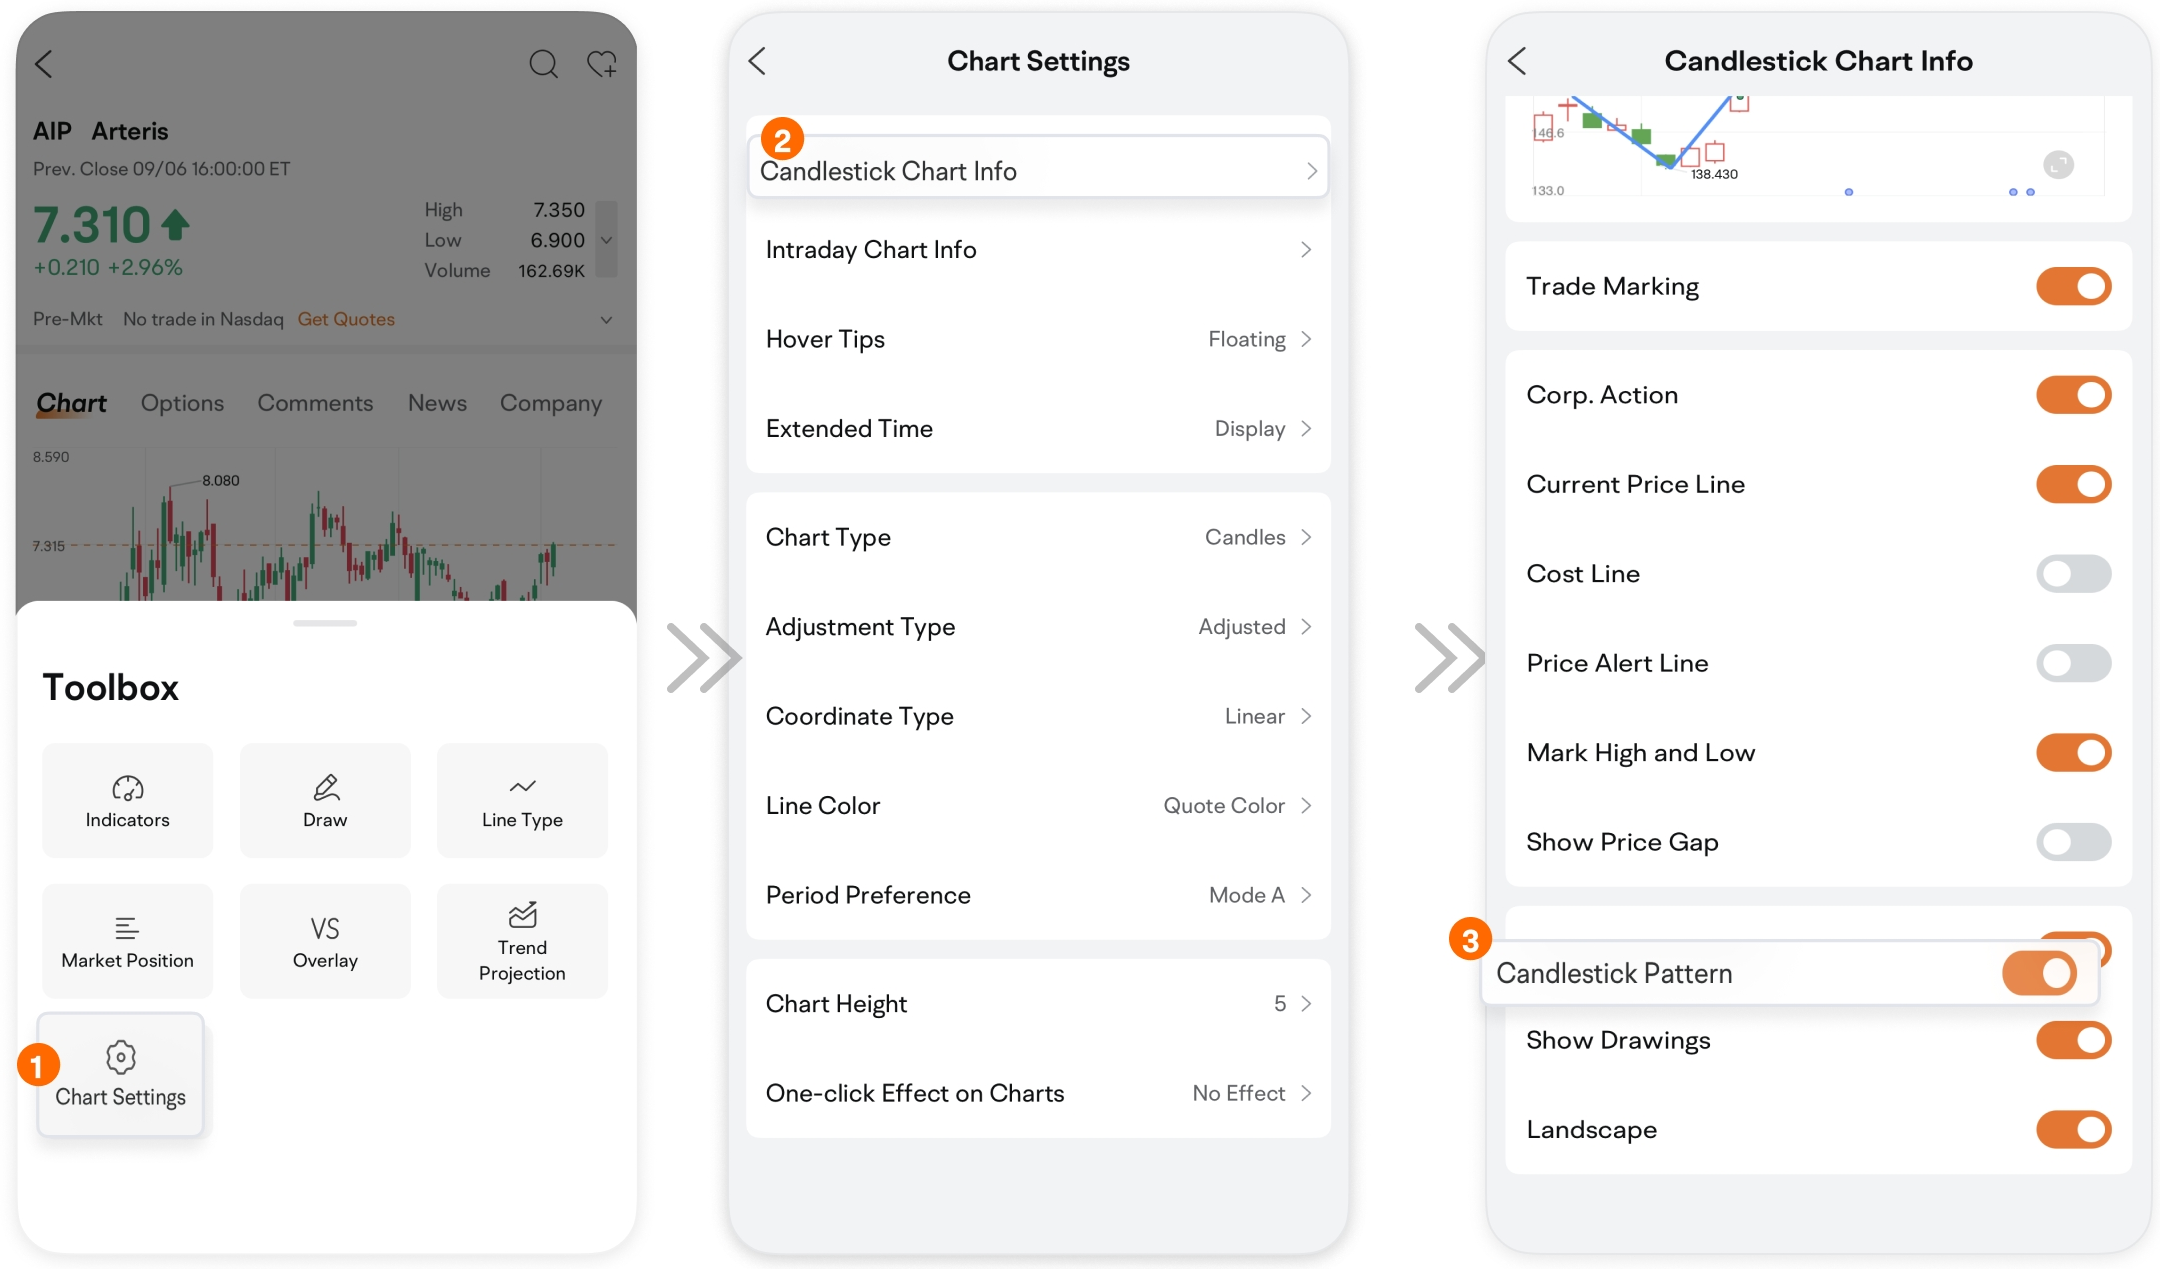
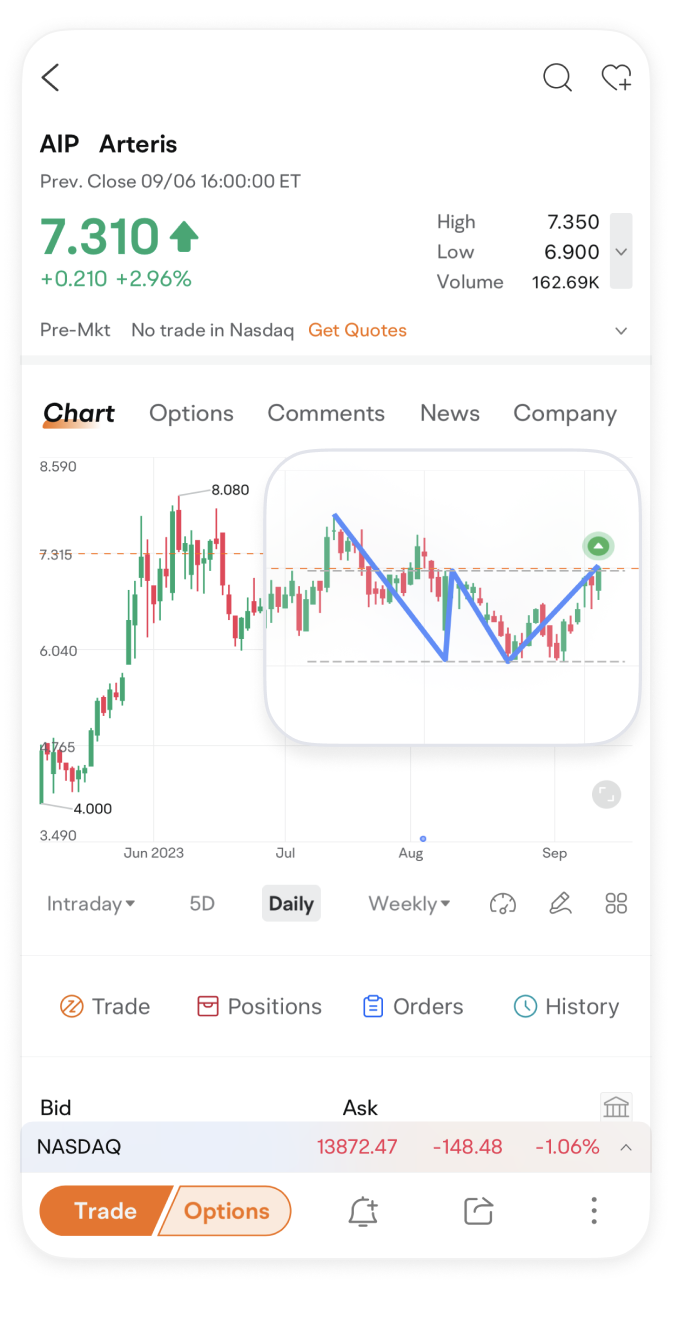
Detailed Quotes> Toolbox>Chart Settings> Candlestick Chart Info> Enable Candlestick Pattern.
If the Candlestick Pattern switch is enabled, the pattern will be automatically depicted on the chart, saving us the trouble of drawing it on our own.
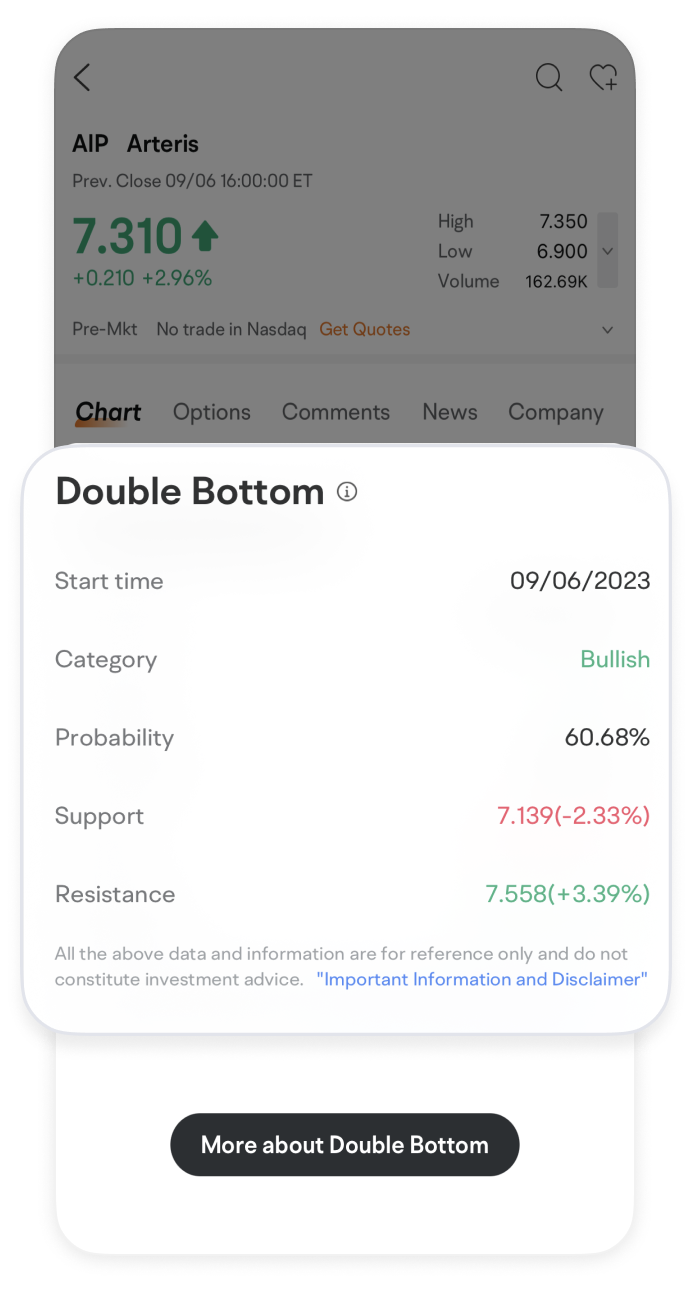
Tap on the pattern to view support and resistance level estimates and the next day's rise probability.
This feature uses big data and image recognition algorithms to quickly identify stocks that may meet your criteria.
However, it's important to remember that when making investment decisions, other factors, including fundamentals and market sentiment should also be taken into consideration.
This presentation is for informational and educational use only and is not a recommendation or endorsement of any particular investment or investment strategy. Investment information provided in this content is general in nature, strictly for illustrative purposes, and may not be appropriate for all investors. Read more
Recommend

Evaluating Stocks with Candlestick Patterns

Trade Overview and Capital Trend: Identify institutional investor Moves with moomoo

How to Trade 0DTE Options on moomoo

How to Papertrade Options
Moomoo AI:Invest Forward and Easier
How to Track Earnings Reports
How to Trade Crypto on moomoo
What is Technical Indicator Sentiment feature
How to subscribe to IPO using moomoo
How to Use Fibonacci Retracement Levels
How to Use Date/Price Range
How to Draw Trend Lines
How to Identify Candlestick Patterns
How to Use Drawing Tools on moomoo
How to Use MA in Real Trading
How to Use Technical Indicators on moomoo
How to Use MACD in Real Trading
Evaluating Stocks with Candlestick Patterns
Trade Overview and Capital Trend: Identify institutional investor Moves with moomoo
How to Trade 0DTE Options on moomoo
How to Papertrade Options
Moomoo AI:Invest Forward and Easier
How to Track Earnings Reports
How to Trade Crypto on moomoo
What is Technical Indicator Sentiment feature
How to subscribe to IPO using moomoo
How to Use Fibonacci Retracement Levels
How to Use Date/Price Range
How to Draw Trend Lines
How to Identify Candlestick Patterns
How to Use Drawing Tools on moomoo
How to Use MA in Real Trading
How to Use Technical Indicators on moomoo
How to Use MACD in Real Trading

