Moomoo Insights
Jul 16 15:38
TSMC Earnings: AI Demand Is Stronger Than the Chip Selloff Suggests
Moomoo Insights
Sep 30 05:04
Live Take | Anthropic’s $518B Compute Bet: Who Wins From the AI Buildout?
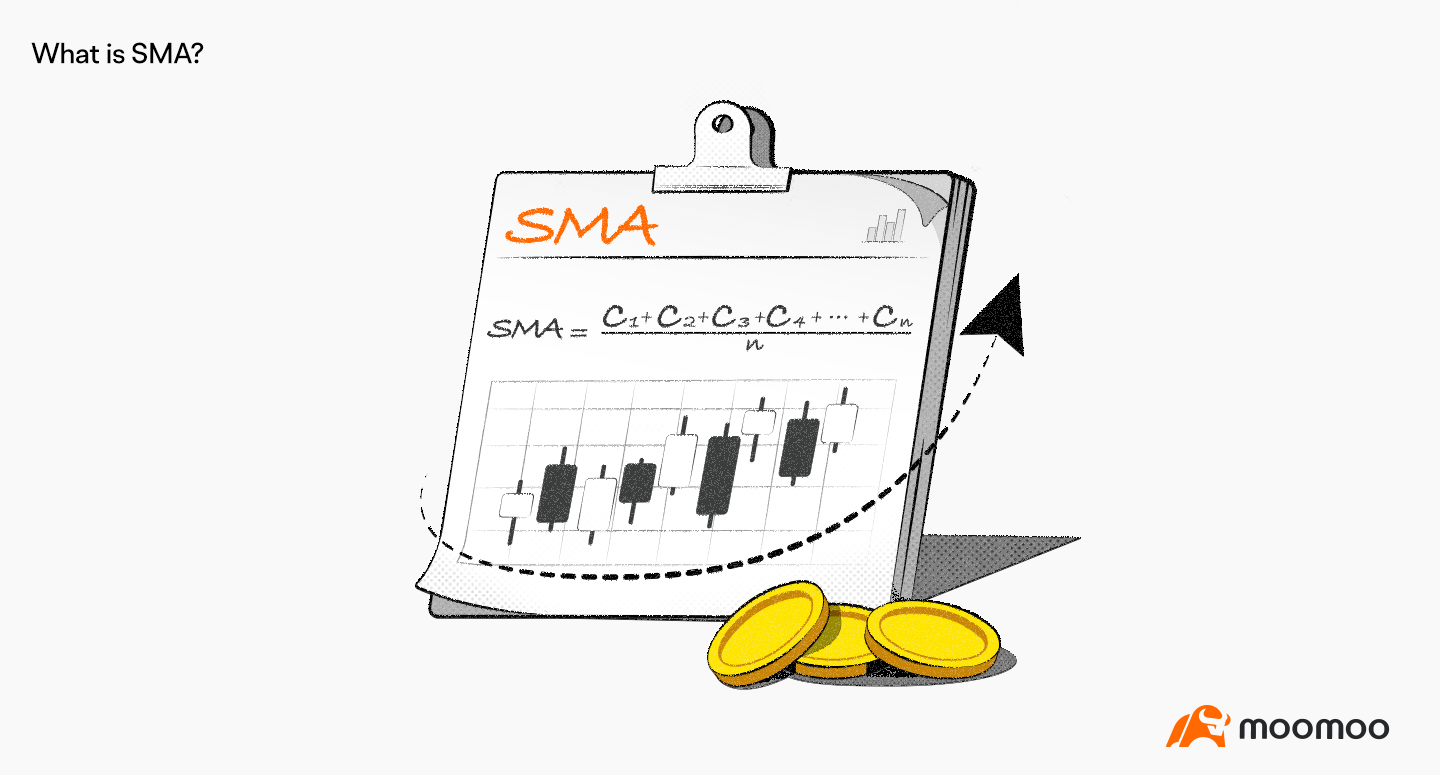
● A simple moving average is one of the most basic technical indicators that reflects asset price changes.
● Investors tend to go long on a security when its short-term moving average crosses above the long-term average, signaling strong short-term prices.
● The indicator may be biased when applied to extreme short-term fluctuations.
A simple moving average, sometimes called an “arithmetic moving average”, averages out the closing prices for a specific period.
It is one of the most basic indicators that measures asset price fluctuations.
C: the closing price of an asset for each day over a specific period
n: the number of days
Let’s take a 5-day SMA as an example.
We could add the closing prices of a security for five consecutive trading days and divide the number by five. The result would be the first data point of this 5-day SMA.
The second data point would drop the closing price on the first day, add the closing price on the sixth day, and divide the figure by five again.
That way, all data points are finally connected up as SMA, forming a line that moves as the average value of the underlying asset changes.
Traders often use SMA as a starting point when conducting their technical analysis. Short-term moving averages may inform their trading decisions.
For example, when the short-term average (5 days) crosses above the long-term average (30 and 60 days), it sends a bullish signal, where investors may consider entering trades.
By contrast, if the short-term average (5 days) crosses below the long-term average (30 and 60 days), investors might consider closing their positions as potential losses are in store.
It’s worth noting that SMA assigns an equal weighting to all closing prices on each day, with no regard to recent and older data. So the indicator may not tell a good story of violent short-term price moves.
This presentation is for informational and educational use only and is not a recommendation or endorsement of any particular investment or investment strategy. Investment information provided in this content is general in nature, strictly for illustrative purposes, and may not be appropriate for all investors. Read more
Recommend

Brokerage Account

What is Qualitative Analysis?

What Is Moving Average Convergence Divergence(MACD)?

What is Quantitative Analysis?
What is a Value Stock?
What is the Debt Ratio?
What is a Balance Sheet?
What is Market Sentiment?
What is Retirement Planning?
What is Sector Rotation?
What is Deflation?
What is Simple Moving Average (SMA)?
What is Paper Trading?
What are CPI, PPI and PMI?
What is a Candlestick?
What Is an Initial Public Offering (IPO)?
What is a Stock?
What is Swing Trading?
What are Bull and Bear Markets?
What is Circuit Breakers?
What is EPS?
What is the Stock Market?
What is ADR?
What is Technical Analysis?
What is the Nasdaq Composite?
What is the S&P 500?
What is Return on Investment (ROI)?
What is the Federal Open Market Committee (FOMC)?
What is Net Margin?
How to read level 2 market data - using an order book for trading strategies
What Is Equity?
What is the Dow Jones Industrial Average
What is an Investment Portfolio?
What is a Security?
What is an Investment?
What is Price-Volume Relationship?
What is Over-the-Counter (OTC)?
What is a Fiscal Year?
What is Day Trading?
What are Dual Listing and Secondary Listing?
What is the Securities and Exchange Commission(SEC)?
What is competitive bidding?
Brokerage Account
What is Qualitative Analysis?
What Is Moving Average Convergence Divergence(MACD)?
What is Quantitative Analysis?
What is a Value Stock?
What is the Debt Ratio?
What is a Balance Sheet?
What is Market Sentiment?
What is Retirement Planning?
What is Sector Rotation?
What is Deflation?
What is Simple Moving Average (SMA)?
What is Paper Trading?
What are CPI, PPI and PMI?
What is a Candlestick?
What Is an Initial Public Offering (IPO)?
What is a Stock?
What is Swing Trading?
What are Bull and Bear Markets?
What is Circuit Breakers?
What is EPS?
What is the Stock Market?
What is ADR?
What is Technical Analysis?
What is the Nasdaq Composite?
What is the S&P 500?
What is Return on Investment (ROI)?
What is the Federal Open Market Committee (FOMC)?
What is Net Margin?
How to read level 2 market data - using an order book for trading strategies
What Is Equity?
What is the Dow Jones Industrial Average
What is an Investment Portfolio?
What is a Security?
What is an Investment?
What is Price-Volume Relationship?
What is Over-the-Counter (OTC)?
What is a Fiscal Year?
What is Day Trading?
What are Dual Listing and Secondary Listing?
What is the Securities and Exchange Commission(SEC)?
What is competitive bidding?