How to trade smarter with candlestick charts
Just as traffic lights tell you when to start and stop on the road, price charts can provide you with valuable insights into the stock market. By analyzing market behavior through technical analysis, also known as chart analysis, traders can identify potential buy and sell signals.
Takeaways:
● Interpreting the three key aspects of candlesticks enables you to gauge market sentiment.
● Support and resistance represent crucial price turning points.
● Moving averages (MAs) offer a straightforward and effective method for trend analysis.
1. Understanding candlesticks
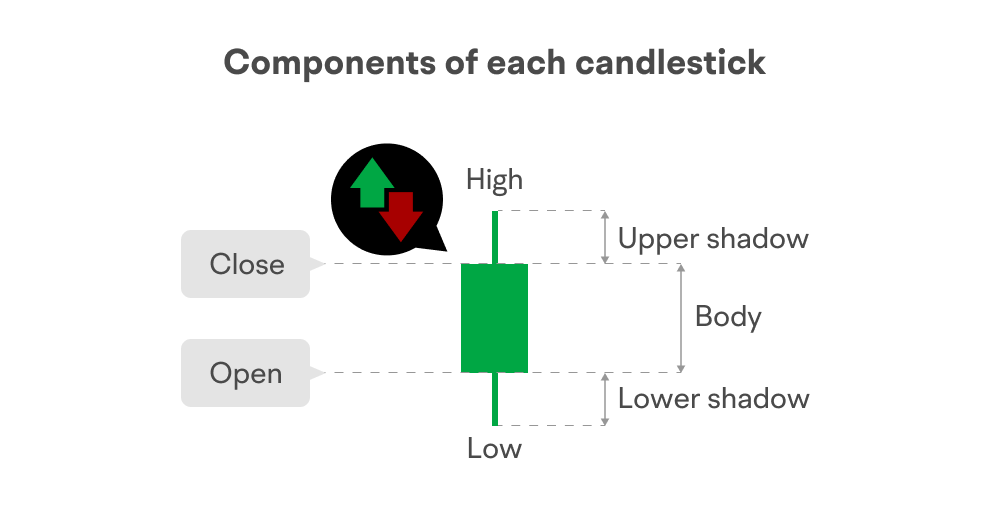
Candlesticks play a crucial role in chart analysis, offering insights into market behavior through visual price trends. By interpreting the color, body, and shadows of candlesticks, traders can gauge market sentiment and potential price movements.
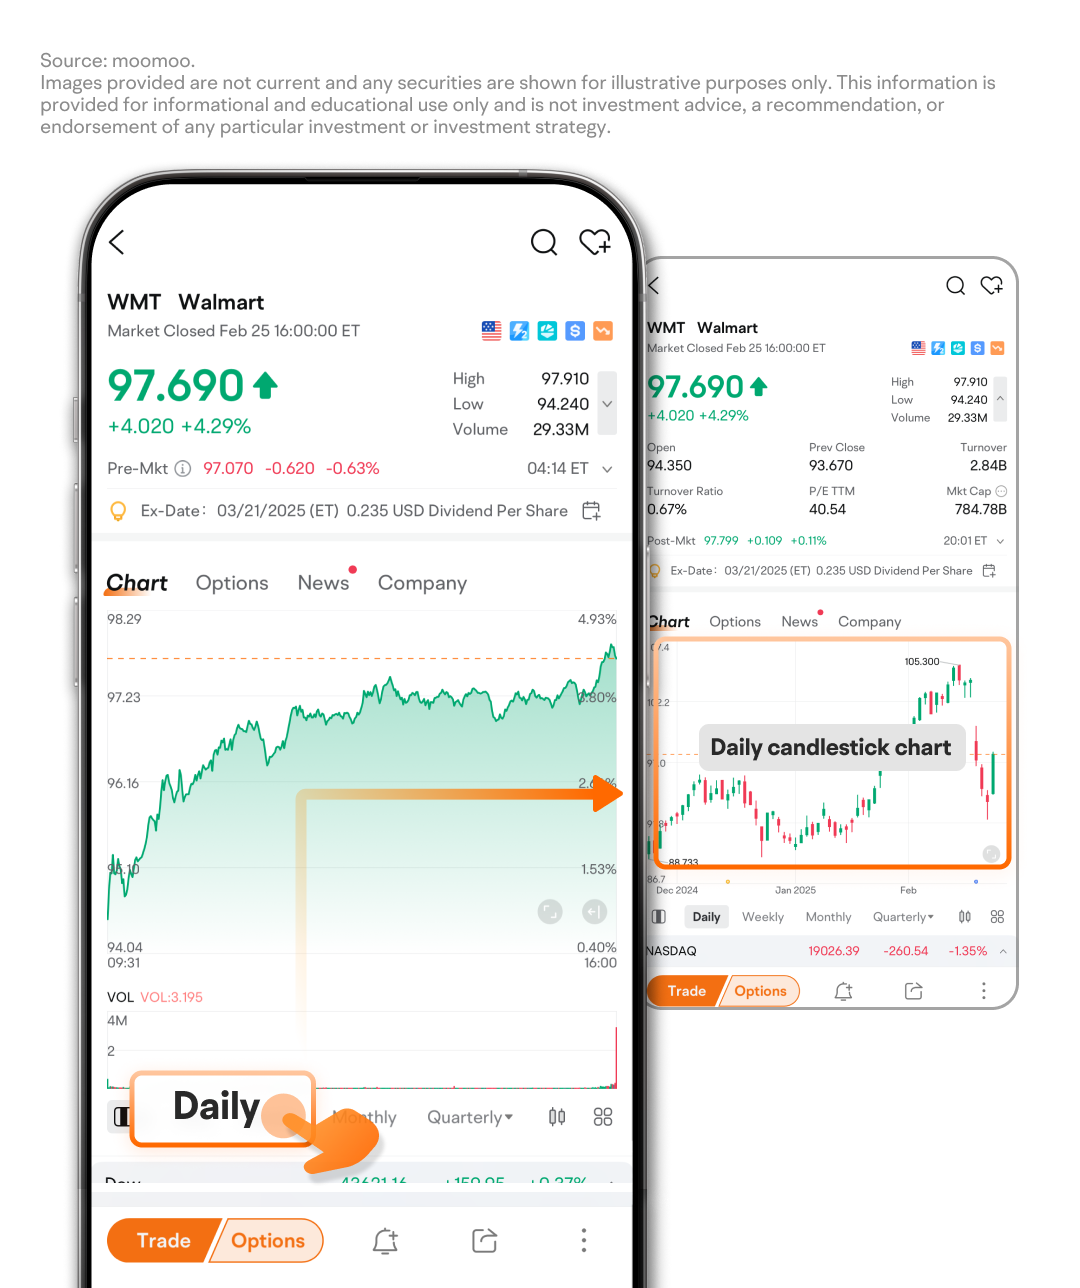
Daily candlesticks are commonly used, reflecting market sentiment and the balance of bulls and bears. To view the daily candlestick chart on moomoo, navigate to the Quotes page and select the "Daily" button.
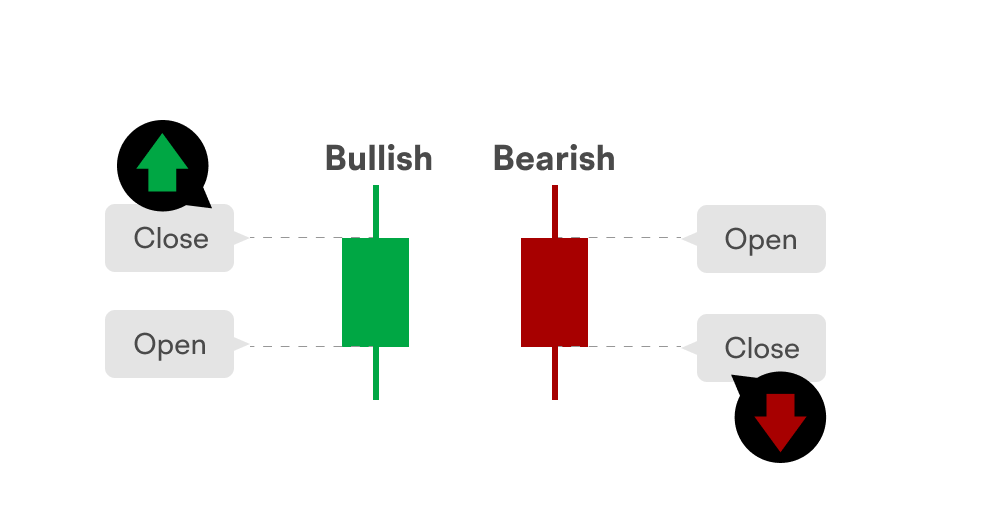
Here are three key techniques for interpreting candlesticks:
● Color indicates market sentiment, with green (bullish) candlesticks reflecting a higher closing price than the opening price, suggesting a bullish market, while red (bearish) candlesticks signal a bearish market.
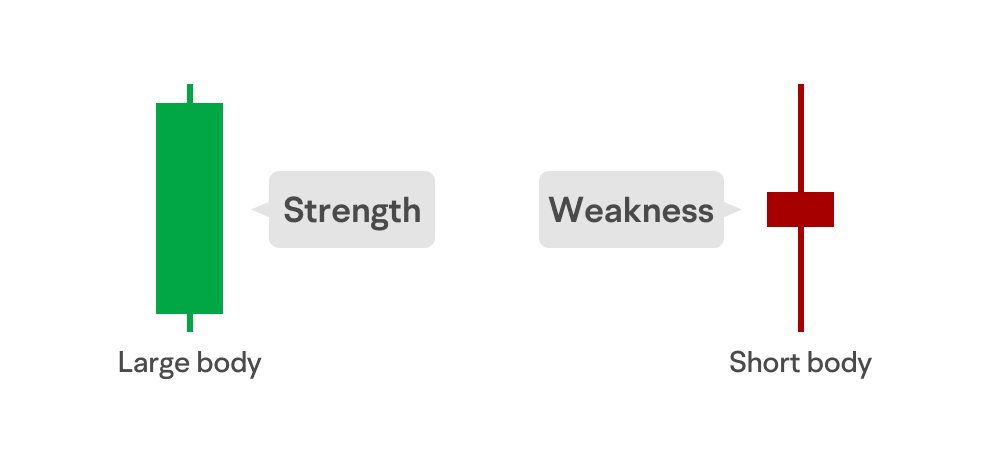
● The body of the candlestick reveals the strength of market sentiment. A larger body signifies a significant difference between the closing and opening prices, dominance by either bulls or bears, and potential momentum in the future.
● Shadows provide insight into the rejection of bulls and bears. A longer upper shadow indicates stronger bearish rejection, while a longer lower shadow suggests stronger bullish rejection. Extended shadows may foreshadow price movements in the opposite direction.
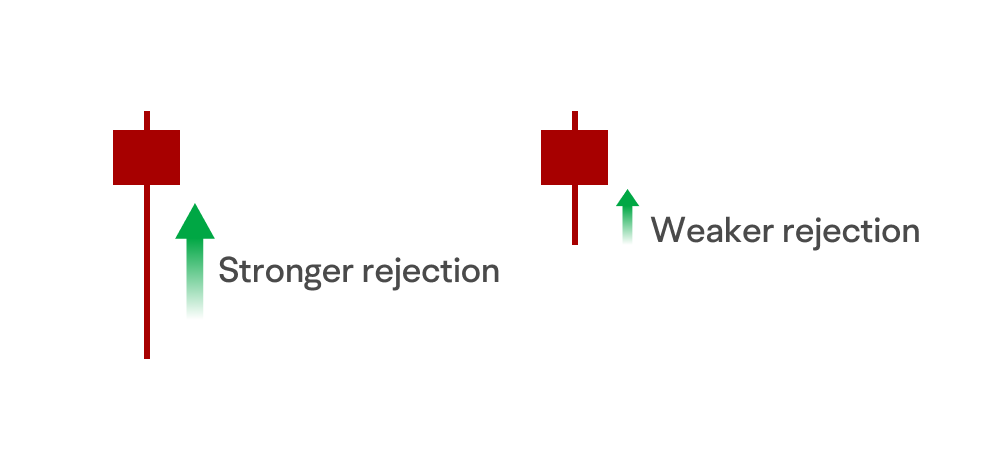
Interpreting these aspects of candlesticks enables traders to gauge market sentiment. Nonetheless, a thorough analysis and a broader perspective are necessary to grasp market dynamics.
2. Identifying potential support and resistance
Support and resistance are fundamental concepts in chart analysis, representing crucial price turning points.
When the buying force weakens relative to the selling force, stock prices tend to decrease. However, at specific levels or areas, a shift occurs where buying surpasses selling, halting the decline and causing a rebound—known as a "support level."
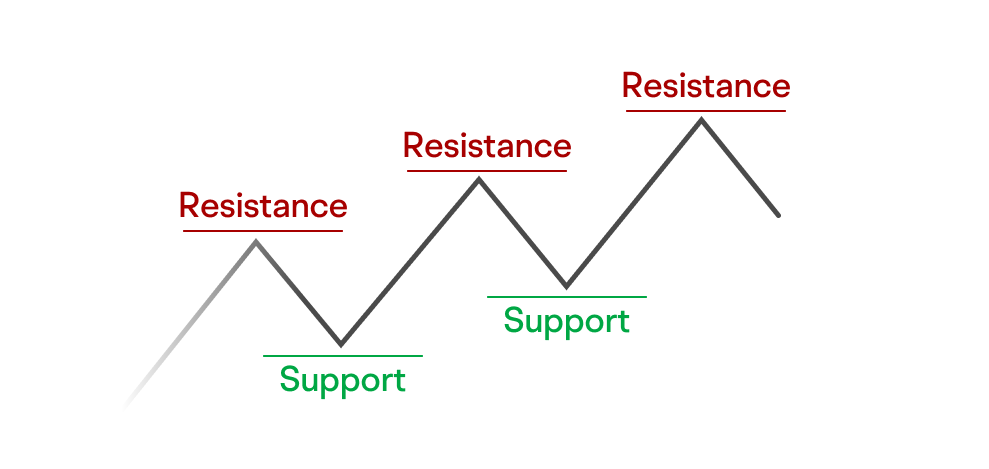
Likewise, a "resistance level" marks a strong selling pressure point where prices shift from an upward to a downward trend.
Experienced traders utilize candlestick charts to pinpoint potential support and resistance levels. Useful drawing tools available on moomoo can help you pinpoint potential support and resistance levels, including:
● Horizontal Line: Use this tool when stock prices consistently hit specific low or high pivot points over a period. Draw a horizontal line to identify potential support or resistance levels.
● Trend Line: Trend lines are valuable for assessing market trends and potential support or resistance levels. Connect pivot price lows to create an uptrend line, and highs for a downtrend line.
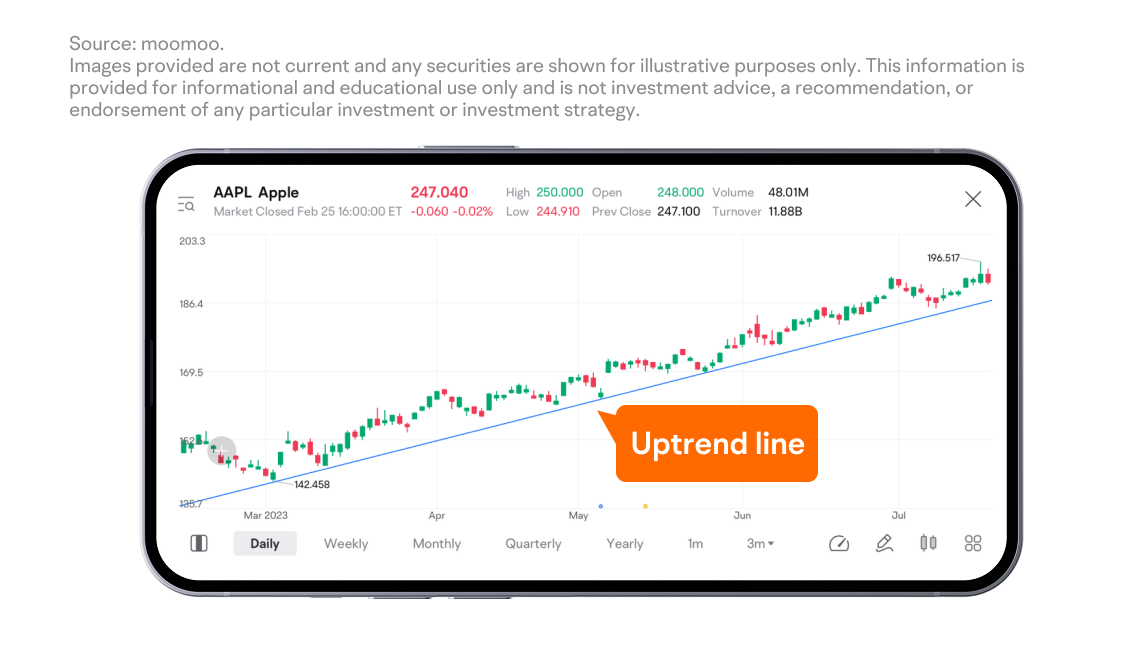
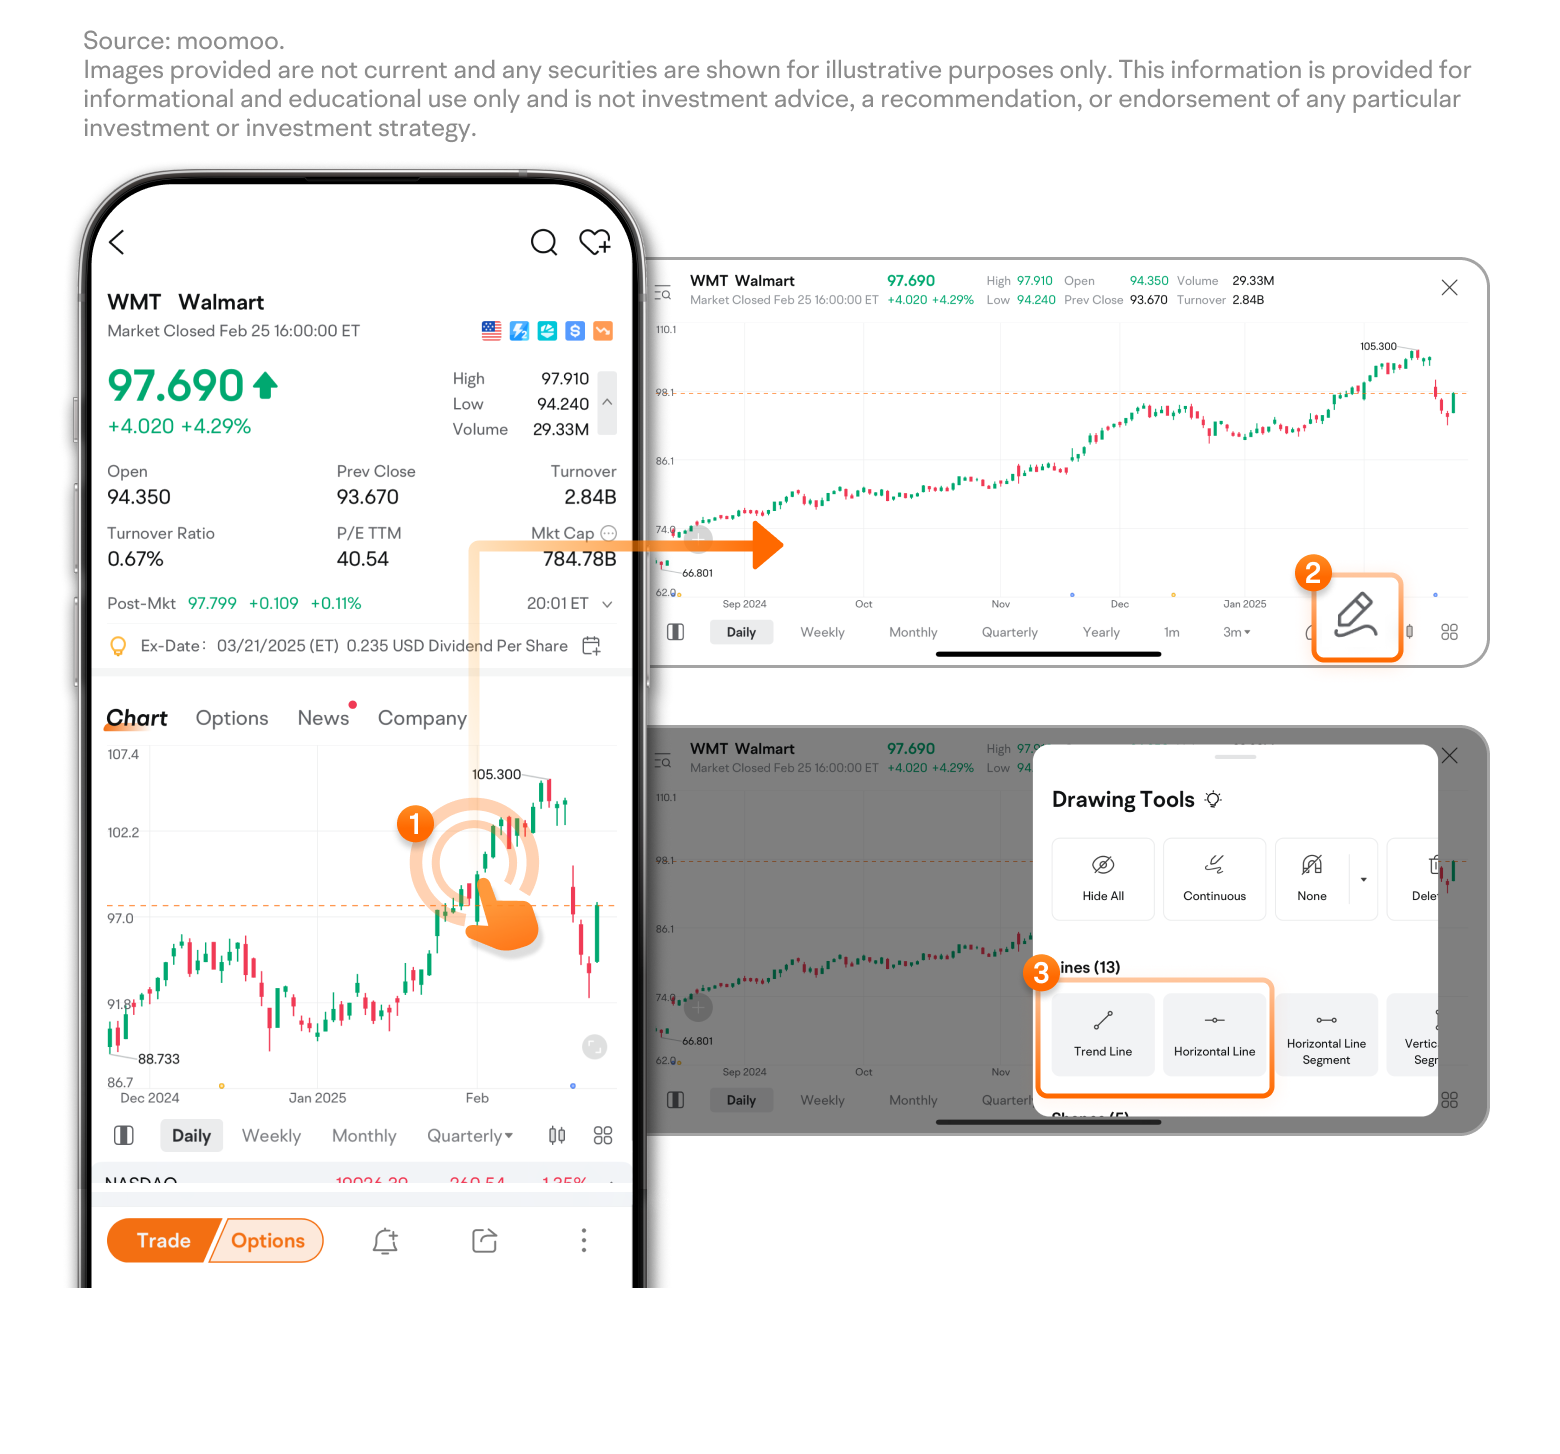
To try these tools on moomoo, follow these steps:
Double-tap the chart area on the Quotes page to enter full-screen mode> Tap the Drawing Tools button at the bottom right> Select a drawing tool> draw a line.
Support and resistance levels are dynamic and not fixed. A breakout beyond these levels can indicate a substantial shift in market direction. Support and resistance levels can switch roles. A broken support level may become resistance, and vice versa.
3. Using moving averages
Following recent trends is very important as they will often continue in the near future. Moving averages (MAs) offer a straightforward and effective method for trend analysis.
The MA connects average prices over a specific timeframe to create a curve that shows historical price trends. For instance, each point on the 20-day MA represents the average closing price over the preceding 20 trading days.
To see moving averages on moomoo, go to:
Quotes page> More button in the chart> Indicators> More > Trend > Moving Average > Tap the Settings button > Select MAs to display and adjust the time period > Tap Save.
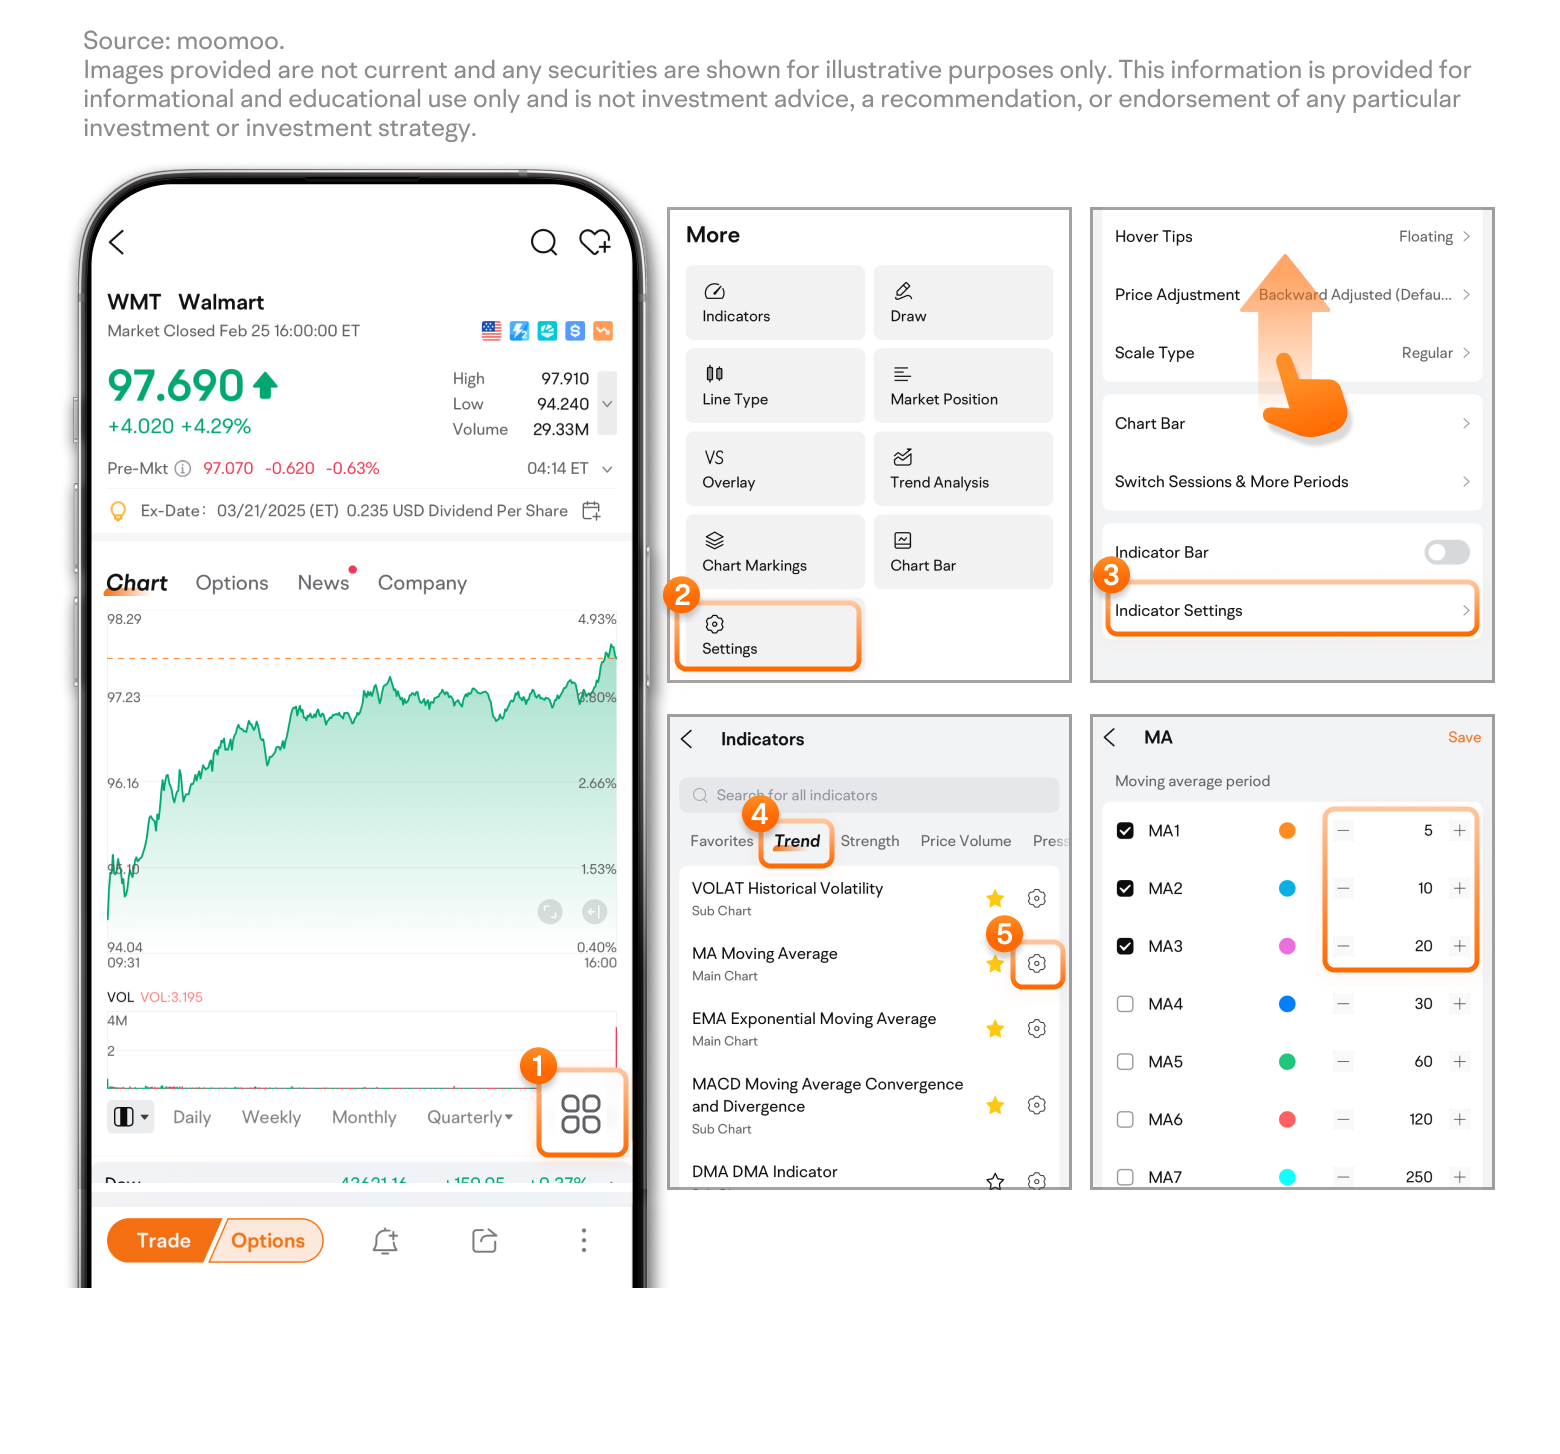
In general, it is advisable to set up at least three MAs with varying periods for analyzing short-term, medium-term, and long-term market trends, such as 20-day, 50-day, and 200-day MAs.
When using MAs, consider the following key points:
Market trend identification
Bullish Alignment: Shorter-term MAs above longer-term MAs, both trending upward, signal a strong uptrend.
Bearish Alignment: Shorter-term MAs below longer-term MAs, both moving downward, signal a strong downtrend.

The 200-day MA serves as a crucial threshold for assessing long-term market trends.
Evaluate potential support or resistance
Certain moving average periods, like the 50-day and 200-day MAs, are commonly viewed as potential support or resistance levels.
Longer-term MAs tend to be more significant as potential support or resistance levels. For example, the 200-day MA typically holds more significance than the 20-day MA.
When moving averages align with other potential support or resistance levels, their significance may be heightened.
Identify potential buy and sell signals
Golden Cross: When a short-term MA crosses above its long-term counterpart, some traders interpret this as potential bullish indicator.
Death Cross: When a short-term MA crosses below its long-term counterpart, some traders view it as potential bearish indicator.
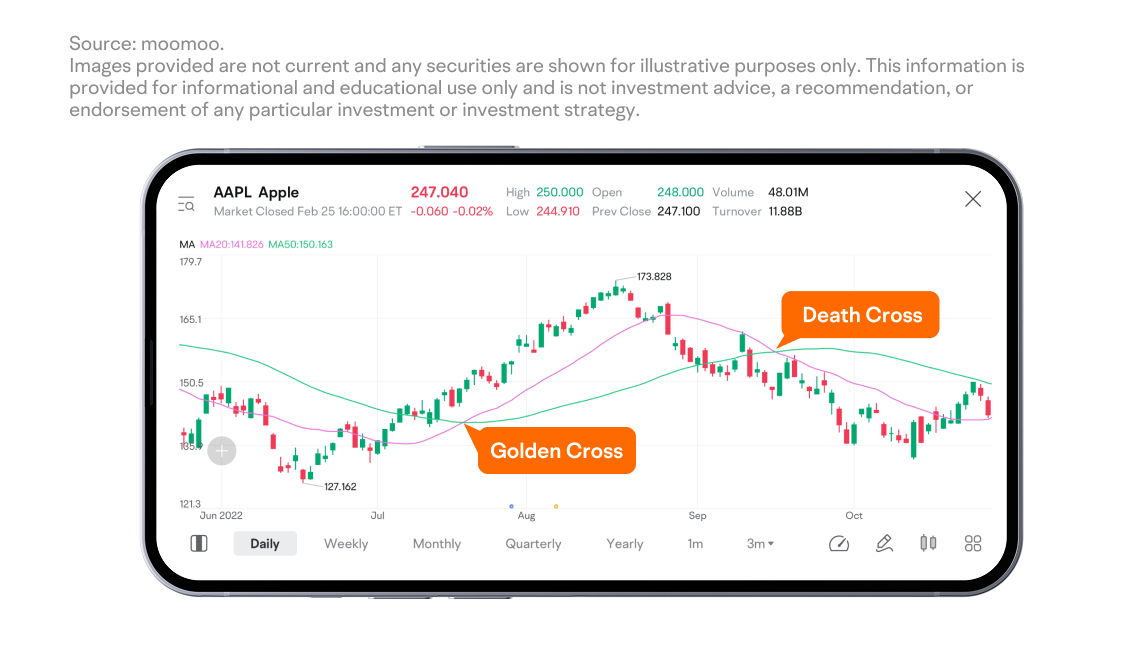
Alright, that's all for this lesson. We discussed three practical chart analysis techniques aimed at identifying potential trading signals.
It's important to recognize that market signals can be complex and occasionally misleading. Remember, good investing requires thorough analysis, not just signals. So stay tuned to keep learning together.
Disclosure:
This presentation discusses technical analysis, other approaches, including fundamental analysis, may offer very different views. The examples provided are for illustrative purposes only and are not intended to be reflective of the results you can expect to achieve. Moving Average (MA) is calculated by adding the closing price of a stock or other security over a specific period of time and dividing the total by the appropriate number of trading days.
All investing involves risk, including the potential loss of principal, and there can be no guarantee that any investing strategy will be successful.
This presentation is for informational and educational use only and is not a recommendation or endorsement of any particular investment or investment strategy. Investment information provided in this content is general in nature, strictly for illustrative purposes, and may not be appropriate for all investors. Read more