How Midterm Elections Affect the US Stock Market
Midterm elections can reach the U.S. stock market because they reset who can legislate for the next two years while the president remains in office. This guide covers what midterm elections determine, stock market performance in midterm election years, investing in an election year, and which sectors benefit from midterm elections once a policy path is known.
What Do Midterm Elections Determine?
What do midterm elections determine? The full House, about one-third of the Senate, and a wide set of state offices — and, with them, which bills, budgets, and nominations are realistic for the rest of the term.
On November 3, 2026, all 435 voting House seats and 35 Senate seats are up — 33 Class II seats plus special elections for terms previously held by Marco Rubio in Florida and J.D. Vance in Ohio — along with governorships in 36 states. Terms begin January 3, 2027, after a lame-duck session under the outgoing majority.
For stocks, the result changes the scope of taxes, spending, regulation, and confirmations. Earnings, rates, and growth stay beside the chamber call.
Stock Market Performance in Midterm Election Years
Stock market performance in midterm election years is usually set against the four-year presidential cycle. Year two, the midterm year, has often shown a softer average S&P 500 calendar-year price result than year three, the pre-election year after the vote.
The average moves with the sample. Studies starting in the 1930s, around 1950, or in the late 1960s put the midterm calendar year from roughly flat to the mid-single digits, and often put the following year in the mid-teens. Intra-year drops in midterm years have often run deeper, on the order of the mid-teens from peak to trough.
Single years break the average. The S&P 500 fell about 19% in price terms in the 2022 midterm year; other midterm years closed higher. Some studies find the 12 months after Election Day positive over a long modern streak, and those windows still contained sharp selloffs. The record describes the past. 2026 is a new sample.
How to Invest in an Election Year
Investing in an election year, in everyday search language, usually means the presidential year, when the White House and Congress are both on the ballot. A midterm year is the halfway mark: the president stays, and Congress is refreshed. Both dates can reprice policy odds quickly, including while the cash session is closed.
An election-night headline and a bill in the next Congress are different holding periods. Size built for a quiet tape meets a harder test when intra-year swings run deeper, and a broad index can move on a different clock from one policy-sensitive stock.
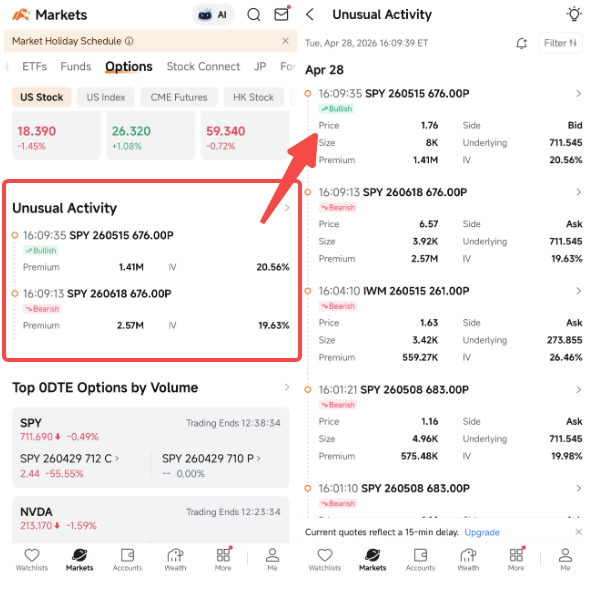
Positioning often shows up before the cash price finishes the story. On moomoo, Unusual Options Activity tracksOptionss trades of 1,000 contracts or more — Quotes, then Options, then Unusual Activity for one name, or Markets, then Options, for the wider tape. A print may target an expiration, hedge the underlying, or form one leg of a spread. Options involve substantial risk. Short Sale Analysis, under a symbol's chart, places daily short volume beside short interest and days to cover. U.S. short interest is generally biweekly, so it lags the session; Short Sale Rankings can show where short volume looks unusual. Crowding is a fact about the tape. The result and liquidity still shape the next price.
Which Sectors Benefit from Midterm Elections?
Which sectors benefit from midterm elections? The useful list is a research list: healthcare, energy, financials, industrials and defense, and technology tied to regulation, subsidies, or export rules. A bill, a committee chair, or an agency can change the rules around revenue in those groups. Any benefit shows up in price after the policy path is known, beside earnings and rates.
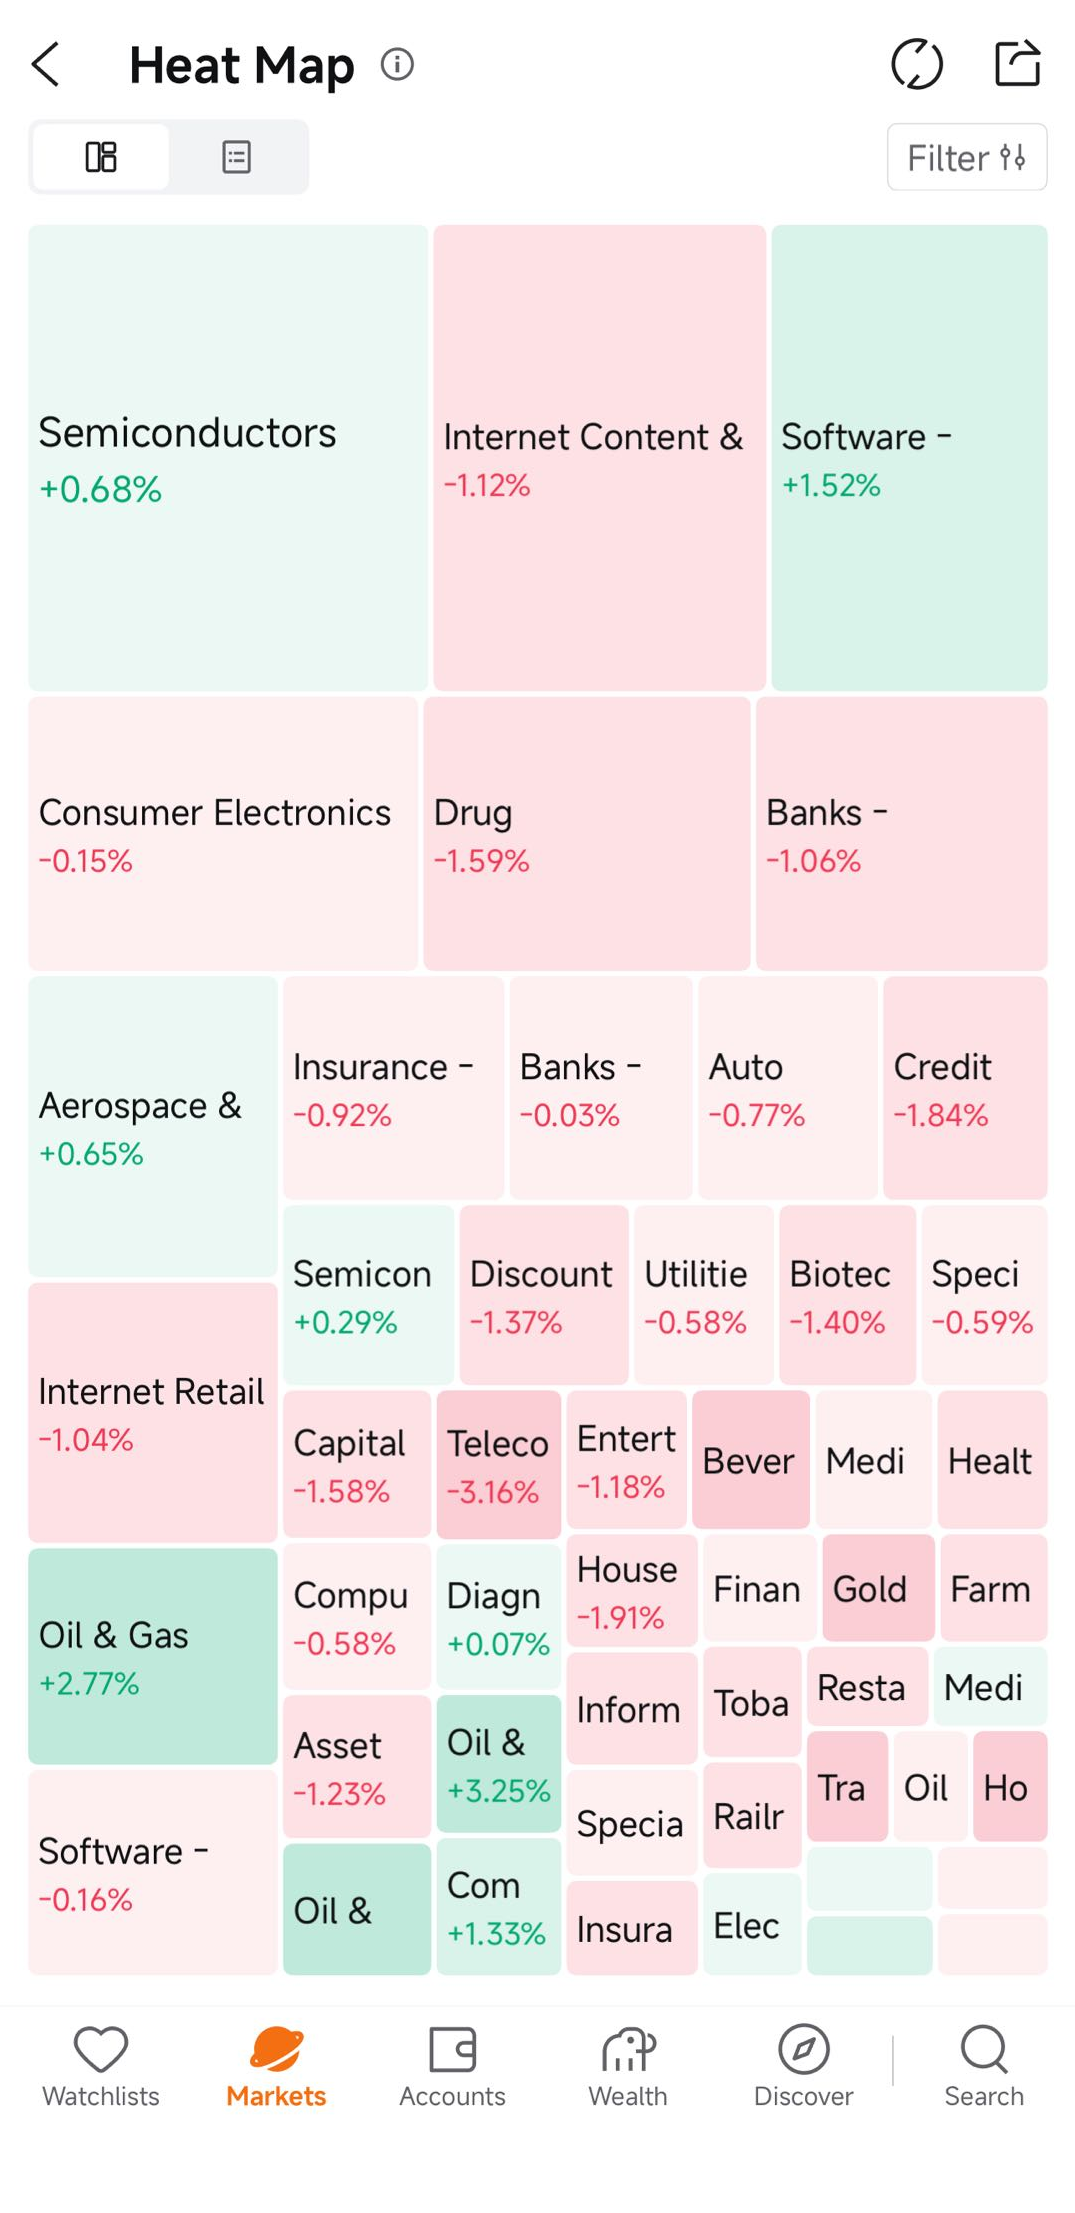
On moomoo, Heat Map is at Markets> Explore > Heat Map, also reached from the U.S. market page. Block size can reflect market cap, volume, or turnover. Color reflects percent change across windows from the session toward a year, so election week and the longer trend can be compared. Tap a sector for its stock list.
Sector exposure often trades in ETFs. Under Markets> ETFs, the U.S. section includes an ETF Heatmap grouped by asset class, sector, and region. Tap a sector block for that group's ETF list. Index ETFs sit in the same area and help separate a market-wide move from a sector move. Large healthcare, energy, or financial sector ETFs illustrate how the list is organized.
A bright block still needs a cause. The same sector can move on a race call, a map ruling, or an earnings print. Comparing the session window with a longer one shows whether election week changed the trend or only the day.
From Election Night to the New Congress
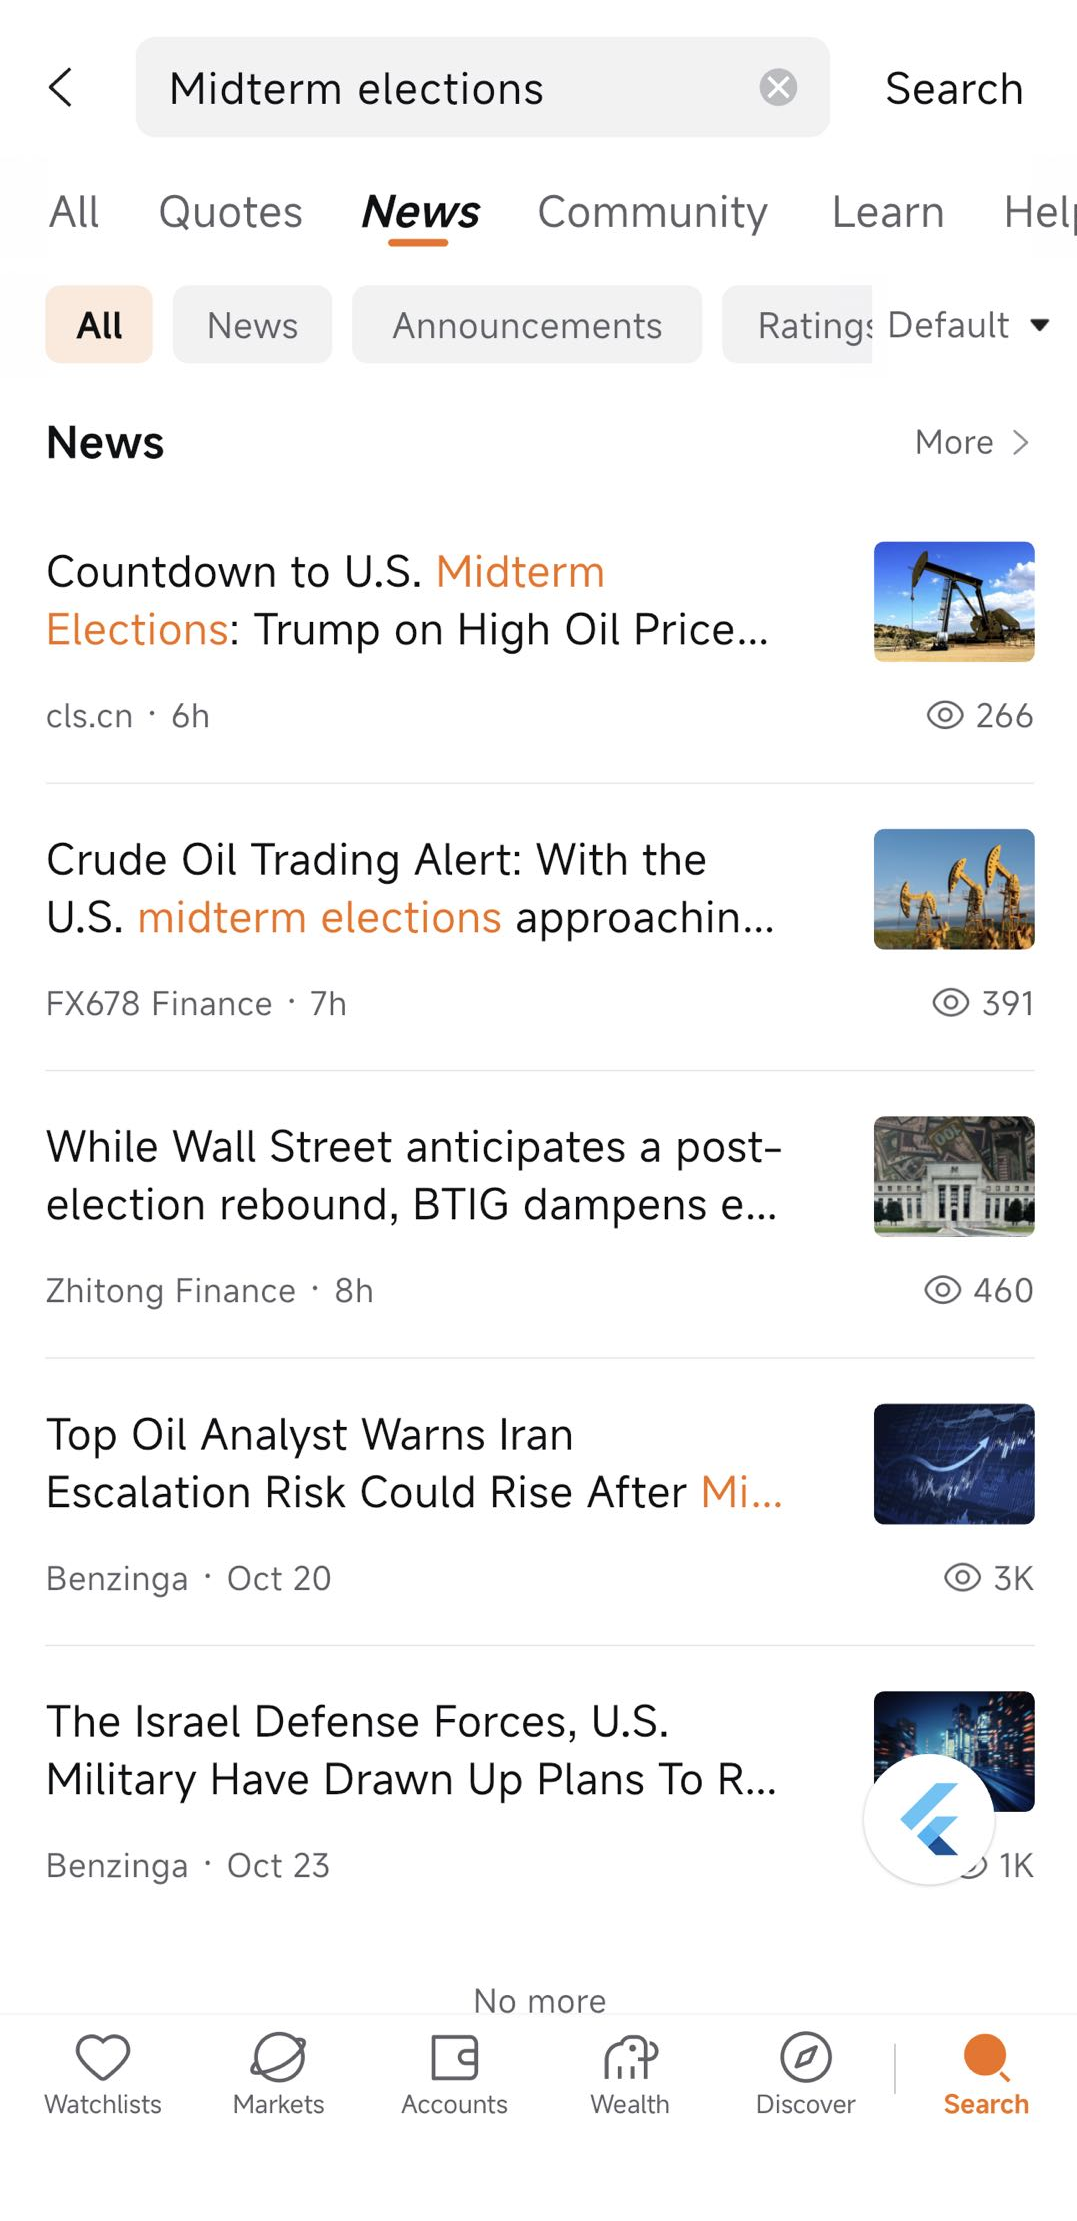
Calls, concessions, and legal challenges can post while the cash session is closed. Futures and the next pre-market are often the first prices to reflect them. moomoo's News tab carries 24/7 headlines from sources such as Bloomberg, Dow Jones, and Reuters, and a stock or ETF quote shows related headlines beside the price, so a chamber call can be read next to the name that might actually be exposed.
The calendar then splits. Election night produces a result. January 3, 2027 seats the 120th Congress. A lame-duck session in between can still legislate under the outgoing majority, so stocks can trade "who won" and "what can pass before January" as two paths.
Sector prices, listed options, and short interest do not share the headline's clock. A sector map can recolor the same day, options prints appear as they trade, and short interest generally arrives every two weeks. A loud result with quiet positioning is a common stretch in that window, and it is one way midterm elections show up in the market.
FAQ About Midterms and the Stock Market
What do midterm elections determine?
Control of the House, part of the Senate — 35 seats in 2026 — and many state offices, including governorships in 36 states. The president remains in office. New congressional terms begin January 3, 2027, after a possible lame-duck session.
What has stock market performance in midterm election years looked like?
Published S&P 500 averages for the midterm calendar year run from roughly flat to the mid-single digits, with the next year often stronger on average and with deeper intra-year drawdowns. 2022 finished down about 19%. Averages describe the past.
Which sectors benefit from midterm elections?
Research often focuses on healthcare, energy, financials, industrials and defense, and policy-exposed technology, where legislation can change revenue rules. A heat map and sector-ETF list show which groups are moving. Price after the policy path is known is what confirms a benefit.
How is investing in an election year different in a midterm year?
A presidential year includes the White House. A midterm year leaves the president in place and refreshes Congress. Both can reprice policy odds in a single night. Holding period and the gap between a sector and a single stock still belong in the research frame.
This presentation is for informational and educational use only and is not a recommendation or endorsement of any particular investment or investment strategy. Investment information provided in this content is general in nature, strictly for illustrative purposes, and may not be appropriate for all investors. Read more