Netflix
NFLX
Micron Technology
MU
Cisco
CSCO
4
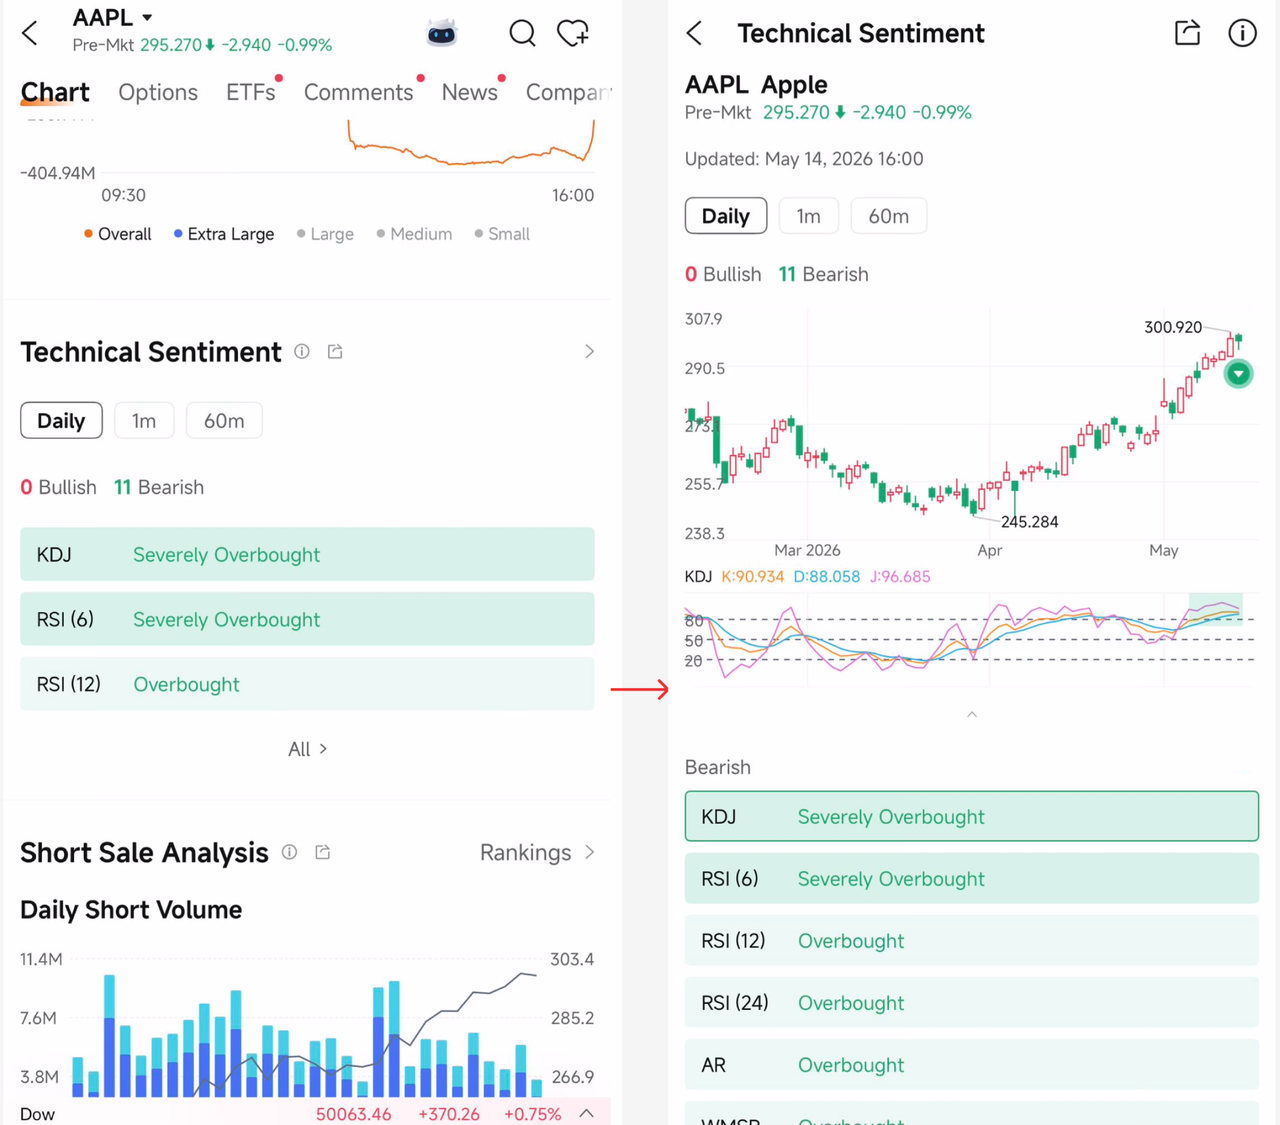
Apple
AAPL
5
Broadcom
AVGO
Stock Quote Details - Chart - Indicator Interpretation
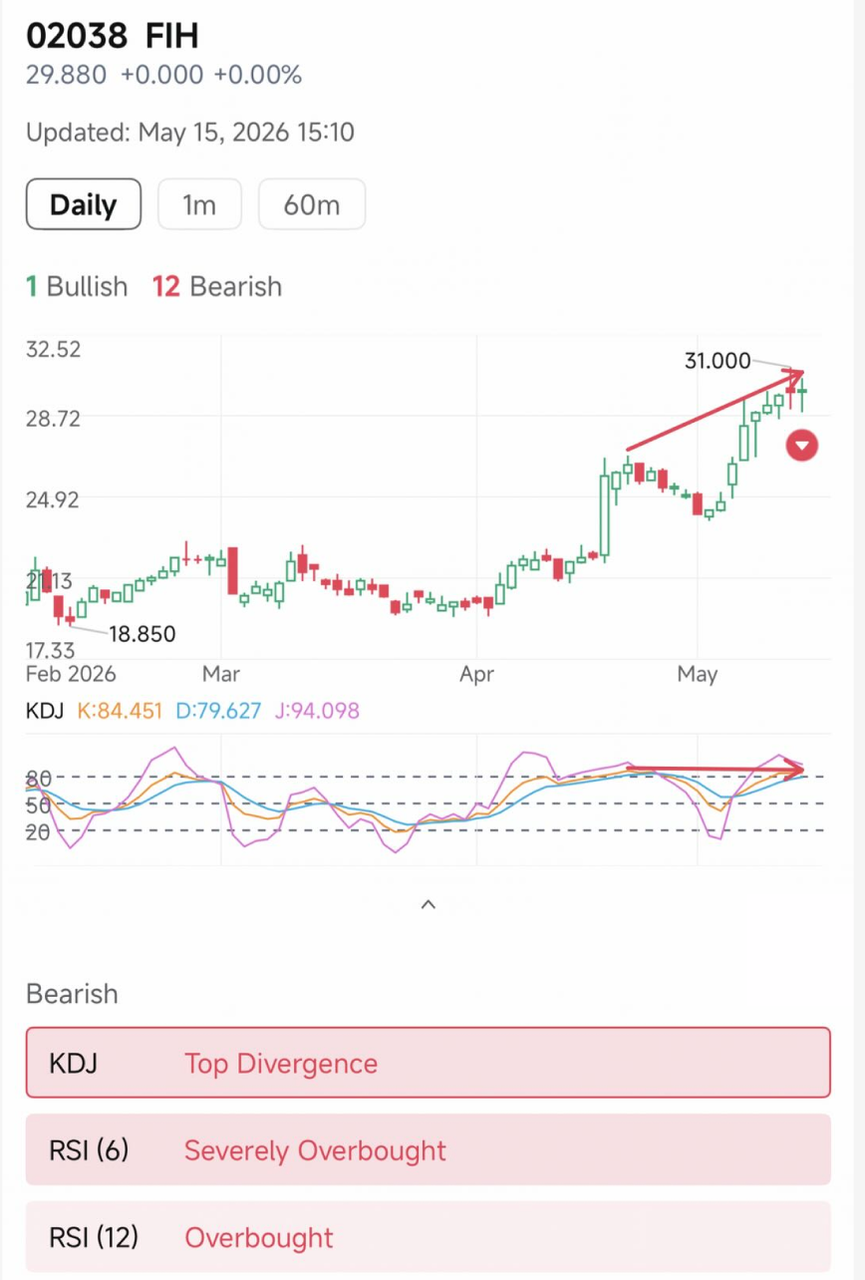
"Arrows" MACD top/bottom divergence, KDJ top/bottom divergence → Double-line arrows mark the two peaks/troughs
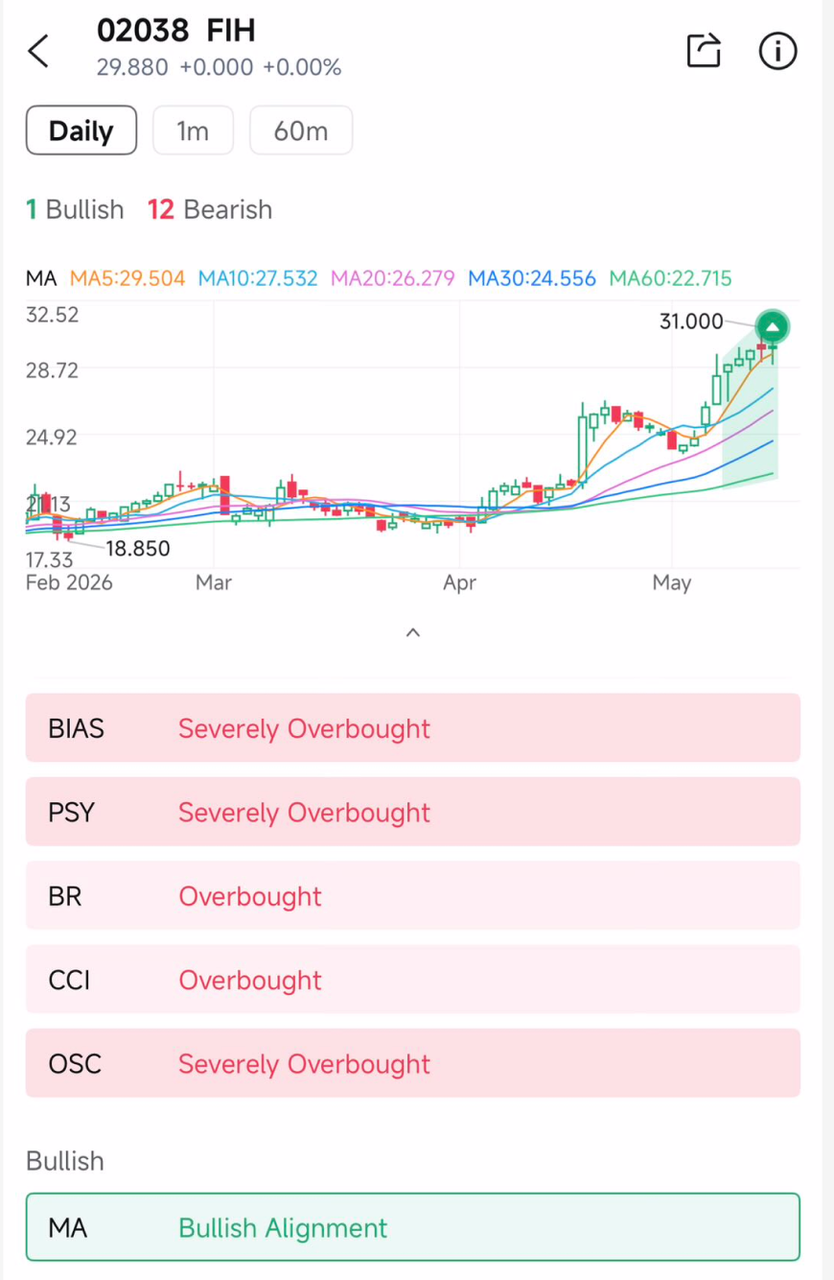
"Main Chart Box" BOLL price crossing above/below upper, lower, or middle band; MA bullish/bearish K-line alignment
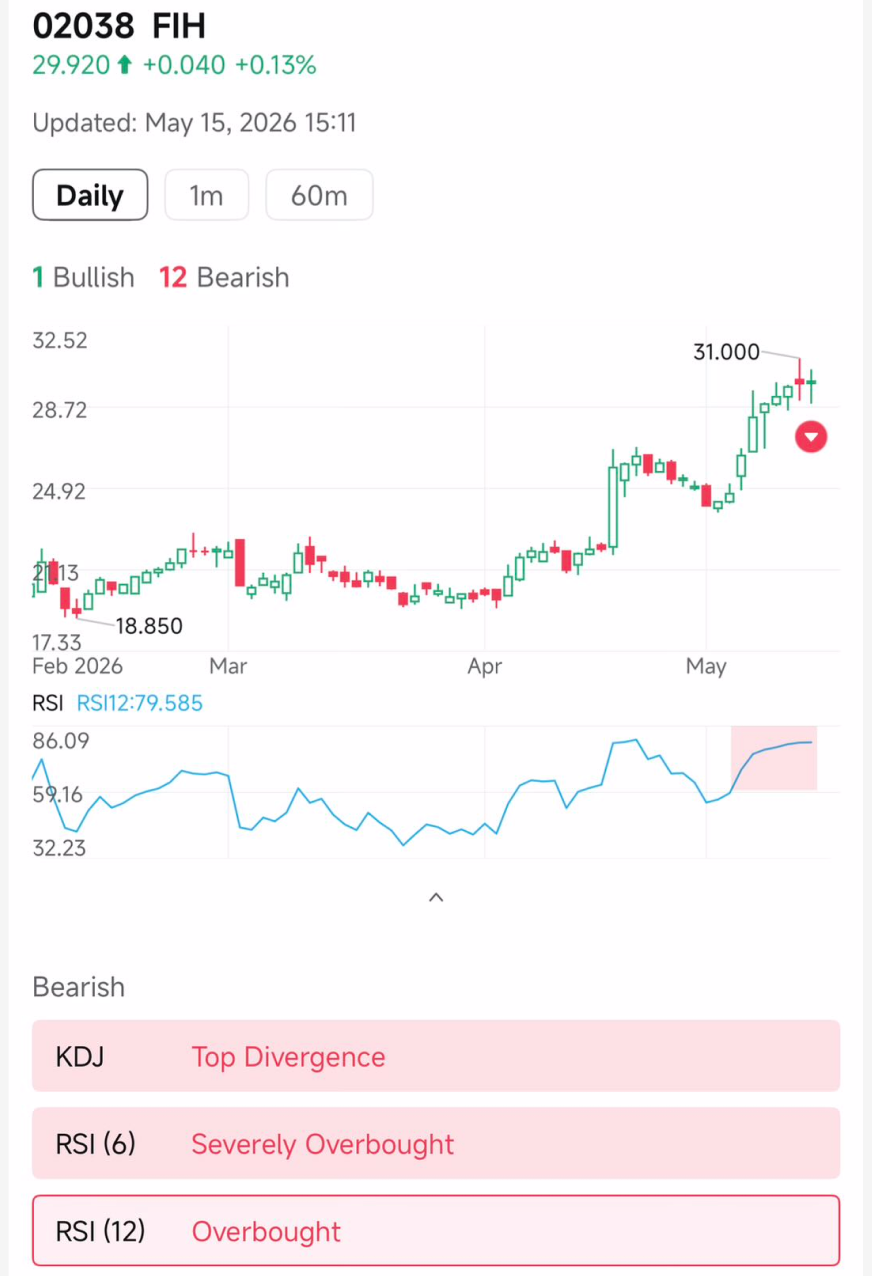
"Sub Chart Box" MACD golden cross/death cross, KDJ high-level death cross/low-level golden cross, overbought/oversold indicators such as RSI / KDJ / CCI
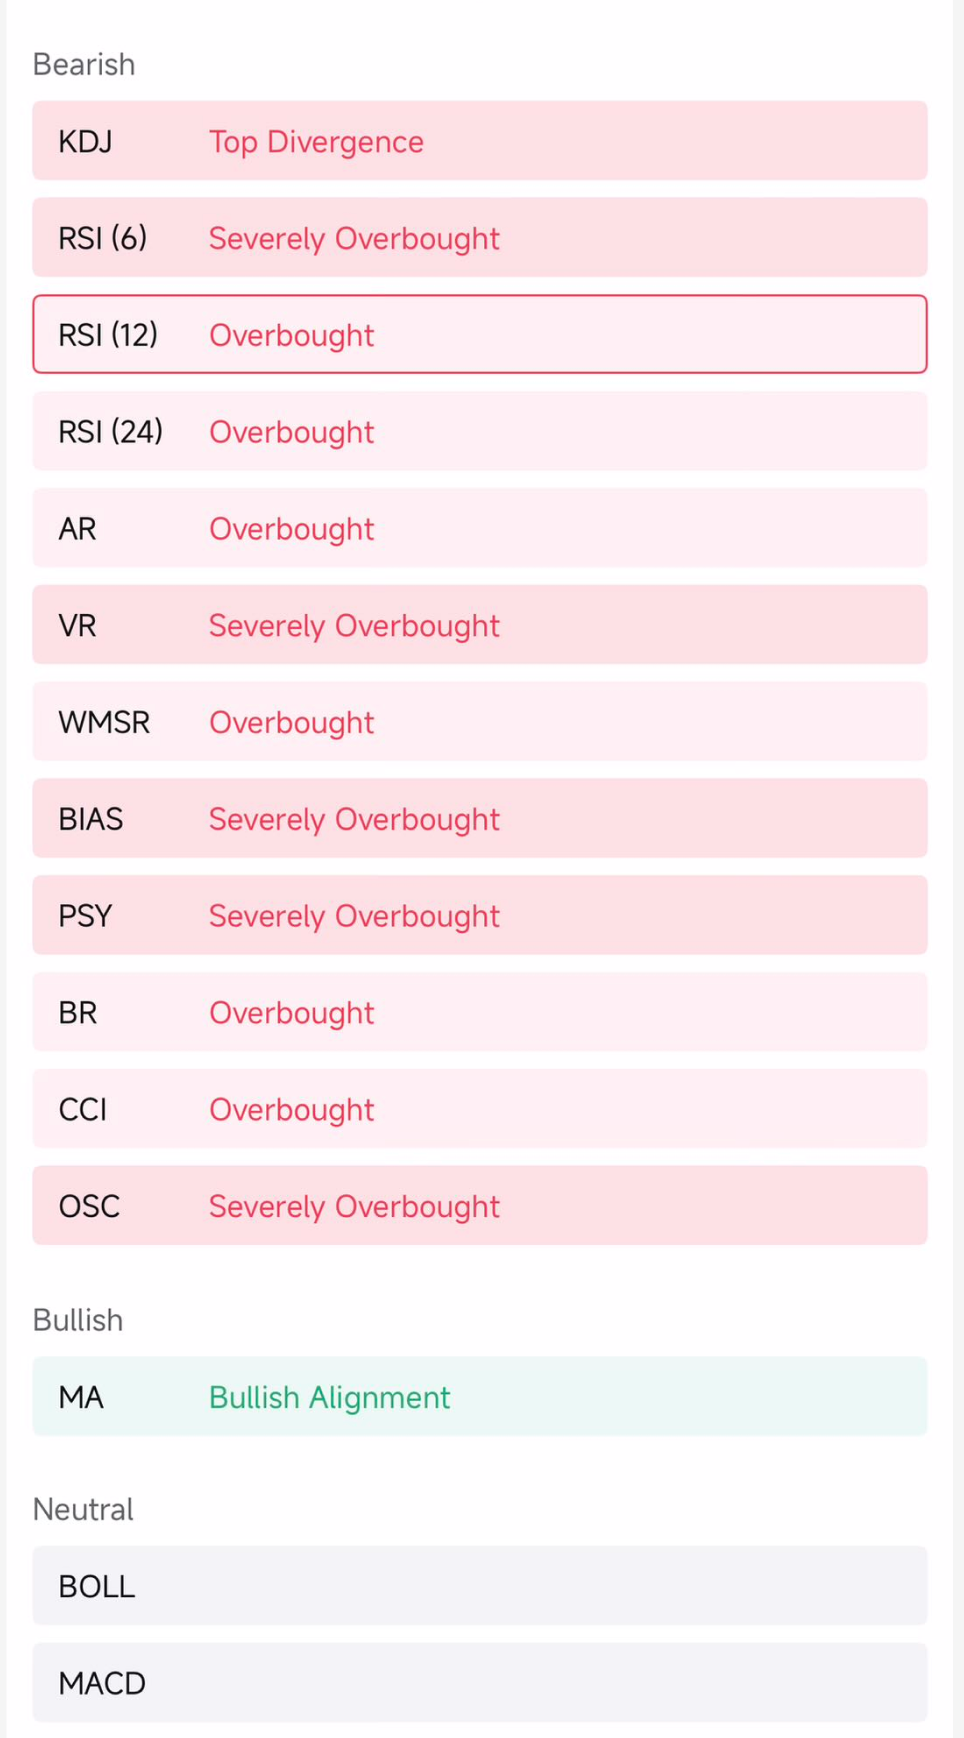
Pattern Type (4): MACD (golden cross/death cross/top-bottom divergence), KDJ (high-level death cross/low-level golden cross/top-bottom divergence), BOLL (cross above/below signal), MA (bullish/bearish alignment)
Numerical Type (11): OSC, AR, VR, RSI(6/12/24), WMSR, CCI, BIAS, BR, PSY — overbought/oversold signals calculated via threshold values
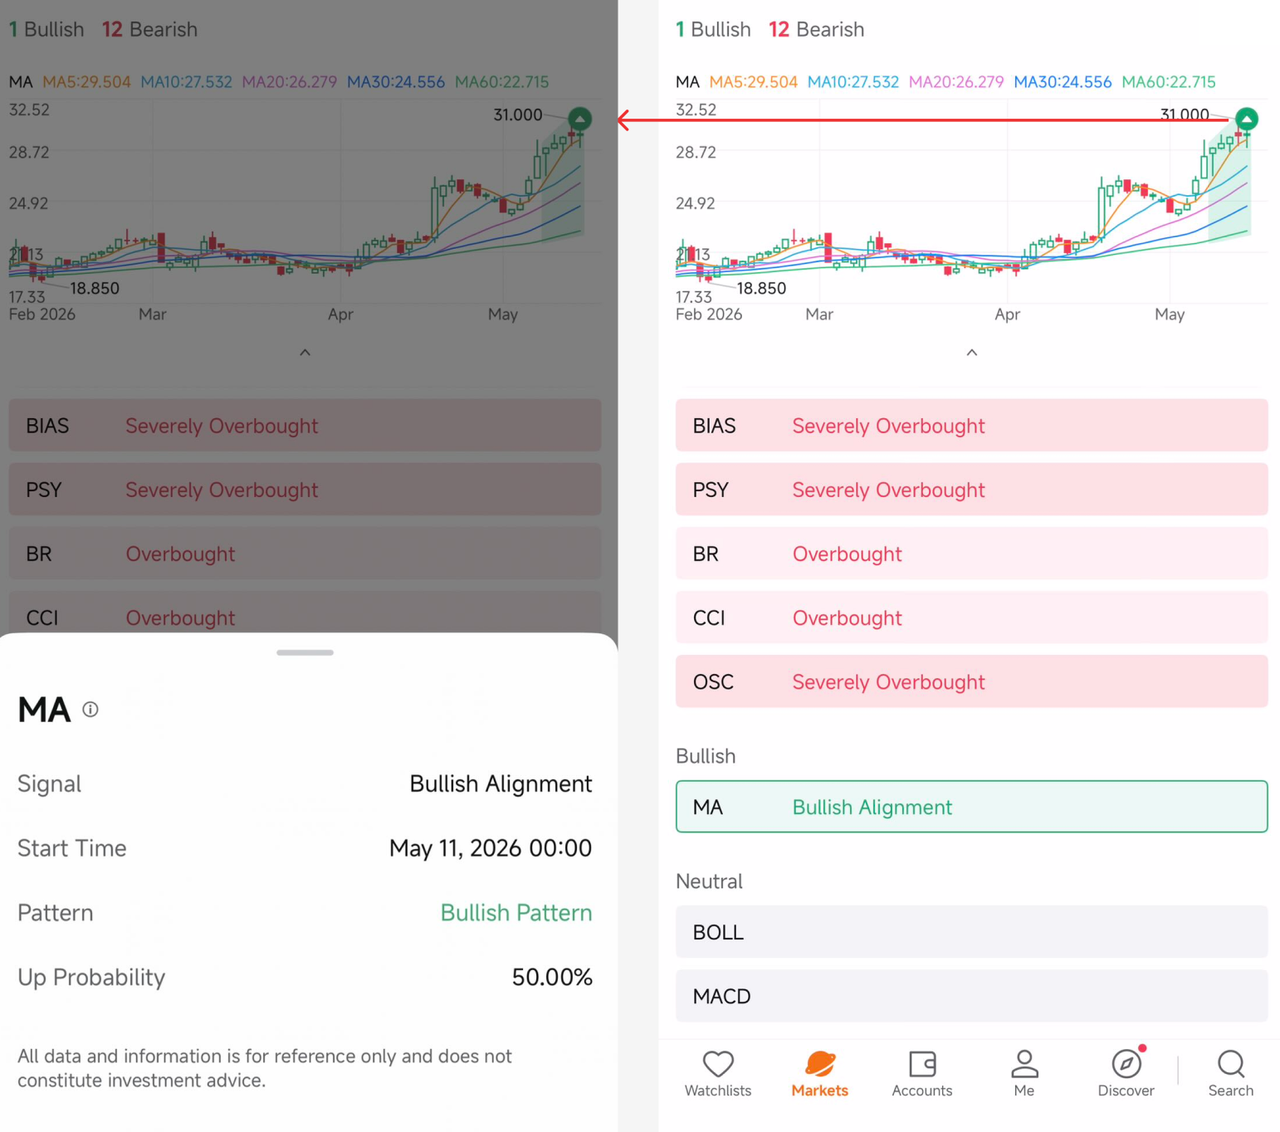
Click the arrow to open the details popup (indicator, pattern name, start time, pattern type, rise probability, disclaimer)
Rise Probability: The rise probability calculated based on the historical occurrences of the currently selected indicator
Risk Disclosure This presentation is for informational and educational use only and is not a recommendation or endorsement of any particular investment or investment strategy. Investment information provided in this content is general in nature, strictly for illustrative purposes, and may not be appropriate for all investors. It is provided without respect to individual investors’ financial sophistication, financial situation, investment objectives, investing time horizon, or risk tolerance. You should consider the appropriateness of this information having regard to your relevant personal circumstances before making any investment decisions. Past investment performance does not indicate or guarantee future success. Returns will vary, and all investments carry risks, including loss of principal. Moomoo makes no representation or warranty as to its adequacy, completeness, accuracy or timeliness for any particular purpose of the above content.