Identify Institutional Investor Moves with moomoo
Institutional investor represents some of the most influential investors in the market.
Identifying their moves can help provide valuable insights into market trends.
Today, we will explore two useful tools on moomoo - Trade Overview and Capital Trend - and how they can help investors make more informed decisions.
Open moomoo and tap on a stock, say AAPL, to enter its detailed quotes page.
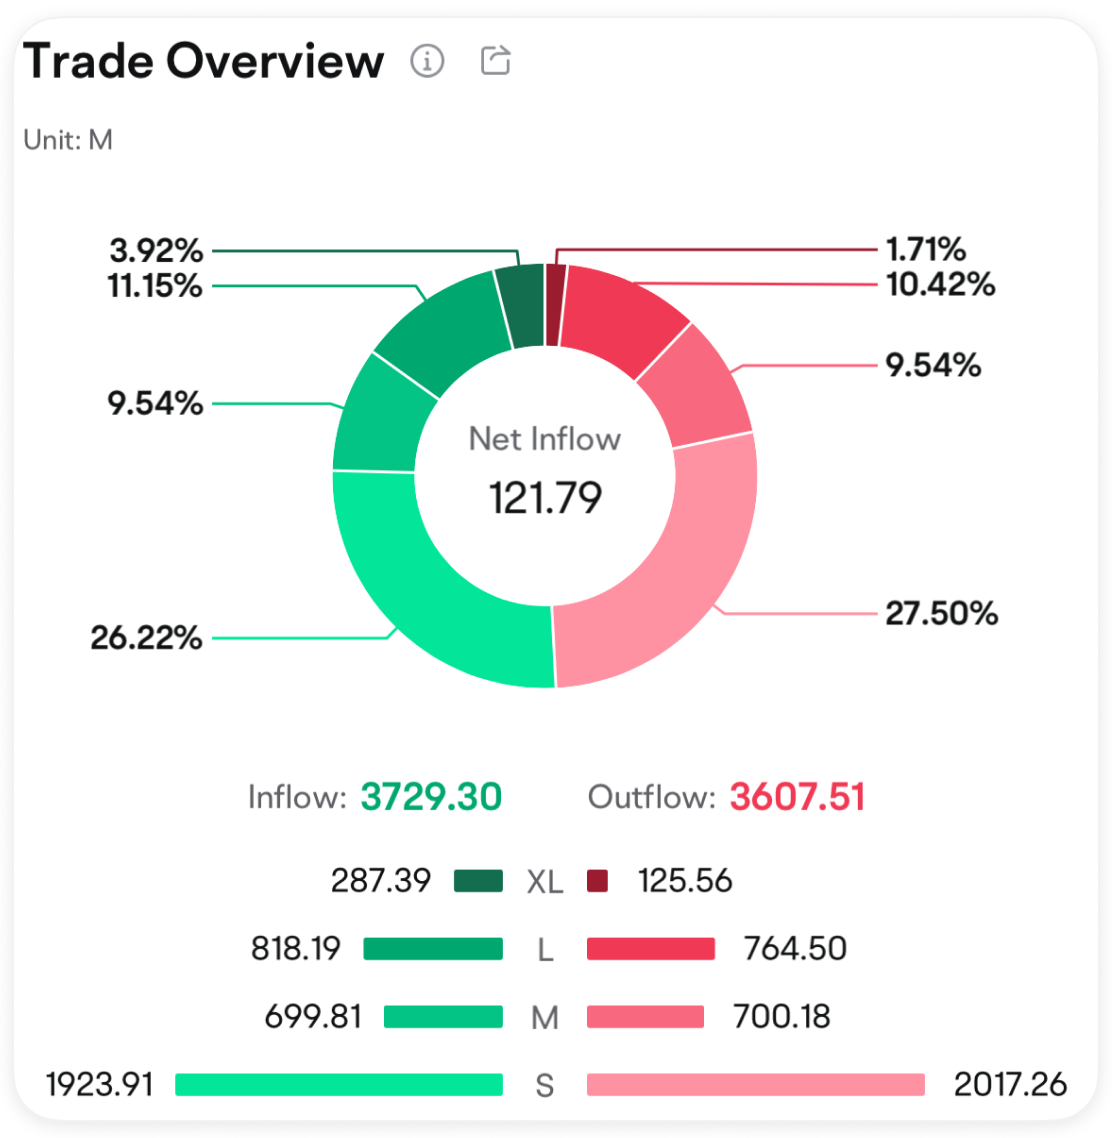
Scroll down and you'll see Trade Overview.
Here, you'll find a pie chart displaying capital sizes.
If the current capital inflow exceeds the outflow, "Net Inflow" will appear in the center of the chart. Conversely, "Net Outflow" will be displayed if capital outflow surpasses inflow.

Color shades are used to represent the relative size of orders.
The lighter the shade, the smaller the order, while the darker the shade, the bigger the order.
The bar chart below shows the amounts of different order sizes.
Orders placed over the past 200 trading days are sorted by transaction amount in descending order.
The top 10% and 10-30% orders are considered extra-large and large orders, respectively, while the 30-55% and the remaining 45% are medium and small orders.
Generally, we take the top 40% of orders, or block orders, as the ones placed by "institutional investors."
By analyzing the data in both charts, we can gain insights into the potential impact institutional investors may have on the stock price.
To view the real-time capital movements, scroll down to Capital Trend.
This feature visualizes intraday, daily, weekly, and monthly capital trends for different-sized orders, helping you grasp the overall capital flow and the movements of institutional investors.
To view specific data, long-press on the line chart.
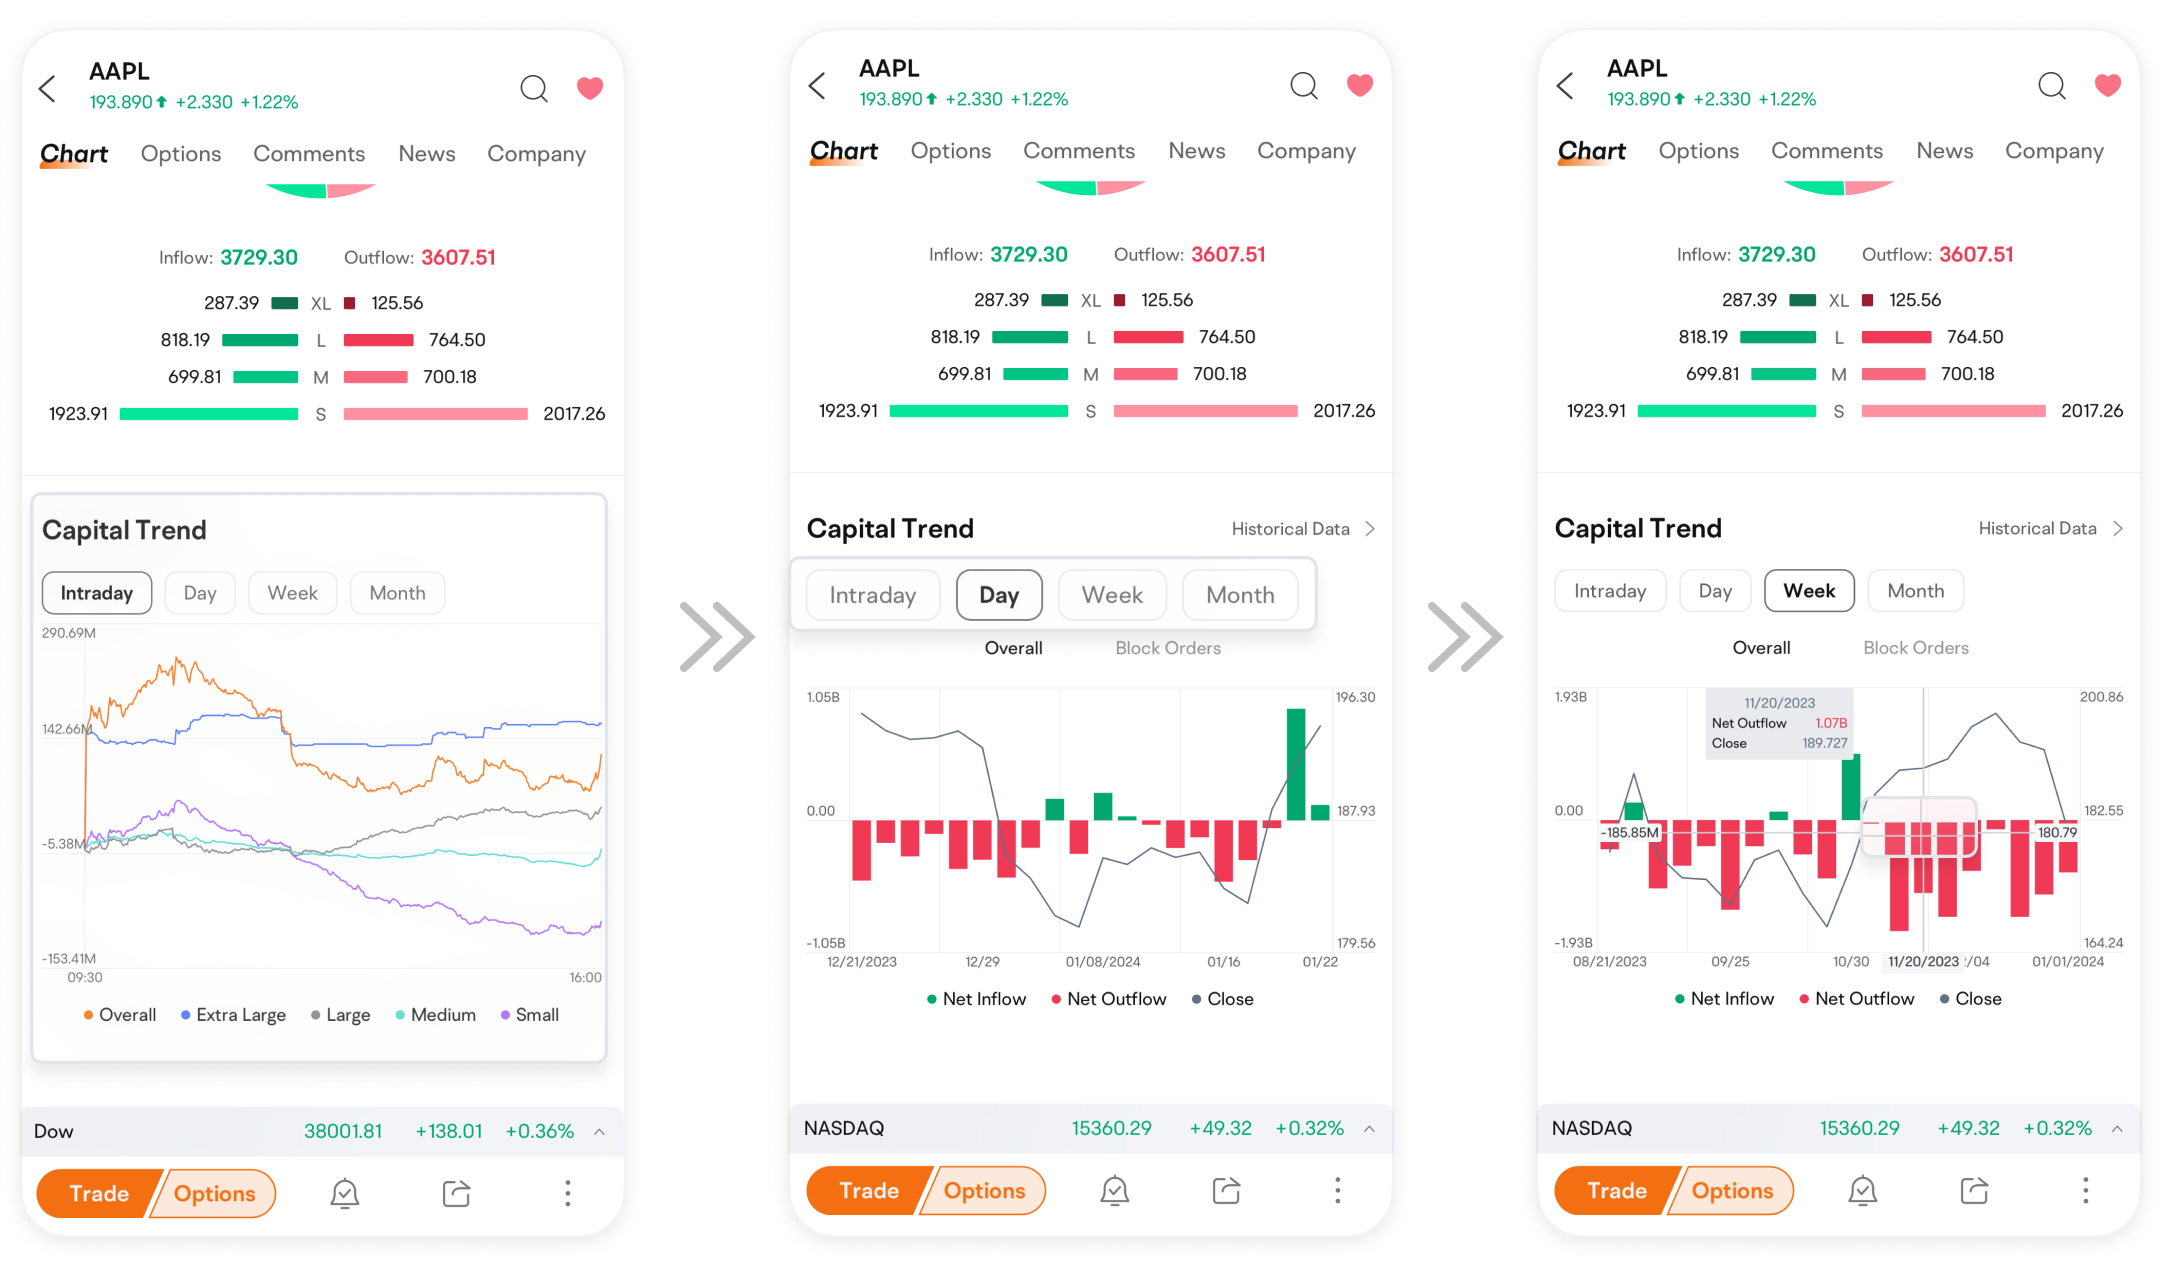
We can analyze how capital flows can impact stock prices in four different scenarios:
Scenario 1:
The share price rises on capital inflow. The number of sell orders declines while the number of buy orders rises as capital flows in, driving the stock price higher.
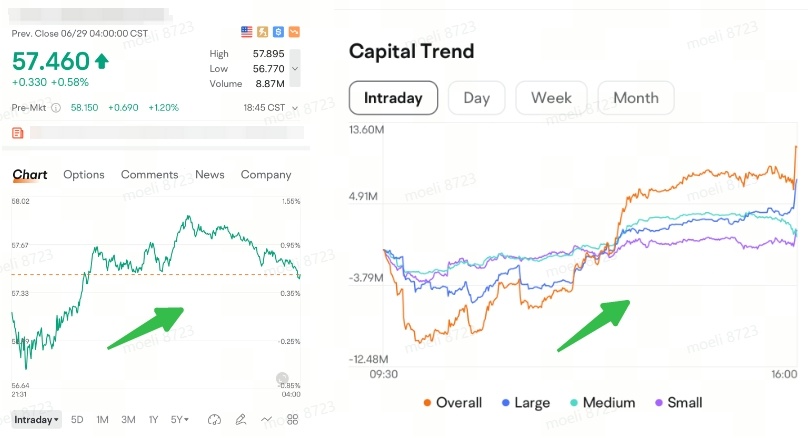
Scenario 2
The share price rises as capital flows out, indicating institutional investors might be exiting or short positions are being built.
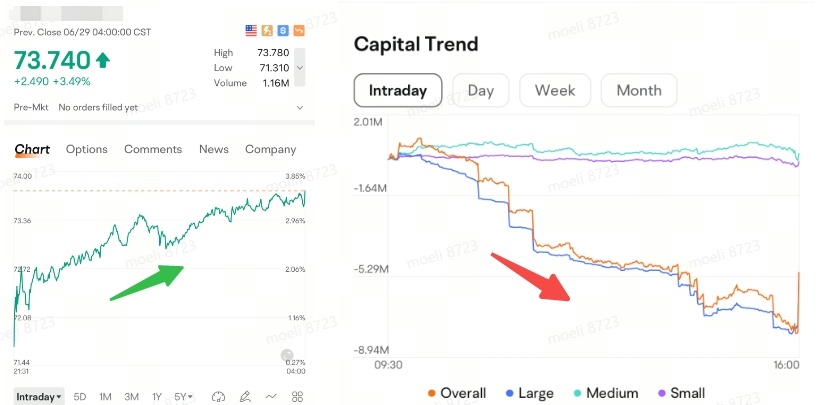
Scenario 3
The share price falls on capital outflow. The number of buy orders declines with less sell orders as capital flows out, pushing the stock price lower.
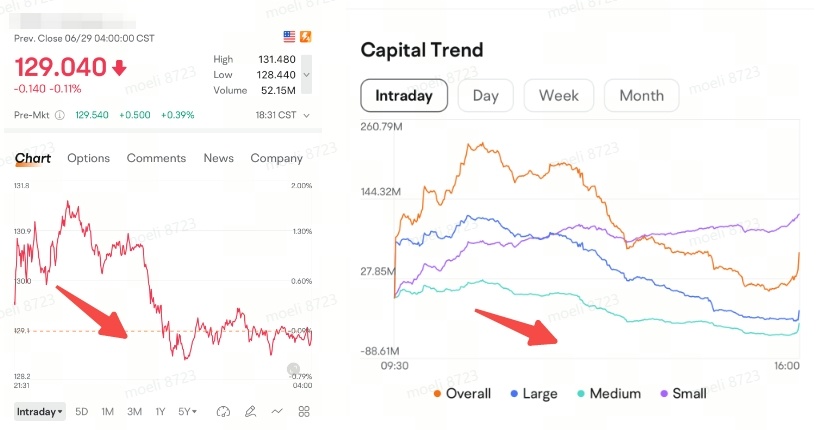
Scenario 4
The share price falls with capital flowing in, suggesting new positions are being opened or short sellers are closing their positions.
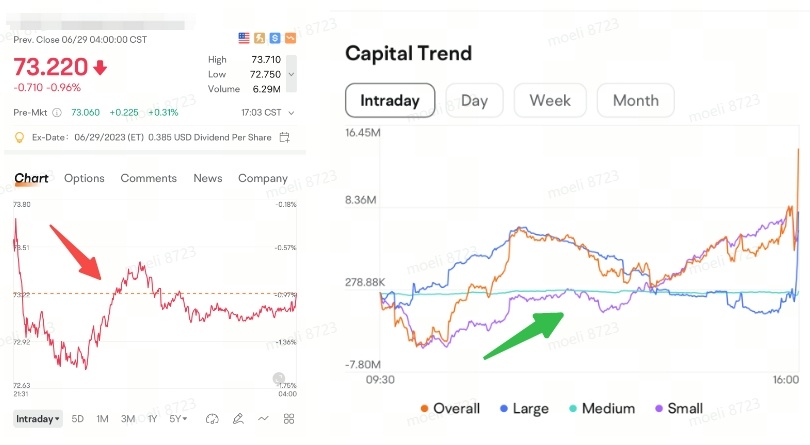
Short-term capital trends can be affected by certain events.
So sometimes, long-term capital trends might be more informative.
You can tap on "Historical Data" in the upper right corner of any chart to view 200-day data for capital flows.

Capital flows are considered leading indicators of market movements and sentiment.
However, we should always consider other factors as well when analyzing trends and not solely rely on capital flows when making trading decisions.
 Understanding the potential influence of institutional investors on stock prices, as well as capital flows as a key indicator of market trends, can aid investors in making wiser decisions. Tap Below for a quick experience of the Trade Overview and Capital Trend tool!
This presentation is for informational and educational use only and is not a recommendation or endorsement of any particular investment or investment strategy. Investment information provided in this content is general in nature, strictly for illustrative purposes, and may not be appropriate for all investors. Read more
Recommend

How to Evaluate ETFs? Handy Tools Can Help you

How to Open Your Account on moomoo

Getting Started with Margin Trading: A Practical Guide

How to invest in HK stocks on moomoo
How to Subscribe Cash Plus on moomoo
How to Use Malaysia Market Capital Flow
Trend Projection: Your Smart Investment Assistant
Visualised Financial Data: Shortcut to Know a Company's Fundamentals
How to Deposit to moomoo
How to Trade US Fractional Shares
How to Place a Basic Order?
How to Trade Futures on moomoo
How to Subscribe Malaysia IPO on moomoo
What are Daily Leverage Certificates
How to Step Up Your Trading with Order Types
Moomoo AI:Invest Forward and Easier
How to Use SmartSave
Identify Institutional Investor Moves with moomoo
How to Use Drawing Tools on moomoo
What is Technical Indicator Sentiment feature
Make Smarter Investment Decisions with Analyst Ratings
Spot High Dividend Stocks with Featured Lists
How to Use AI Market Monitor on moomoo
Seize Potential Trading Opportunities with Price Alerts
How to Trade 0DTE Options on moomoo
How to Draw Trend Lines
How to Use Date/Price Range
How to trade Covered Call on moomoo
How to Identify Candlestick Patterns
How to Use Technical Indicators on moomoo
How to Use MA in Real Trading
How to Use Fibonacci Retracement Levels
Short-term Trading: One Click to Catch the Top Gainers
Heat Map: Visualizing Current Market Opportunities
Shariah Screener in One Click
Industry Chain to Find Hidden Opportunities in Hot Industries
How to Use MACD in Real Trading
How to Evaluate ETFs? Handy Tools Can Help you
How to Open Your Account on moomoo
Getting Started with Margin Trading: A Practical Guide
How to invest in HK stocks on moomoo
How to Subscribe Cash Plus on moomoo
How to Use Malaysia Market Capital Flow
Trend Projection: Your Smart Investment Assistant
Visualised Financial Data: Shortcut to Know a Company's Fundamentals
How to Deposit to moomoo
How to Trade US Fractional Shares
How to Place a Basic Order?
How to Trade Futures on moomoo
How to Subscribe Malaysia IPO on moomoo
What are Daily Leverage Certificates
How to Step Up Your Trading with Order Types
Moomoo AI:Invest Forward and Easier
How to Use SmartSave
Identify Institutional Investor Moves with moomoo
How to Use Drawing Tools on moomoo
What is Technical Indicator Sentiment feature
Make Smarter Investment Decisions with Analyst Ratings
Spot High Dividend Stocks with Featured Lists
How to Use AI Market Monitor on moomoo
Seize Potential Trading Opportunities with Price Alerts
How to Trade 0DTE Options on moomoo
How to Draw Trend Lines
How to Use Date/Price Range
How to trade Covered Call on moomoo
How to Identify Candlestick Patterns
How to Use Technical Indicators on moomoo
How to Use MA in Real Trading
How to Use Fibonacci Retracement Levels
Short-term Trading: One Click to Catch the Top Gainers
Heat Map: Visualizing Current Market Opportunities
Shariah Screener in One Click
Industry Chain to Find Hidden Opportunities in Hot Industries
How to Use MACD in Real Trading