How to Use Malaysia Market Capital Flow
Capital flow is a crucial indicator in stock investing, reflecting investor behavior and signaling future price trends. Its accurate assessment is vital for analyzing market trends and strategizing individual stock trades.
Below, we'll walk you through a handy tool on Moomoo: the Malaysia Market Capital Flow feature, which visually presents the movements of retail investors, as well as institutional and foreign investors—the main market movers in the Malaysian market.
How to find it
Before you start, please remember to update the app to the latest version.
Path1: Markets > MY > Swipe up to find Capital Flow.

Path2: Search for "KLCI Index" > Quotes page > Capital Flow.

Master It with Ease
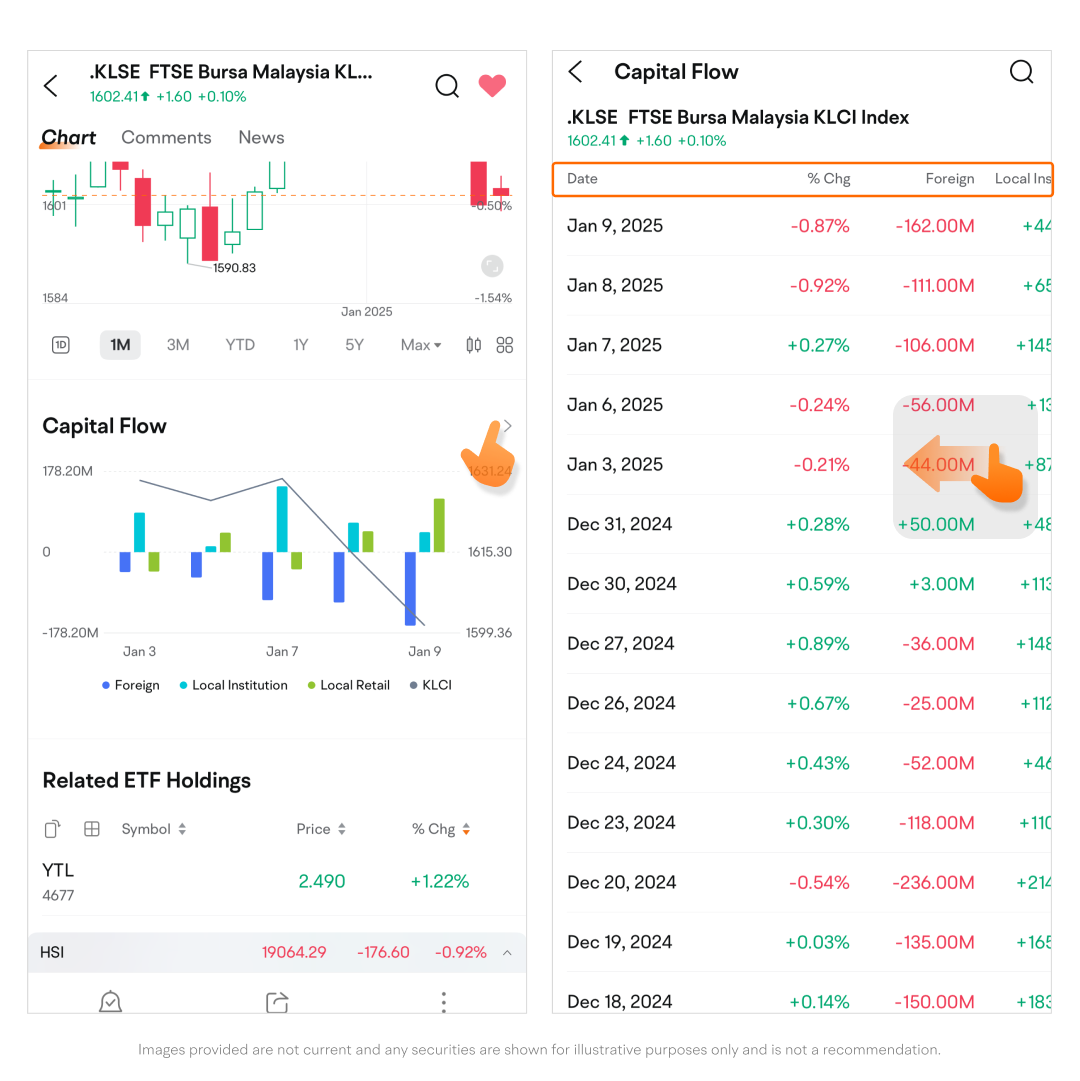
The daily capital flow data of foreign investors, institutions, and retail investors in the Malaysian stock market is displayed in a bar chart, while the trend of the FTSE Bursa Malaysia KLCI is represented by a line graph.
The data is updated on each trading day with information from the previous trading day.
The left axis shows the scale of capital flow in Millions, and the right axis displays the market index.
The horizontal axis uses 0 as the baseline. Values greater than 0 indicate net inflow, while values less than 0 indicate net outflow.

Long-press on a chart to view detailed information for a specific time or date.
The bottom legend is interactive on the intraday chart: Tap an item to toggle it.
Swipe right on the chart to view earlier data.
You can tap “>”icon to access a full list. This list shows the FTSE MY index trading day change% and specific capital flow data for foreign investors, institutions, and retail investors on different dates. Swipe left/down to view more fields.
Case Study:
Suppose we observe continuous net outflows of foreign capital from the Malaysian market for several days, accompanied by a downward trend in the index. How can we find potential investment opportunities?
When there's a significant outflow of foreign capital, stocks heavily held by foreign investors may experience substantial declines. At this time, we can use the Top Losers list to identify stocks that have experienced significant drops. This allows us to consider whether to short sell or buy the dip.
However, it's crucial to implement strict risk management and maintain reasonable position control.

Investments involve risk. Full disclaimers at https://www.moomoo.com/my/support/topic9_37. This advertisement has not been reviewed by the SC.
This presentation is for informational and educational use only and is not a recommendation or endorsement of any particular investment or investment strategy. Investment information provided in this content is general in nature, strictly for illustrative purposes, and may not be appropriate for all investors. Read more
Recommend

How to Evaluate ETFs? Handy Tools Can Help you

How to Open Your Account on moomoo

Getting Started with Margin Trading: A Practical Guide

How to invest in HK stocks on moomoo
How to Subscribe Cash Plus on moomoo
How to Use Malaysia Market Capital Flow
Trend Projection: Your Smart Investment Assistant
Visualised Financial Data: Shortcut to Know a Company's Fundamentals
How to Deposit to moomoo
How to Trade US Fractional Shares
How to Place a Basic Order?
How to Trade Futures on moomoo
How to Subscribe Malaysia IPO on moomoo
What are Daily Leverage Certificates
How to Step Up Your Trading with Order Types
Moomoo AI:Invest Forward and Easier
How to Use SmartSave
Identify Institutional Investor Moves with moomoo
How to Use Drawing Tools on moomoo
What is Technical Indicator Sentiment feature
Make Smarter Investment Decisions with Analyst Ratings
Spot High Dividend Stocks with Featured Lists
How to Use AI Market Monitor on moomoo
Seize Potential Trading Opportunities with Price Alerts
How to Trade 0DTE Options on moomoo
How to Draw Trend Lines
How to Use Date/Price Range
How to trade Covered Call on moomoo
How to Identify Candlestick Patterns
How to Use Technical Indicators on moomoo
How to Use MA in Real Trading
How to Use Fibonacci Retracement Levels
Short-term Trading: One Click to Catch the Top Gainers
Heat Map: Visualizing Current Market Opportunities
Shariah Screener in One Click
Industry Chain to Find Hidden Opportunities in Hot Industries
How to Use MACD in Real Trading
How to Evaluate ETFs? Handy Tools Can Help you
How to Open Your Account on moomoo
Getting Started with Margin Trading: A Practical Guide
How to invest in HK stocks on moomoo
How to Subscribe Cash Plus on moomoo
How to Use Malaysia Market Capital Flow
Trend Projection: Your Smart Investment Assistant
Visualised Financial Data: Shortcut to Know a Company's Fundamentals
How to Deposit to moomoo
How to Trade US Fractional Shares
How to Place a Basic Order?
How to Trade Futures on moomoo
How to Subscribe Malaysia IPO on moomoo
What are Daily Leverage Certificates
How to Step Up Your Trading with Order Types
Moomoo AI:Invest Forward and Easier
How to Use SmartSave
Identify Institutional Investor Moves with moomoo
How to Use Drawing Tools on moomoo
What is Technical Indicator Sentiment feature
Make Smarter Investment Decisions with Analyst Ratings
Spot High Dividend Stocks with Featured Lists
How to Use AI Market Monitor on moomoo
Seize Potential Trading Opportunities with Price Alerts
How to Trade 0DTE Options on moomoo
How to Draw Trend Lines
How to Use Date/Price Range
How to trade Covered Call on moomoo
How to Identify Candlestick Patterns
How to Use Technical Indicators on moomoo
How to Use MA in Real Trading
How to Use Fibonacci Retracement Levels
Short-term Trading: One Click to Catch the Top Gainers
Heat Map: Visualizing Current Market Opportunities
Shariah Screener in One Click
Industry Chain to Find Hidden Opportunities in Hot Industries
How to Use MACD in Real Trading