What should we do with this chart?
Rebound or Selloff?
Many investors are calling for a correction in the markets. Especially in those sectors that have experienced a massive rally like the semiconductor sector. So far this week, AMD has been one of the worst weeks we have seen in a while. Will we see a rebound soon? Or is there a further selloff?
Long-Term Price Channel
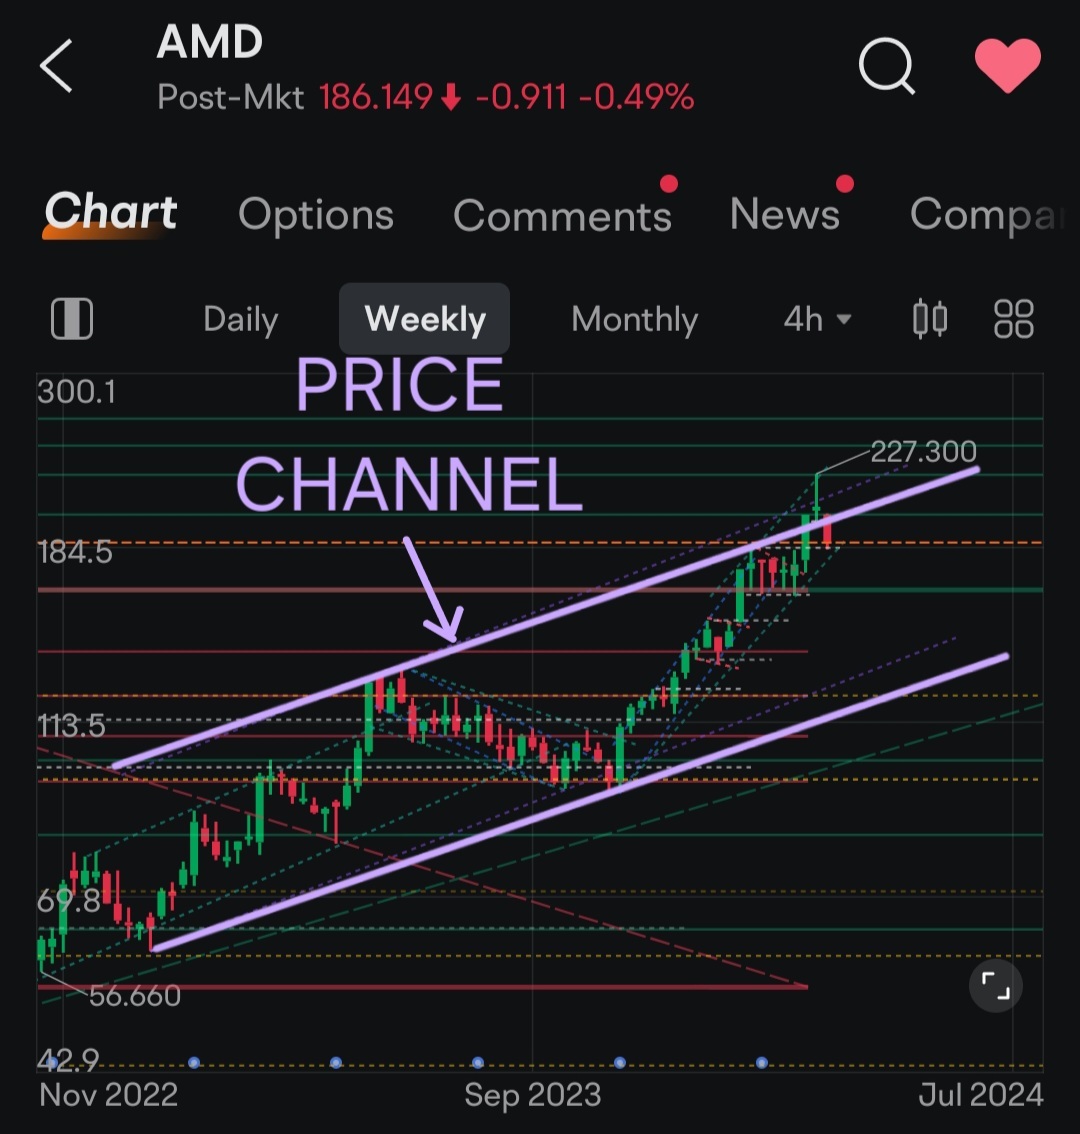
We need to see a little more price action for confirmation, but the charts appear to be forming a pretty clear price channel on the longer timeframes. The price action is near the upper resistance of this channel. If there ever was a place to find some selling, then it would be near resistance.

Blow Off Top
We saw some of this selling last week leading to a possible blow off top or false breakout or above the long-term resistance seen in the chart below.
After experiencing over a 144% rally following the previous correction, it would not be crazy to see at least a little correction or profit taking. Will we see a legitimate correction since we have rallied so much, and AMD's price appears to be at a long-term resistance?

Still Trending Up
When you look at these shorter time frames, then you will see that a price is still in its upward trending price channel. Technically speaking, there has been no correction that has started yet until the price officially drops below the trending support level of this price channel.

Short-Term Horizontal Support
When we zoom in and take a closer look, we can see that the price action is near converging support zones. These would be the horizontal resistance and the trending resistance you can see below.
If this sharp rally is to continue as strongly as it has been, then we need to see a rebound at these support levels. After all, the perfect place for a rebound would be near converging support zones.
If the price drops below these support lines, then technically speaking, the current trend will have likely ended, and another trend will be forming.

A drop below these converging supports would coincide with the RSI indicator falling into bearish territory. This would be a bearish look for the very short-term outlook.

So are you going to buy the dip here at the short-term converging support zones? Or do you see more downside coming very soon?
Good Luck Trading
As always, I am not a financial professional, and this is not investment advice. Be careful and be patient. Dont anticipate the market. Rather, participate in the market. Don't invest money that you can't afford to lose. Give some of your investments time and know when to cut your losses.
Don't be greedy. Don't invest in anything you don't understand. Don't put all of your eggs in one basket. Don't listen to the hype. Don't fomo or panic into or out of trades. Do your own due diligence. And just follow the trends. A trend is your friend. Good luck trading.
$SPDR S&P 500 ETF(SPY.US$ $Invesco QQQ Trust(QQQ.US$ $SPDR Dow Jones Industrial Average Trust(DIA.US$ $S&P 500 Index(.SPX.US$ $NASDAQ 100 Index(.NDX.US$ $Dow Jones Industrial Average(.DJI.US$ $E-mini S&P 500 Futures(JUN4)(ESmain.US$ $E-mini NASDAQ 100 Futures(JUN4)(NQmain.US$ $E-mini Dow Futures(JUN4)(YMmain.US$
Disclaimer: Community is offered by Moomoo Technologies Inc. and is for educational purposes only.
Read more
Comment
Sign in to post a comment

Money Thrill : Technical Analysis is good but never tells You the exact Future? The sentiment about AMD is not good. I buy at 195 and sell at 188. Take my loss ... and go further with ASML, SMCI.US, Taiwan Semiconductor and Nvidia. The earnings for AMD are expectations... they shall sell at LOWER prices. Lower prices are lower earnings. As investor in AI I want to go FOR THE BEST ....

SpyderCallOP Money Thrill: AMD has a history of being a well performing stock.