One More Level To Go! (BTC Charts)
Good morning everyone! I hope you had a relaxing weekend filled with deposits to the bank account and are getting ready for another week in the markets.
Last week, we talked about Bitcoin Levels, Bitcoin Sentiment, and Bitcoin Liquidity. All of which are important factors when considering the price and movement of BTC on the day. However, I think it is important to mention that levels, sentiment and liquidity aren't only related to just Cryptomarkets, they are tools used by investors and traders in every market. If you trade Futures, then you know how important understanding liquidity and levels is. So whether you are trading crypto or in the overall markets, having a strong understanding of market liquidity, significant levels, and sentiment will make you a better trader, charter, and will increase your understanding of markets.
That being said, let's look at the charts.
Bitcoin Weekly
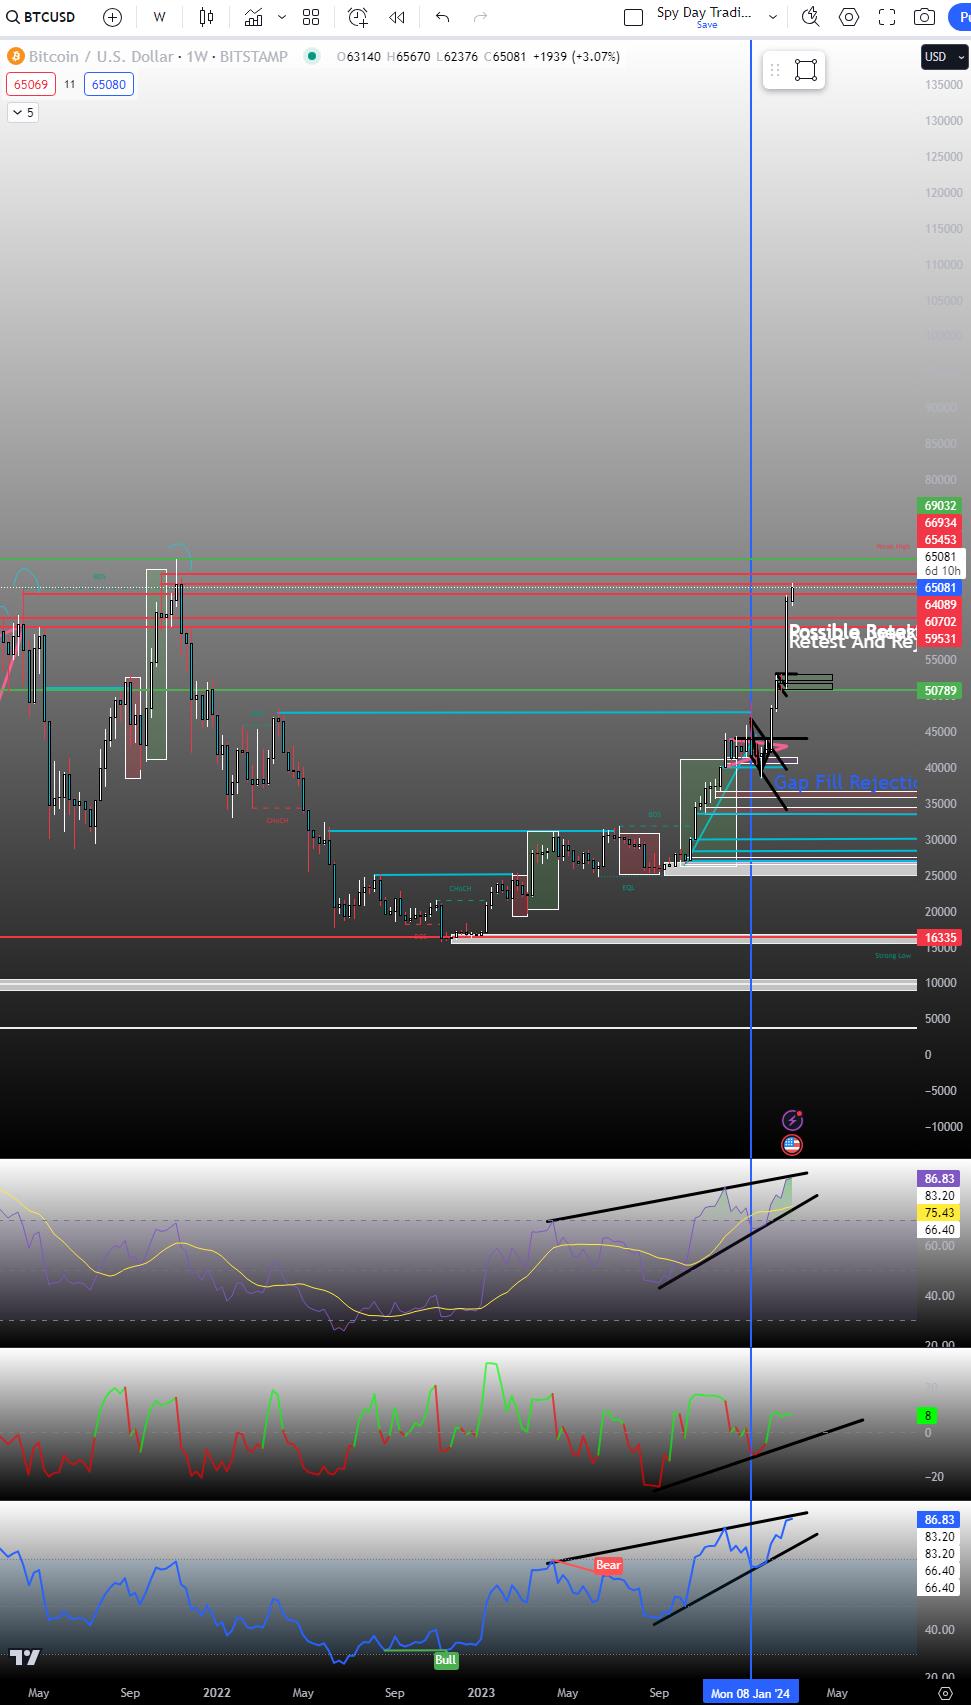
We are approaching the all time high for Bitcoin, however I am not sure if we will shoot straight up to it. Right now, it looks like we will, but I want to see some consolidation before moving to the highs.
A couple weeks ago we talked about the possible cup and handle forming on the weekly. Not only did it play out, but as we approach the all time highs it makes me more bullish that we will achieve a higher high by or during April. If volume continues to come in strong, we might shoot right up to it. However, once we do I would not be suprised at all if we see a medium sized pullback.
For example, look at the previous push to the all time highs.
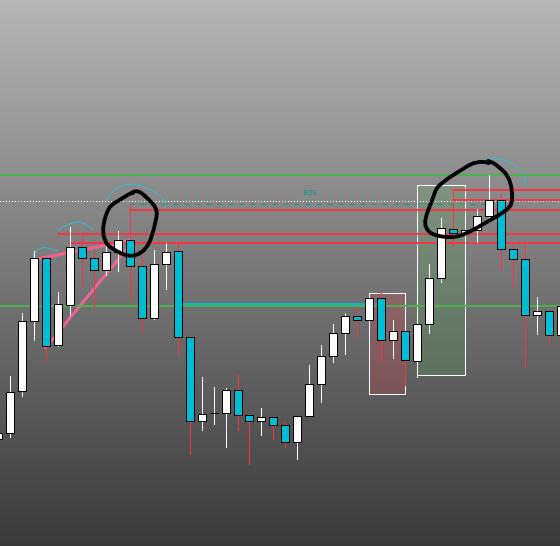
When they were achieved, we saw a pullback on the week and week after before moving to the highs.
Remember our Equal High strategy. When Bitcoin makes an equal high, it likes to pull back. This could range from a smaller pullback as seen in this chart, or it could be a medium pull back as seen in here.
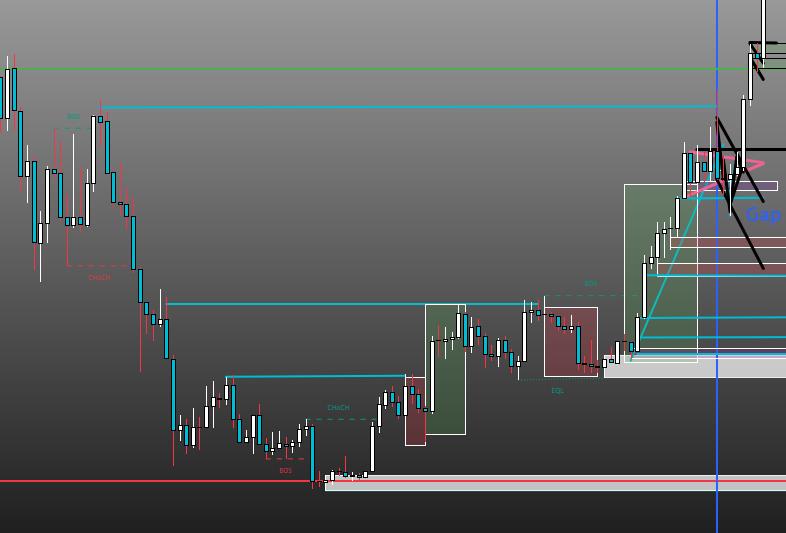
When Bitcoin reached the equal high at the $48,000 level, we saw a decent pullback. However, similarily to the previous all time high, the price rejected back to the upside.
Although we saw a larger move upside here, we might not see a similar move due to the all time highs. It is very typical to see a pullback at the all time highs before moving further upside. However, I think after the pullback around the all time high, we will continue to move further upside.
My idea is supported also by the fact that the RSI is very overextended now. The probability of a pullback soon is higher than a larger push upside. Which is why I want to see some consolidation before moving to the next level. This would give buyers more confidence that there is more room for upside once the price stabalizes above $64,089.
Bitcoin Daily
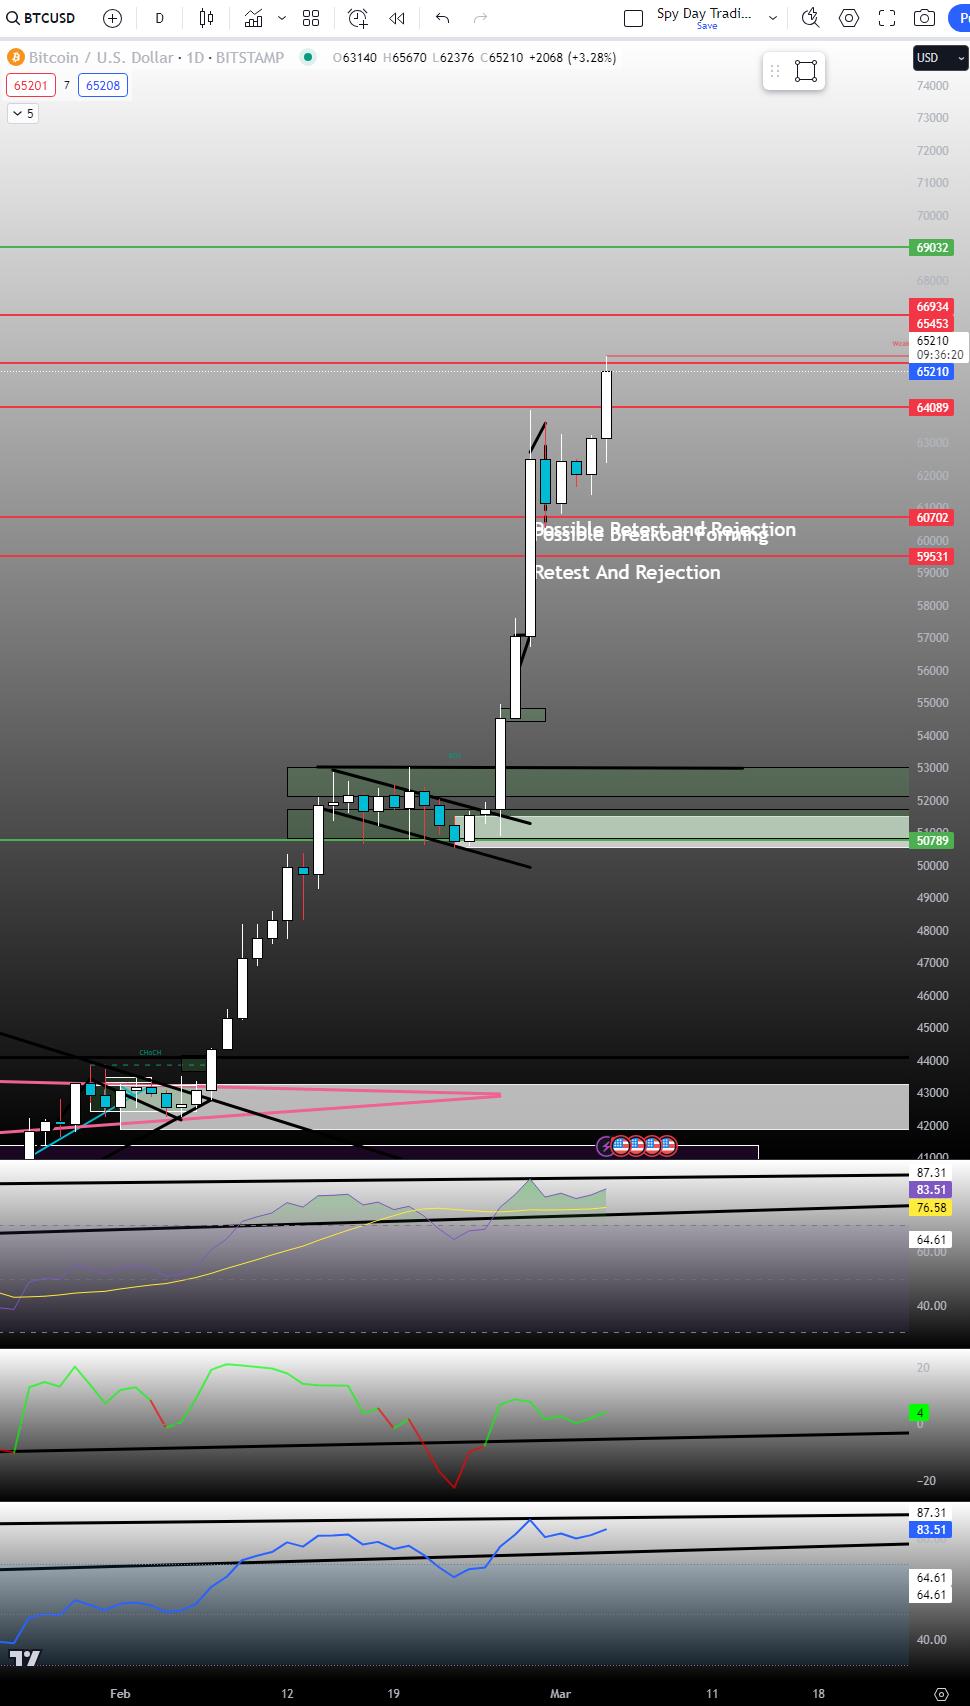
Let's clean up the chart a bit.

Nice bull flag leading up to the next level we found!
Speaking of which, I mentioned there were two more levels that we need to close above for more upside.
The $64,089 level
The $65,403 level
Right now, we are trading nearly at the exact price I told you about last week.
There is one more to go! $66,934 will be the final level before the previous all time high. With the way buyers continue to sweep the sellers, I actually would not be suprised if we completely blow past this level.
I think this will be the case because of the previous time we were at this price.

See all those larger candles? There's a couple things to note about the price action.
These candles to me look like sweeps. Sweep candles are usually as a result of volatility and volume. Where we see large movements because the all time high's not only tend to have a lot of volatility, but buyers will enter with more volume just to make it happen if there is confidence that it will happen. If there is a larger probability of getting to the all time highs, what usually occurs is not only will it get there, but we will see huge amounts of volatility before and at the level because of the price, sentiment, and volume.
Basically what I am saying is there is not a lot in Bitcoin's way from getting to the all time high. All what remains, according to the charts, is levels and areas of volatility. There could 100% be different reasons why Bitcoin doesn't reach the all time high, for example if the Bitcoin network crashes and liquidates everyone then yeah we probably would see a huge downside move, but there is also many other reasons why Bitcoin will reach the all time high.
That's where sentiment comes in. So many investors are aware of the "Bitcoin Halving". News wires won't stop printing news about Bitcoin reaching higher prices, and everyone is anticipating a halving once we reach the all time highs except me. I think we will go higher. Point is, a LOT of investors, traders, and institutions are all looking for Bitcoin toAT LEAST hit the all time highs.
Bitcoin 1 Hour
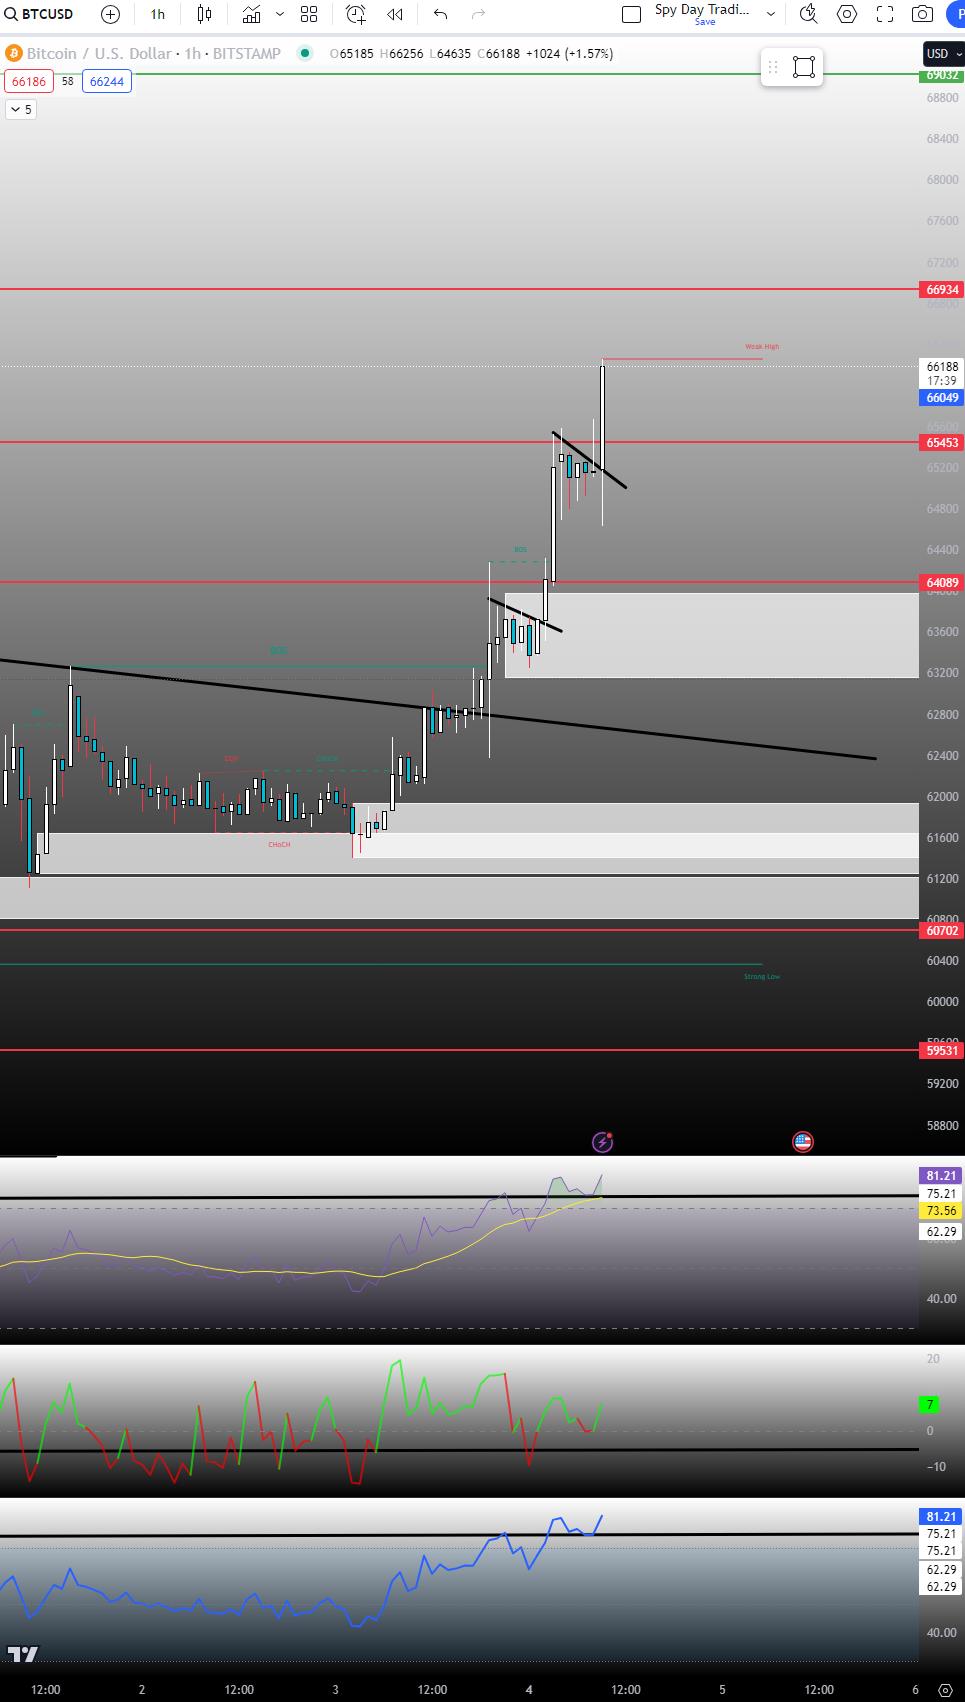
Look at all those buyers over the weekend! Tons of orders being placed and if you remember our previous charts about Bitcoin Liquidity, I told you what would happen if buyers stepped in around our levels. The sellers got taken out, and left room for the price to move to the upside to where we are at now.

We are only around 4% off from the all time highs. I think we can get there, but I also think we will see some pull backs along the way (consolidation) before shooting straight for it.
Once we are there, I expect a pullback. We could just blow past it, but the probability of some sort of rejection at the all time high is higher than exploding straight beyond it.
We have one more level to go, $66,934. This is not a strong level, but a volatility level as I talked about earlier in this article. With the increased volatility, I expect to see some decent sized candles. If we consolidate from that level to the all time highs, that would make me even more bullish. My sentiment would change if we reject strong off these levels and start making higher lows. Regardless, I can see some large candles from that level to the all time high. Buyers want this, as we do not want to slow down on our way to the highs.
Unless there is news about Bitcoin crashing or something like that, I think the probability of getting to the all time highs is much larger than not.
As I am writing this, Watcher Guru just posted exactly what I said would happen if buyers stepped in.

The buyers took out the sellers, and as they continue to do so the price will keep moving towards the all time highs.
Bitcoin 5 Minute
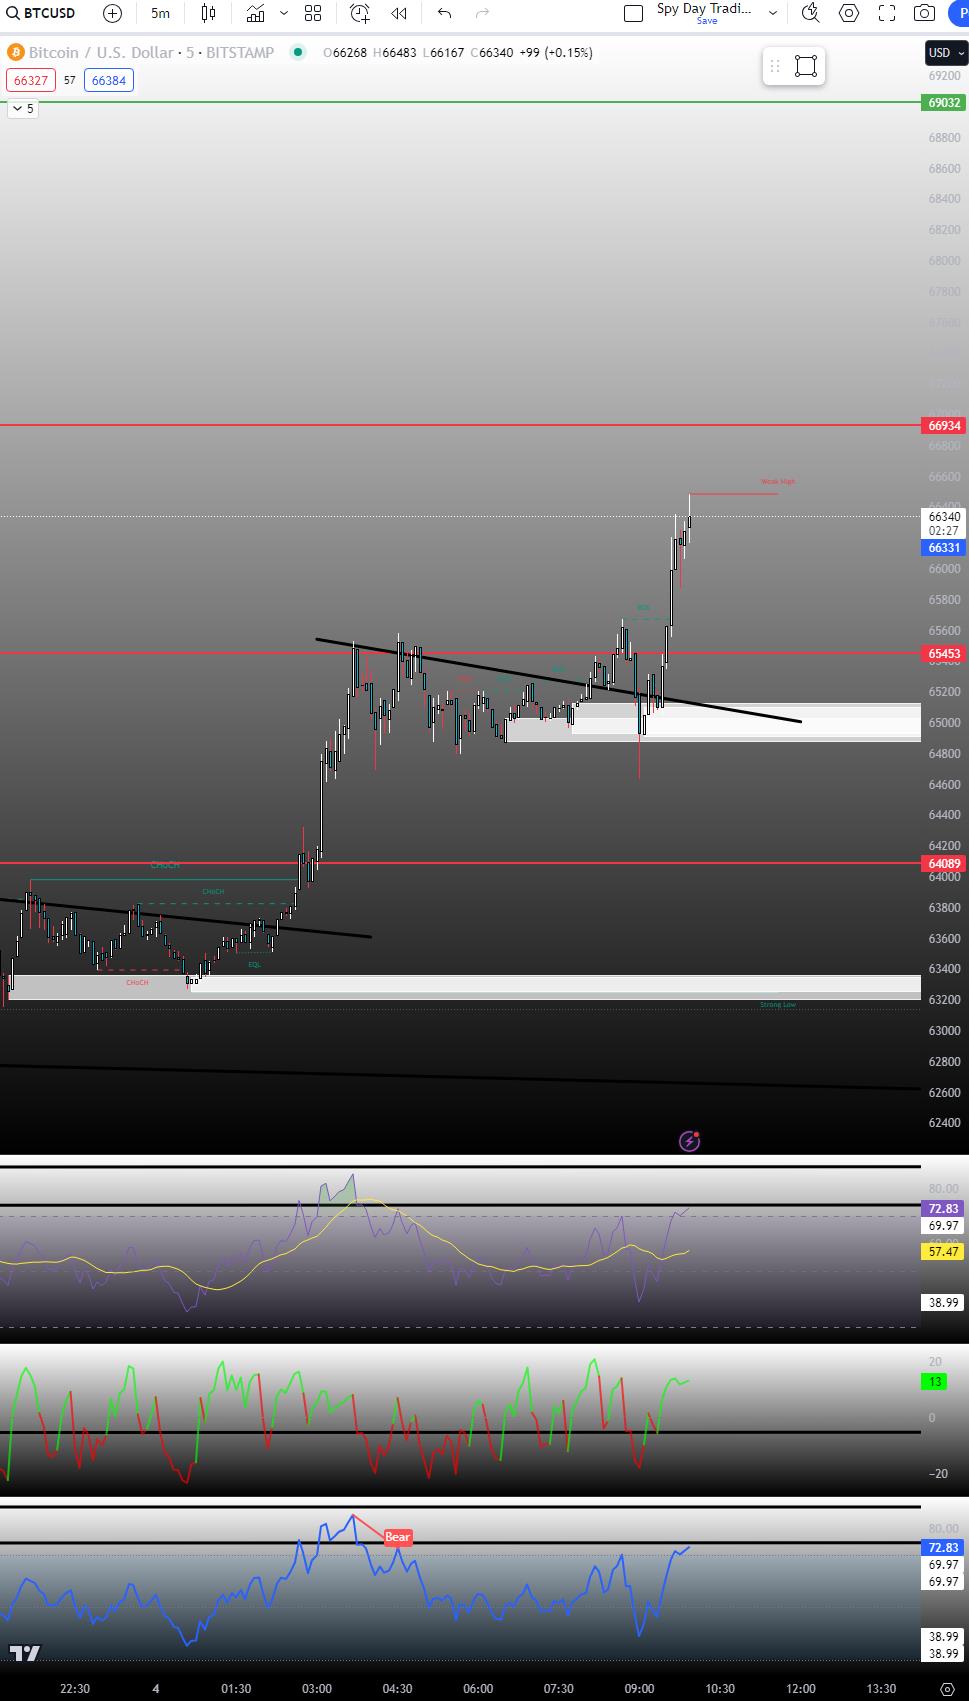
The RSI is not as extended here as on the Weeklly. This gives me confidence that we will see the $66,934 level either today, or at least by Wednesday.

There is no obvious formation right now, but I would like to see a retest of the level, some consolidation, a retest and rejection of the level, then a move further upside.

We may even see a retest of the previous level. If we reject off of it with volume, then I really would not want to be shorting Bitcoin. The probability of a retest is about 3/10ths, possibly one last liquidity grab before moving up. It is only right now at this chart where I can see the sellers trying one or a couple more times to keep the price down for some quick profits before getting out of the way. The larger time frames all suggest we will continue moving upside.
I could be wrong, but the overall sentiment is bullish. Either this week, or next week I can see us retesting the $66,934 level then eventually moving to the all time highs.
But what about April?
Investors and Traders are set in their thoughts that Bitcoin will hit the all time high in April. Well, I think it will be before that. At the earliest, I think March 18th will be the beginning of the run to the highs. If buyers step in to take the $66,934 level, retest and reject it, within the next 2 weeks, I can see all time highs before April. That is REALLY bullish. It would beat everyones expectations.
If we get to the all time highs, what's next?
I mean, I think a pull back is the obvious answer. But I also think we will make a new all time high. I will post a For Followers article without tags on my price predictions, and where I think Bitcoin may go once we reach the all time highs. You won't want to miss that.
Conclusion
Thank you for reading and all of the support. On the weekend alone, we are approaching our own all time high of 900 followers on MooMoo! I am grateful for the opportunity to post the charts, write my articles, and grow along side everyone in the markets.

There is a possible bull flag forming on the 5 minute, will this be the formation we need to get to the next level? Maybe, but we need more volume here.
I hope everyone makes some cheese this week, and thank you again for all the support. Can we reach 1000 followers along with Bitcoin's all time high? I'm bullish on it and all of you. Thank you and good luck in the market
Disclaimer: Community is offered by Moomoo Technologies Inc. and is for educational purposes only.
Read more
Comment
Sign in to post a comment
