Bitcoin Post Halving Charts
Good morning everyone! I hope you all had as awesome of a weekend that I had :) Record store day was really fun and I picked up a bunch of new albums from artists that I had been listening to for a while but never got around to it. However, its now the week and it's time to get back to the charts.
Last Friday, the Bitcoin Halving came to a conclusion as investors and traders all watched on the sidelines to see where the price would go.
For our notes:
With that said, let's take a look at the charts.
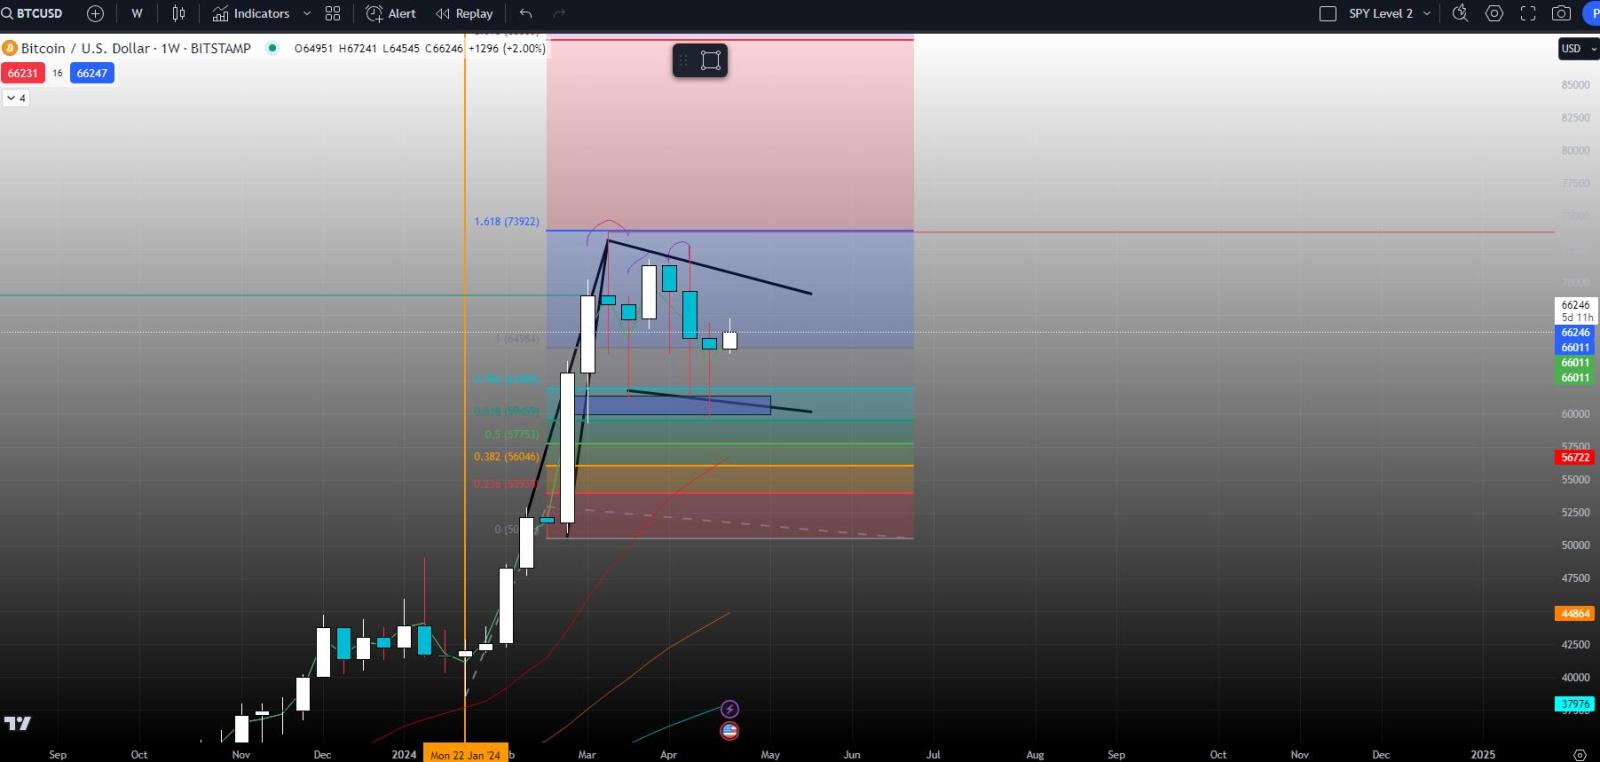
Bitcoin Weekly

Now I know what your thinking, what is this week looking structure? Well, it's a bull flag!
Weekly Chart Breakdown:

Bitcoin Daily

There was a possible triple top on the daily which lead into the Bitcoin Halving
For Notes:
-100% of halvings occured after a move to the all time highs
-100% of halvings occured after a bearish pattern within a bullish pattern on a higher time frame
Daily Chart Breakdown:
-Bullish continuation structure
-Looks like too easy of a long trade here


Adding the Halving Candle to the charts.
Bitcoin 4 Hour

Right now the 4 hour is starting to form a bottoming out pattern, buyers might use this level as a squeeze or as an area of reloading back at the Weekly Fibonacci level.
4 Hour Chart Breakdown:
Bitcoin 1 Hour

The 1 hour is trending to the upside in a tight channel. Whether or not this will break down or break to the upside is yet to be determined.
1 Hour Chart Breakdown:
Bitcoin 15 Minute

Bitcoin is moving to the upside after the breakout at liquidity at the $66,148 level

Also fighting sellers here at the $66,700 price
15 Minute Chart Breakdown:
Bitcoin 5 Minute

Buyers are right now battling the sellers for more upside, huge volatility candle printing. It will have to close above the sellers for more upside.
5 Minute Chart Breakdown:
Bitcoin 1 Minute

Other than Bitcoin starting to make higher lows, not much else to mention.
1 Minute Chart Breakdown:
Conclusion
I know this post was shorter, but I am trying out a new structured way of writing. This way I can get you the facts and trends without writing a huge paragraph that no one has time to read. However, Bitcoin looks bullish on all time frames. If buyers continue to step up, then we might see a retest of $70,000 by the end of next week.
From my research, the Bitcoin Halving is the most powerful bullish catalyst in the long term. However, the first larger move is seen 100% of the time after 100 days.

I think if we dip before then, we should keep our eye on a buying position.
I think if we create another all time high before then, we should keep our eye on a short position.
I cannot always be correct, so do your own research and hopefully by that time we are ready to enter in a position either way.
That being said, I think I will start another funded account challenge. I should be able to get funded within a week. Once I do I will begin making the Futures posts again.
Projects I Am Working On:
-Other than getting another account funded, I am going to update my screener. I want the screener to be an absolute beast. For short squeezes and options alerts.
-Researching new charting tools. The indicators I use and other tools I impliment on my charts are awesome, but I think I am missing one more piece to the puzzle. With this, I will be able to make even more accurate charts.
-I might be partaking in an interview with MooMoo! Stay tuned for that.
Thank you for reading and I hope you all enjoy your week in the market.
At the time of writing, Bitcoin is at $66,777 and reversing off selling liquidity
Disclaimer: Community is offered by Moomoo Technologies Inc. and is for educational purposes only.
Read more
Comment
Sign in to post a comment

jorncena96 : thank you for indepdth analysis


AkLiOP jorncena96: I appreciate that! :)