Interpretation of indicators
1. Entry
Select a Stock > Chart > Scroll down > Indicator Sentiment > signal icon > Interpretation
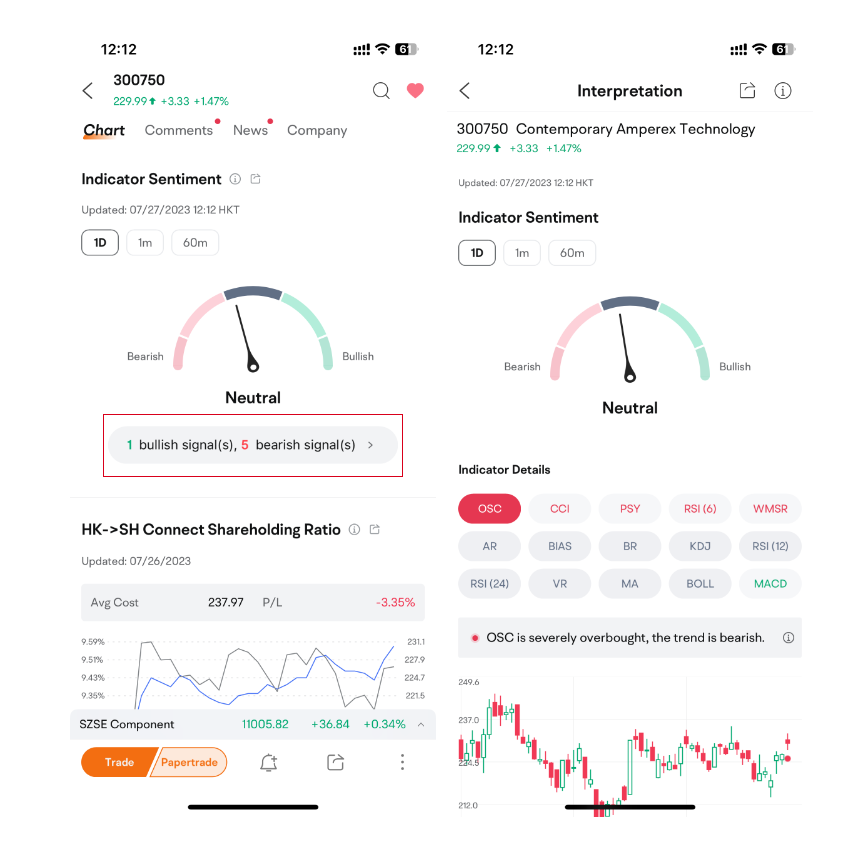
(If there is any inconsistency between the interface shown in the screenshot and the actual interface, the actual interface shall prevail. The securities mentioned therein are for illustration purposes only and do not constitute any recommendation.)
2. How to Use Interpretation of Indicators
2.1 Indicator Sentiment
The dashboard presents the overall status of all technical indicators, and supports switching to view different candle chart period.
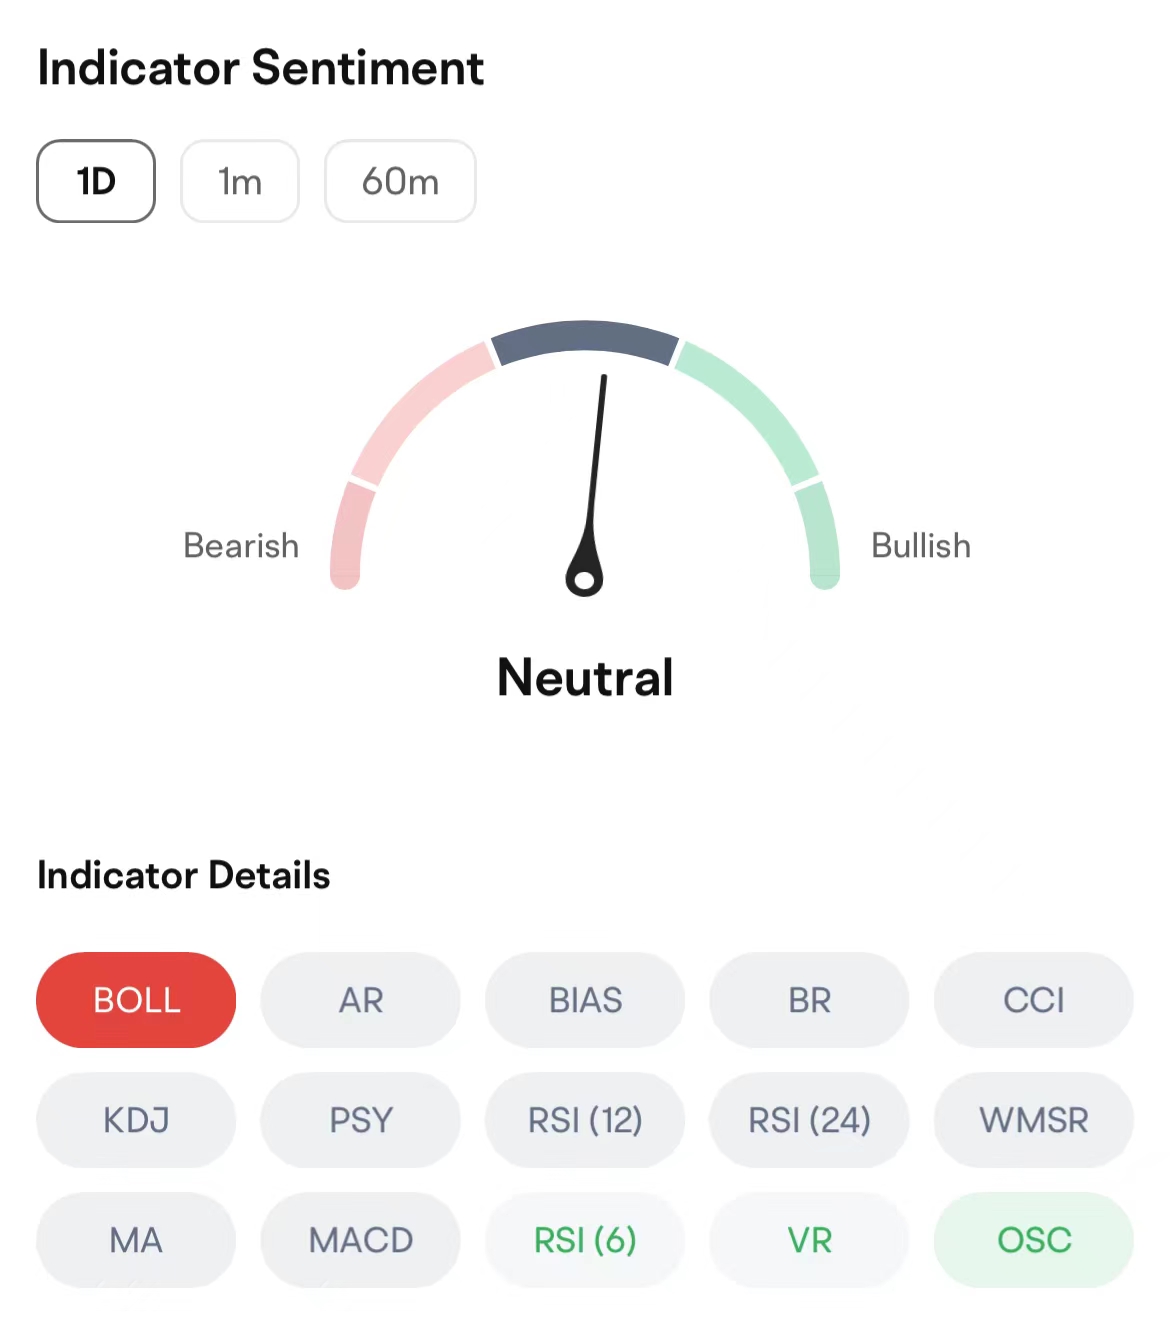
(If there is any inconsistency between the interface shown in the screenshot and the actual interface, the actual interface shall prevail. The securities mentioned therein are for illustration purposes only and do not constitute any recommendation.)
Signals | Meaning |
Danger | The trend is bearish, and the risk is relatively high |
Warning | The trend is relatively bearish |
No Obvious Signal | The trend is not clear |
Positive | The trend is relatively bullish |
Bullish | The trend is bullish, and there is a great chance of rebound or rise |
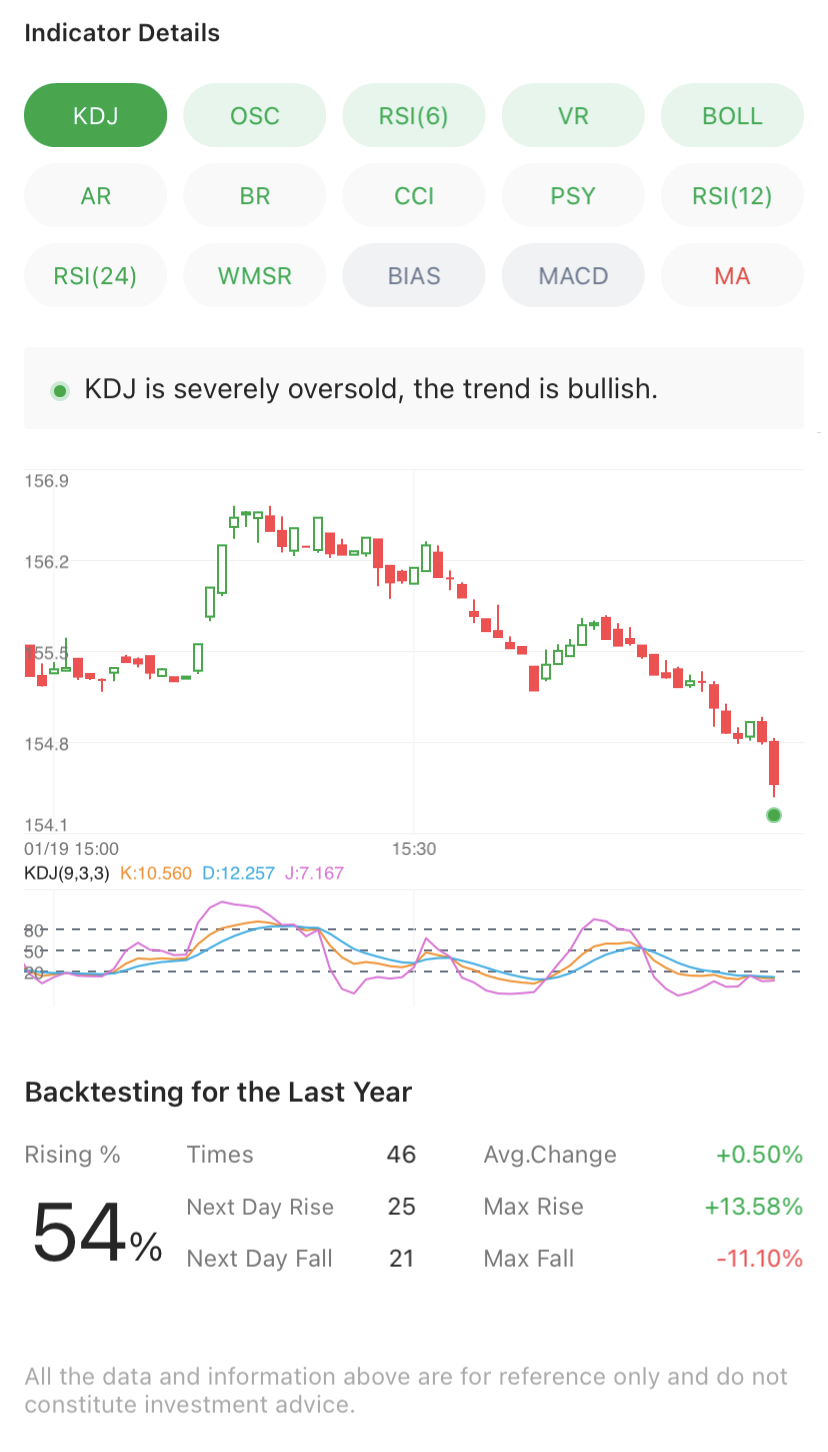
2.2 Indicator Details
Click on each indicator to view the corresponding status.
(If there is any inconsistency between the interface shown in the screenshot and the actual interface, the actual interface shall prevail. The securities mentioned therein are for illustration purposes only and do not constitute any recommendation.)
2.3 Backtesting
Statistics of the past occurrences and ups and downs of the currently selected indicator are shown. Rise % = The Number of Rises in the Next Day / Total
This presentation is for informational and educational use only and is not a recommendation or endorsement of any particular investment or investment strategy. Investment information provided in this content is general in nature, strictly for illustrative purposes, and may not be appropriate for all investors. It is provided without respect to individual investors’ financial sophistication, financial situation, investment objectives, investing time horizon, or risk tolerance. You should consider the appropriateness of this information having regard to your relevant personal circumstances before making any investment decisions. Past investment performance does not indicate or guarantee future success. Returns will vary, and all investments carry risks, including loss of principal. Moomoo makes no representation or warranty as to its adequacy, completeness, accuracy or timeliness for any particular purpose of the above content.