Trade Overview introduction
1. Entry
Select a Stock > Chart > Trade Overview (below the Market Position Overview)
2. Brief Introduction
Trade Overview is a data indicator that analyzes the market's capital flow. By checking the flow of funds, traders can grasp the timing of transactions.
2.1 Trade Overview
From the pie chart, we can understand the proportions of the total turnover of the extra-large orders, large orders, medium orders, and small orders. From the bar chart, we can understand the specific inflow and outflow amounts of extra-large orders, large orders, medium orders, and small orders.
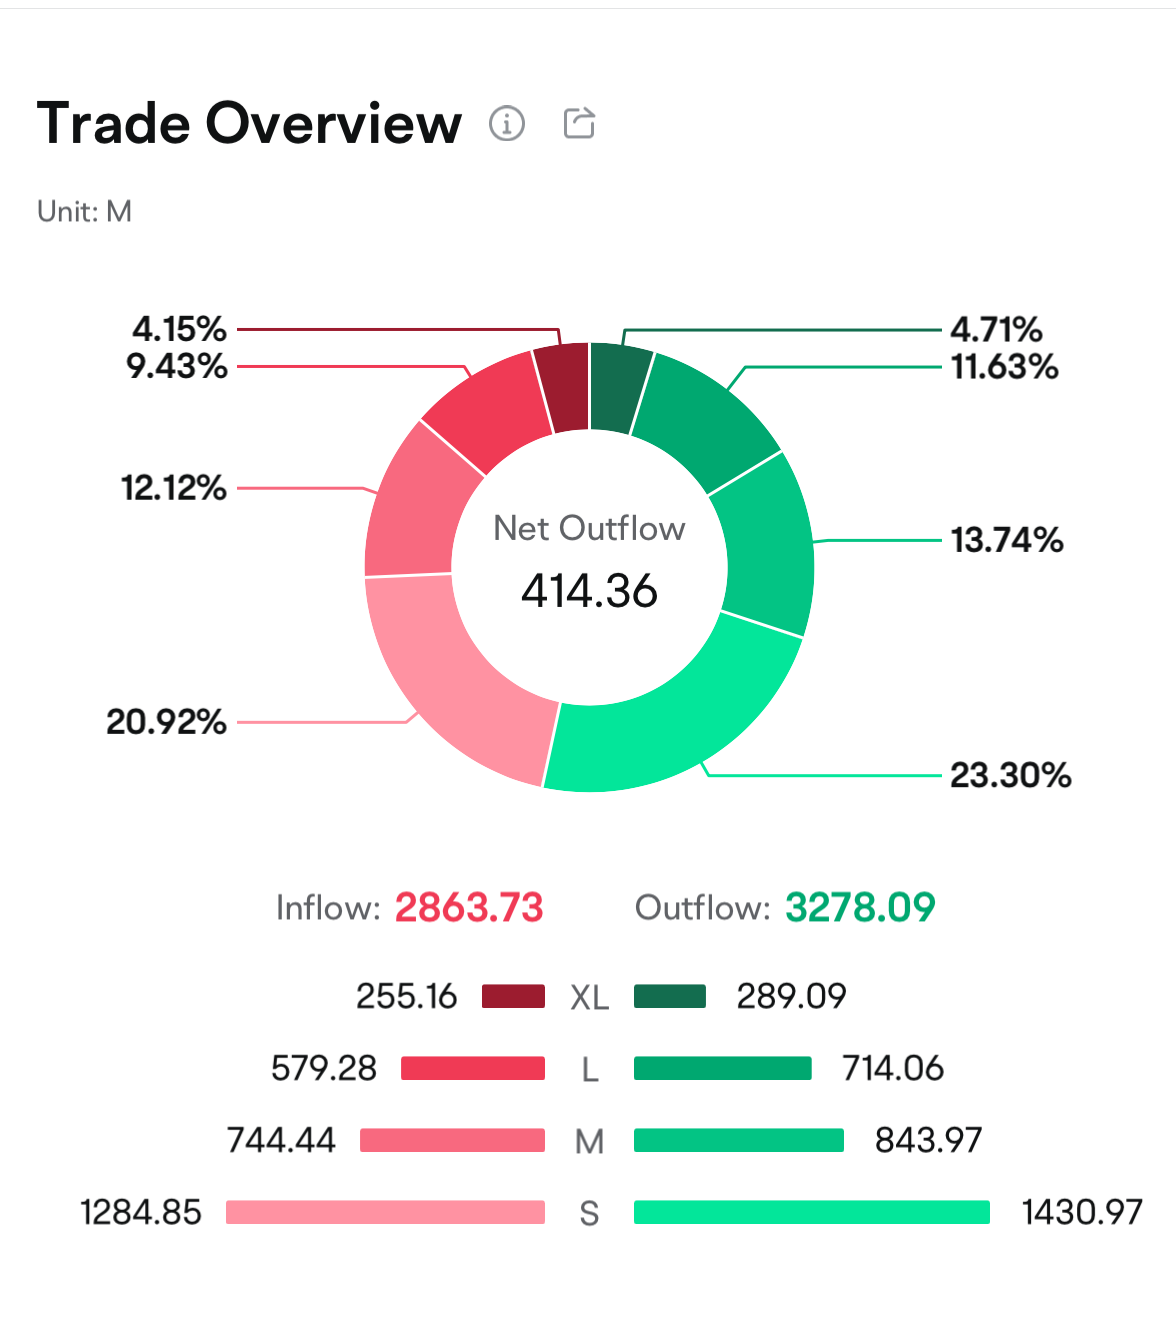
(This image provided may not be current and any securities are shown for illustrative purposes only.)
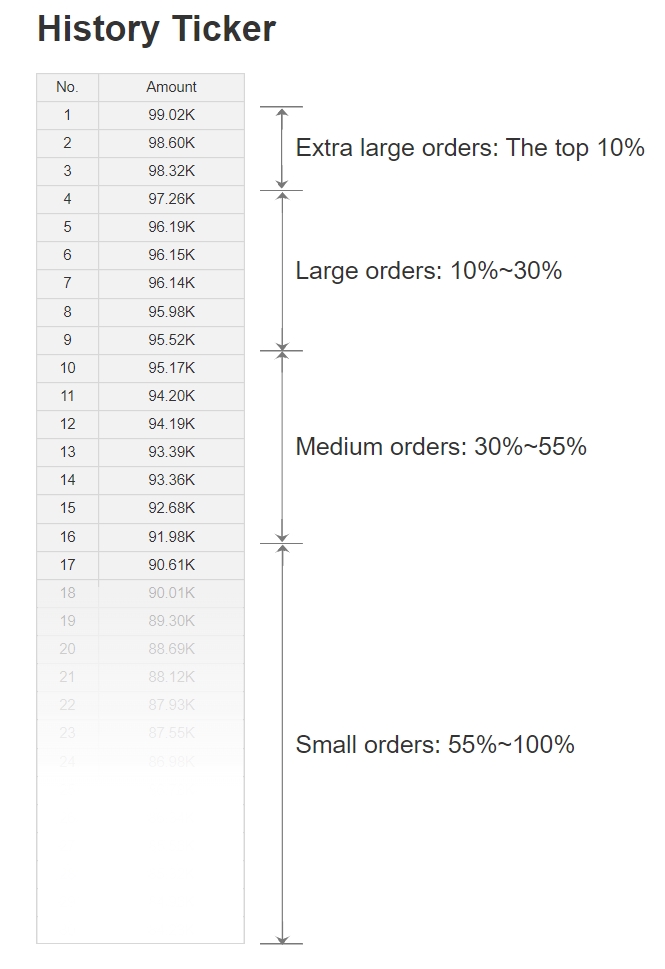
The method for classifying extra-large orders, large orders, medium orders, and small orders:
● Orders in the last 200 days are sorted by transaction amount in descending order:
Extra-large orders: The top 10%
Large orders: 10~30%
Medium orders: 30~55%
Small orders: 55%~100%
2.2 Money Flow
Money Flow presents the current fund flow curve of stocks, including 5 curves for overall, extra-large, large, medium, and small orders.
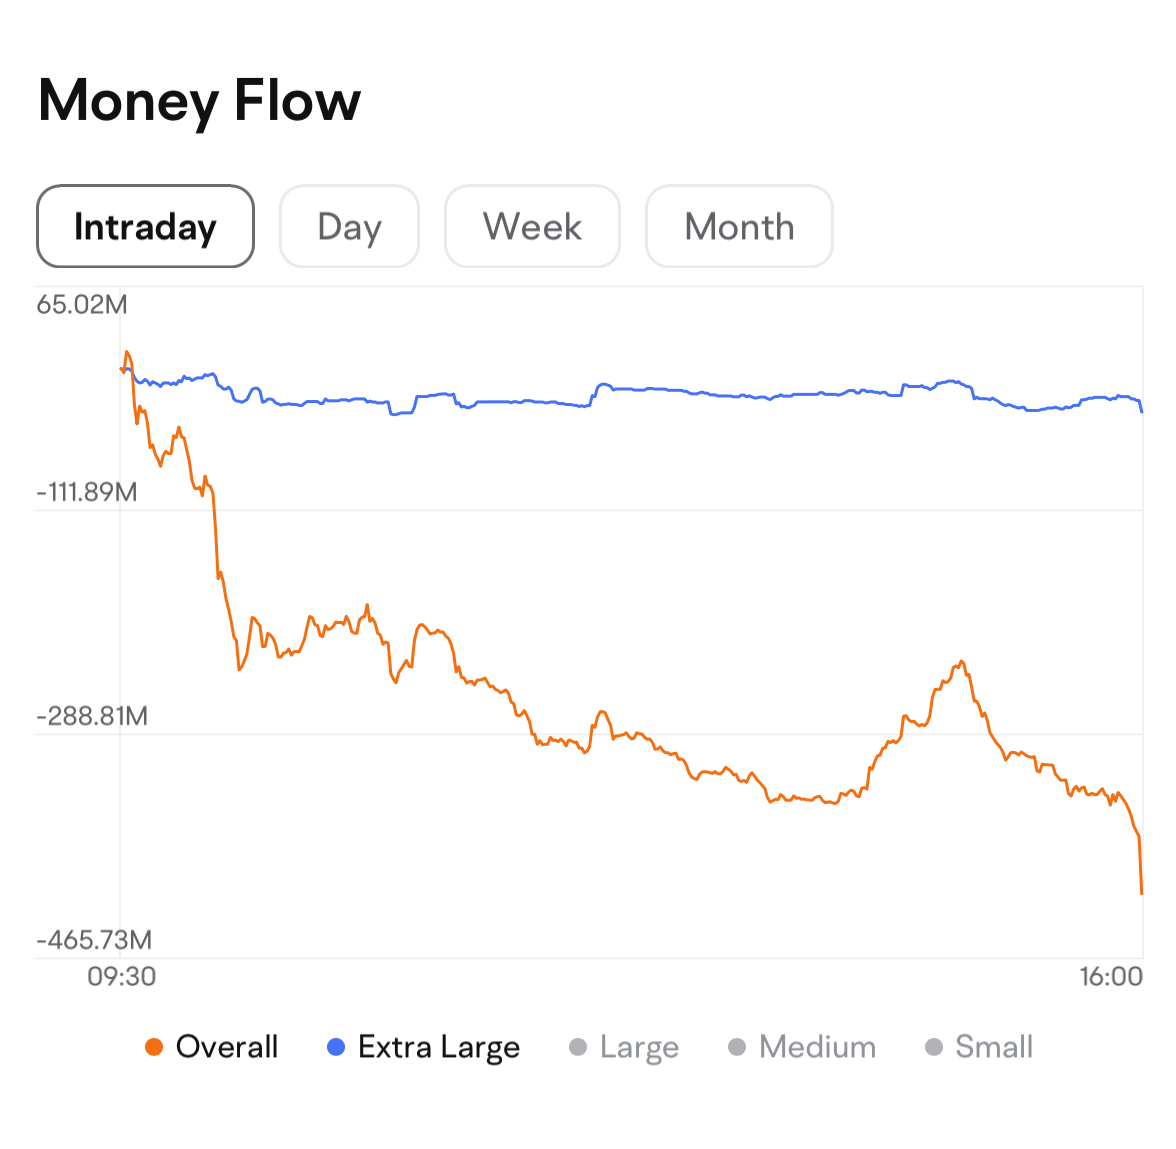
(This image provided may not be current and any securities are shown for illustrative purposes only.)
2.3 Historical Money Flow
Historical money flow presents multi-period historical capital flow data. Long press to call out the crosshairs and floating window, the floating window displays the value of the net flow of funds and the closing price for time.
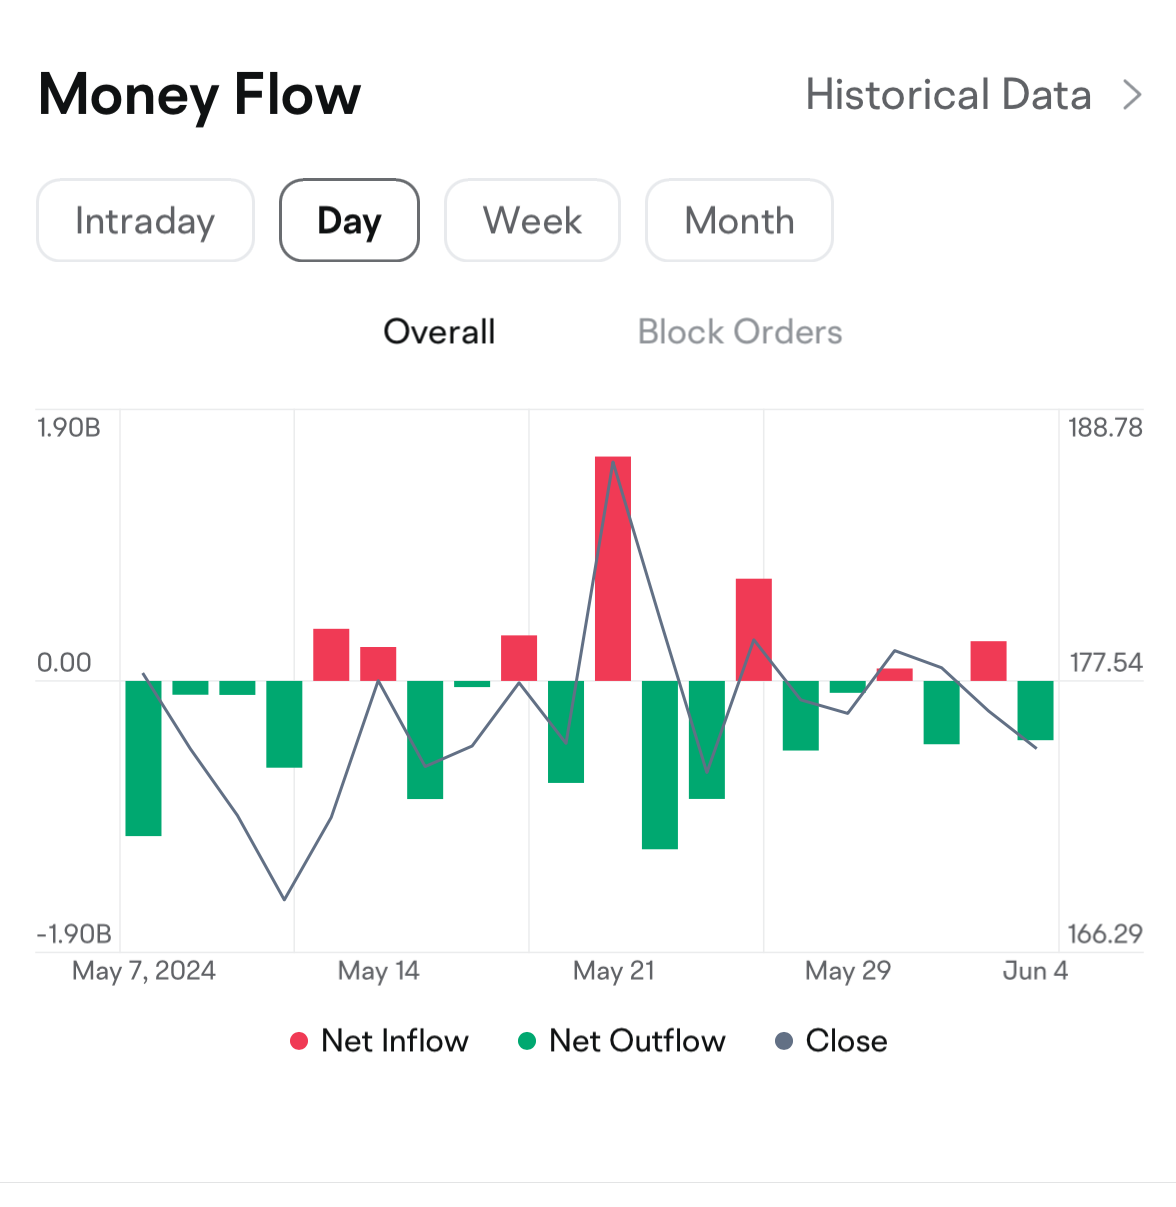
(This image provided may not be current and any securities are shown for illustrative purposes only.)
2.4 Money Flow Details
Tap "Historical Data" to view the daily flow details, and you can swipe horizontally to view more data.
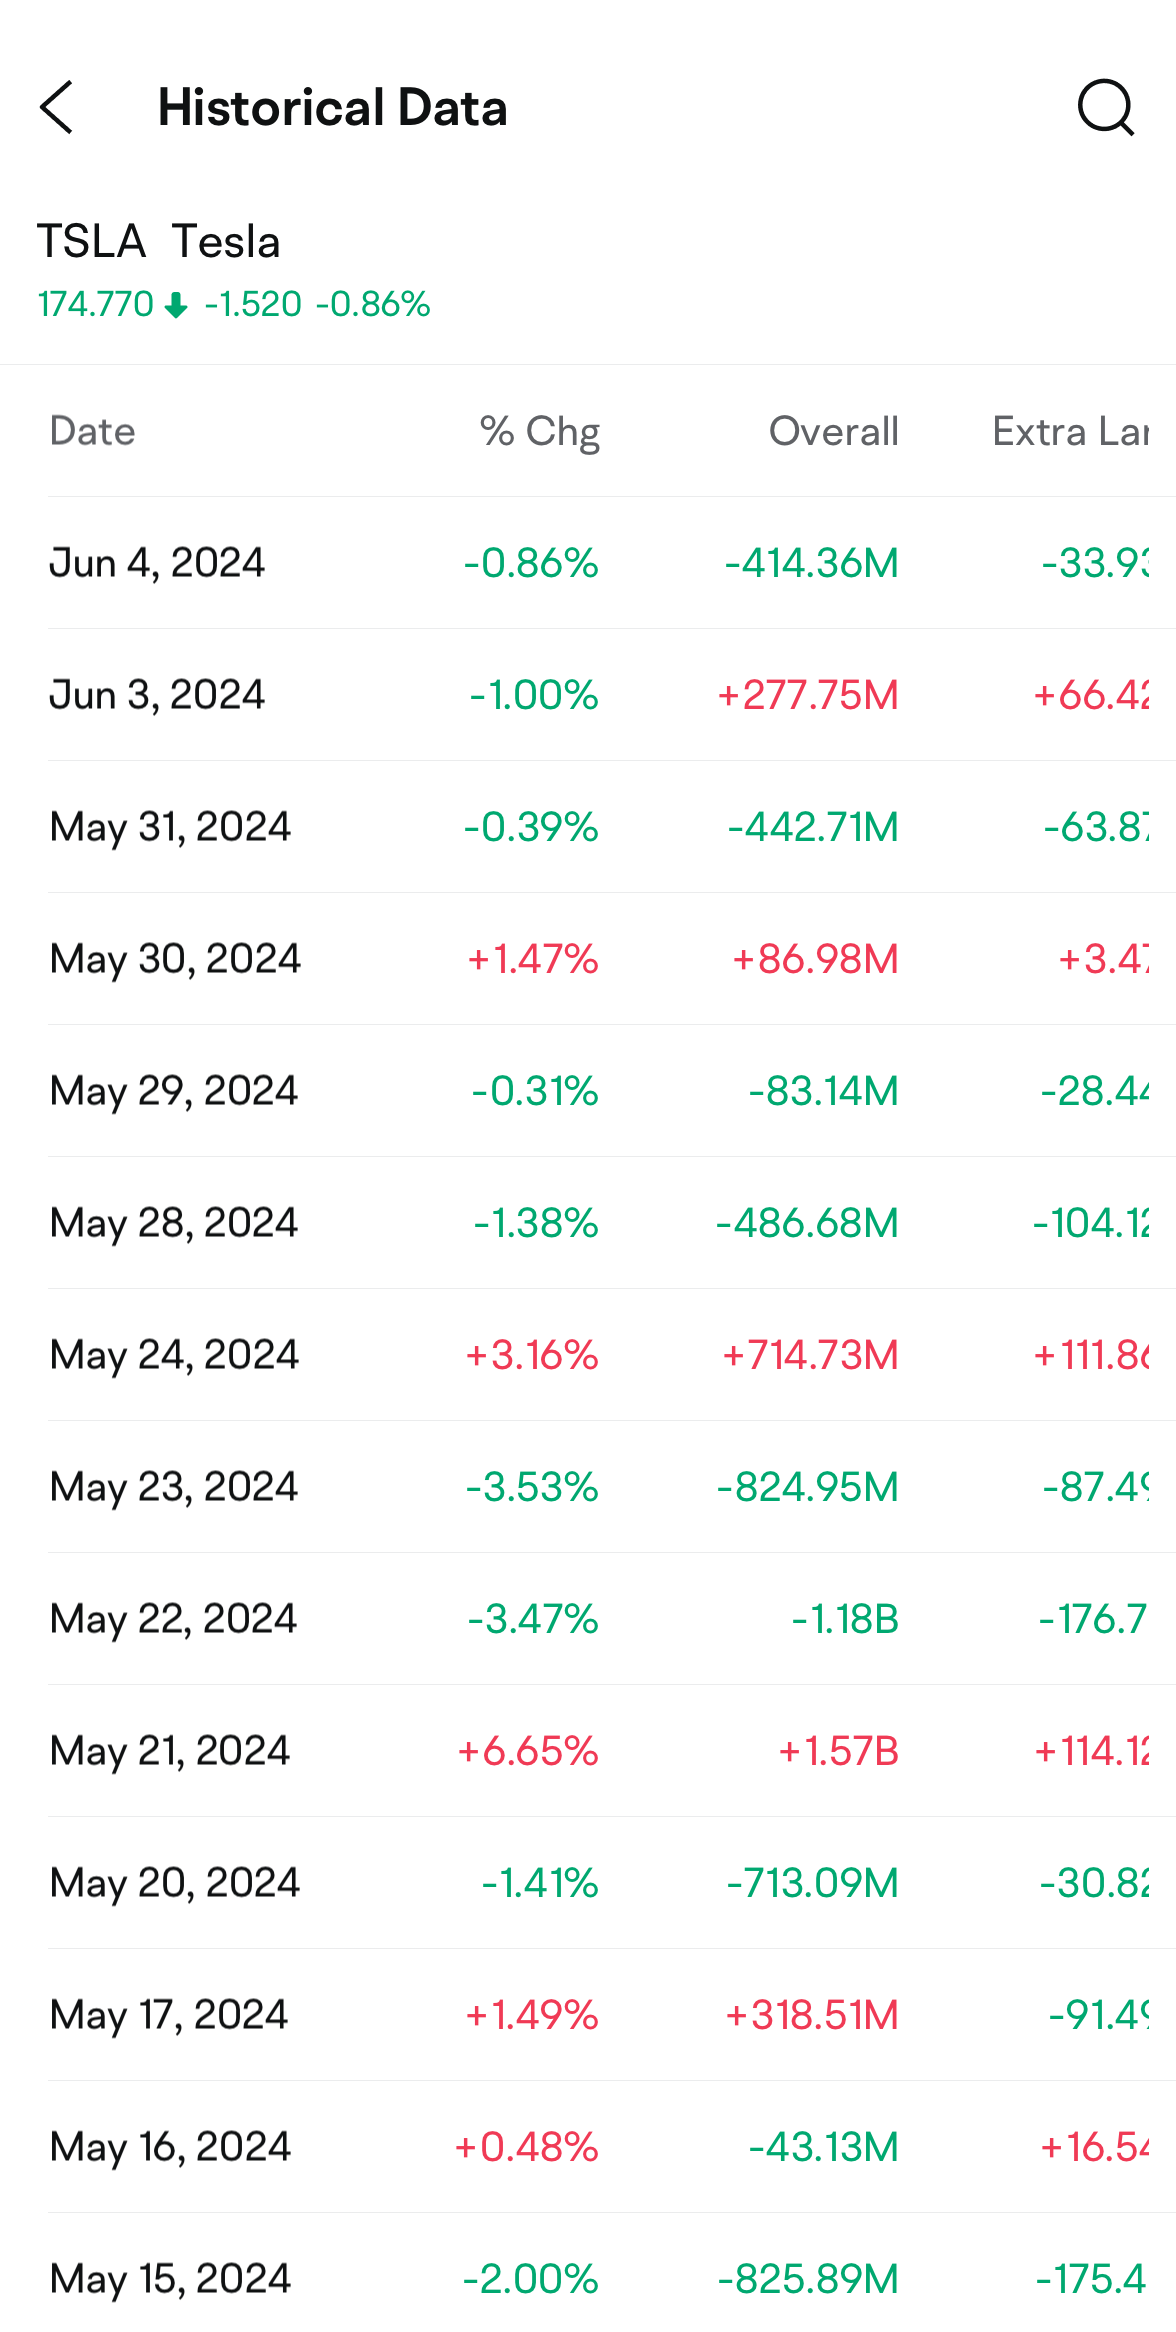
(This image provided may not be current and any securities are shown for illustrative purposes only.)
3. FAQs
3.1 How to divide the order size of capital?
The history ticker is sorted by transaction amount one by one, and the thresholds for extra large, large, medium, and small orders are divided proportionally.
3.2 How to divide the inflow and outflow capital?
If the stock is traded at the selling price or higher, it will be counted as an inflow of funds;
If the stock is traded at the purchase price or lower, it is counted as outflow;
The neutral market is not included in the capital flow.
3.3 How to calculate the net inflow and the block order net inflow?
Net Inflow = Inflow-Outflow
Block Order Net Inflow = Net Inflow Extra Large Orders + Net Inflow Large Orders
3.4 Why does the stock price of a certain stock rise, but its funds have a net outflow on that day?
Because the inflow and outflow of funds has nothing to do with the rise or fall of stock price.
For example:
(This image provided may not be current and any securities are shown for illustrative purposes only.)
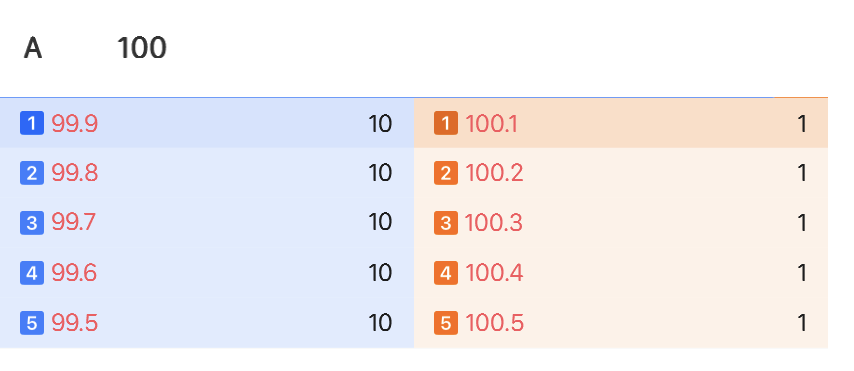
Example 1) The current stock price of a stock A is 100 $, and 10 shares are traded at 99.9 $.
99.9 $ is the purchase price, which is counted as the outflow capital. At this time, the net outflow capital is 999 $, the net outflow of funds and the stock price have fallen.
Example 2) It is also a stock A, the current stock price is 100 $, 10 shares are traded at 99.9 $, and 1 share is traded at 100.1 $.
99.9 $ is the buying price, which is counted as outflow; 100.1 $ is the selling price, which is counted as inflow capital; at this time, the net outflow capital is 898.9 $. At this time, there is a net outflow of funds and the stock price has risen.
This shows that the inflow and outflow of capital has nothing to do with the rise and fall of stock price.
This presentation is for informational and educational use only and is not a recommendation or endorsement of any particular investment or investment strategy. Investment information provided in this content is general in nature, strictly for illustrative purposes, and may not be appropriate for all investors. It is provided without respect to individual investors’ financial sophistication, financial situation, investment objectives, investing time horizon, or risk tolerance. You should consider the appropriateness of this information having regard to your relevant personal circumstances before making any investment decisions. Past investment performance does not indicate or guarantee future success. Returns will vary, and all investments carry risks, including loss of principal. Moomoo makes no representation or warranty as to its adequacy, completeness, accuracy or timeliness for any particular purpose of the above content.