Company valuation
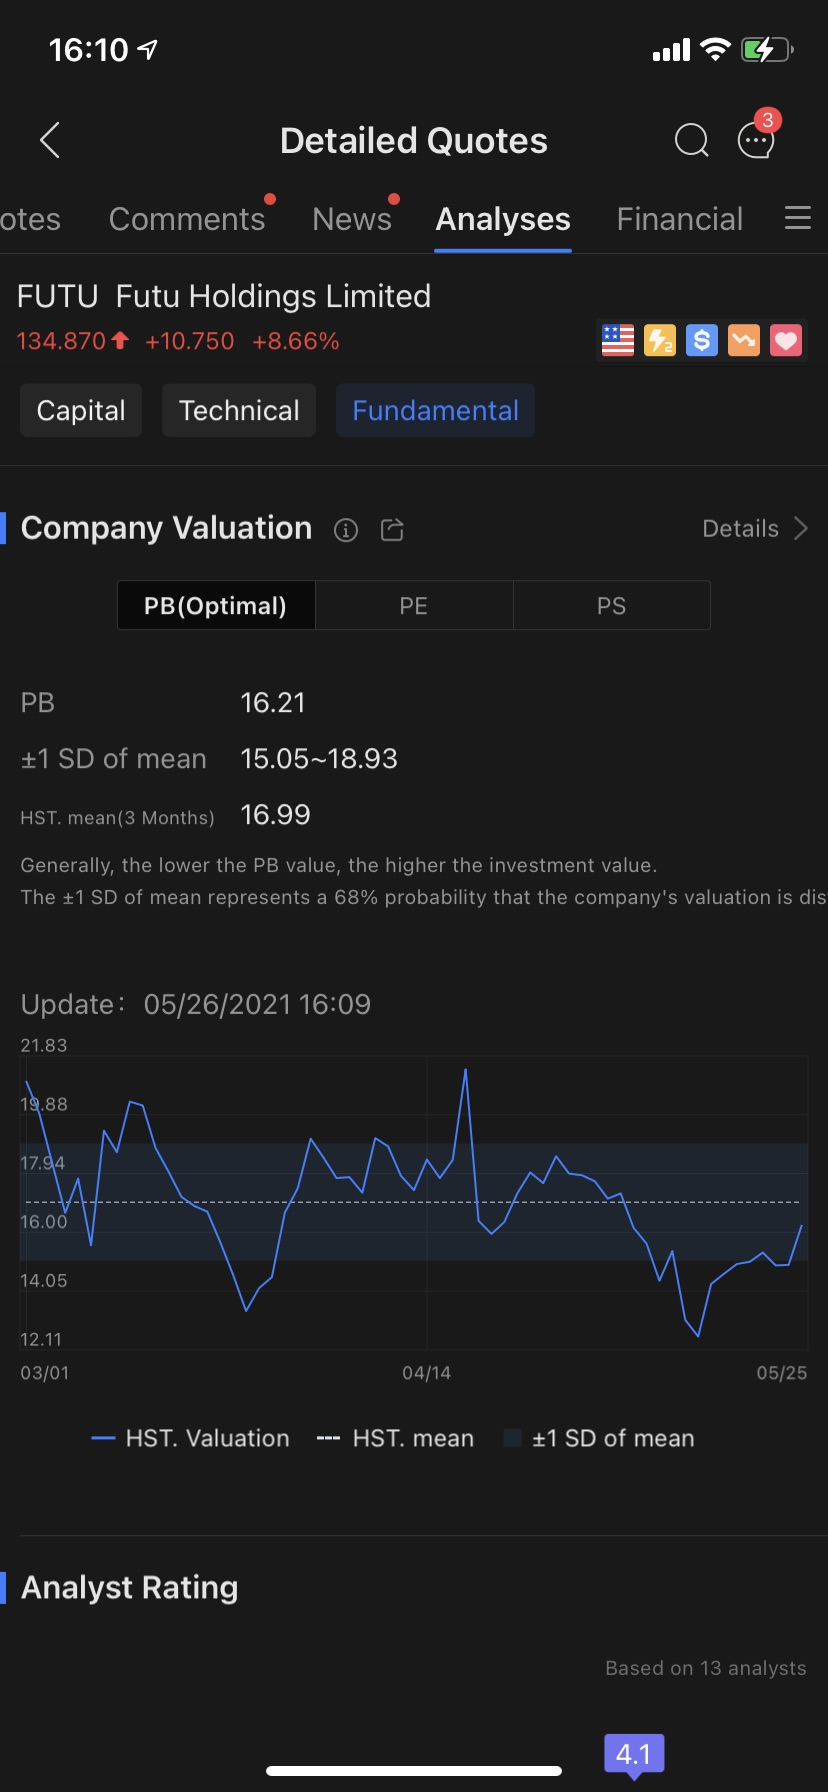
You can view company valuation on [Detailed Quotes]-[Analyses]-[Fundemental], as the following screenshot shows.
1. Model formula:
1.1 PE (P/E ratio TTM) = stock price / earnings per share (earnings per share = net profit attributable to shareholders of the parent company in the last 12 months / total number of shares)
1.2 PB (P/B ratio) = stock price / net asset per share (net asset per share = shareholders' equity / total number of shares)
1.3 PS (P/S ratio) = stock price / revenue per share (revenue per share = total revenue/ total number of shares)
Note: Generally, the lower the valuation, the higher the investment value.
2. Recommendation rule:
2.1 The PE model uses the net profit indicator to calculate the company's valuation, and is more suitable for companies that are stable and profitable.
2.2 The PS model uses the revenue indicator to calculate the company's valuation, which is more suitable for high-growth companies that are not profitable.
2.3 The PB model uses the net asset indicator to calculate the company's valuation. It is more suitable for companies with heavy assets and unstable earnings.
2.4 If none of the above conditions are met, the PS model is displayed by default.
2.5 The recommendation of valuation model is calculated by the system based on relevant financial indicators. This content is for reference only and does not constitute any investment advice.
3. Special instructions:
3.1 When the earnings per share or the net asset per share are negative, the calculated valuation is also negative and belongs to a loss state;
3.2 The calculation of industry(market) averages and industry(market) rankings has eliminated 「companies and numbers with negative valuations」.
This presentation is for informational and educational use only and is not a recommendation or endorsement of any particular investment or investment strategy. Investment information provided in this content is general in nature, strictly for illustrative purposes, and may not be appropriate for all investors. It is provided without respect to individual investors’ financial sophistication, financial situation, investment objectives, investing time horizon, or risk tolerance. You should consider the appropriateness of this information having regard to your relevant personal circumstances before making any investment decisions. Past investment performance does not indicate or guarantee future success. Returns will vary, and all investments carry risks, including loss of principal. Moomoo makes no representation or warranty as to its adequacy, completeness, accuracy or timeliness for any particular purpose of the above content.