

Moomoo Insights
Jul 16 15:38
TSMC Earnings: AI Demand Is Stronger Than the Chip Selloff Suggests
Moomoo Insights
Sep 30 05:04
Live Take | Anthropic’s $518B Compute Bet: Who Wins From the AI Buildout?
When trading an option strategy that involves multiple options, consider analyzing the differences between their implied volatility.
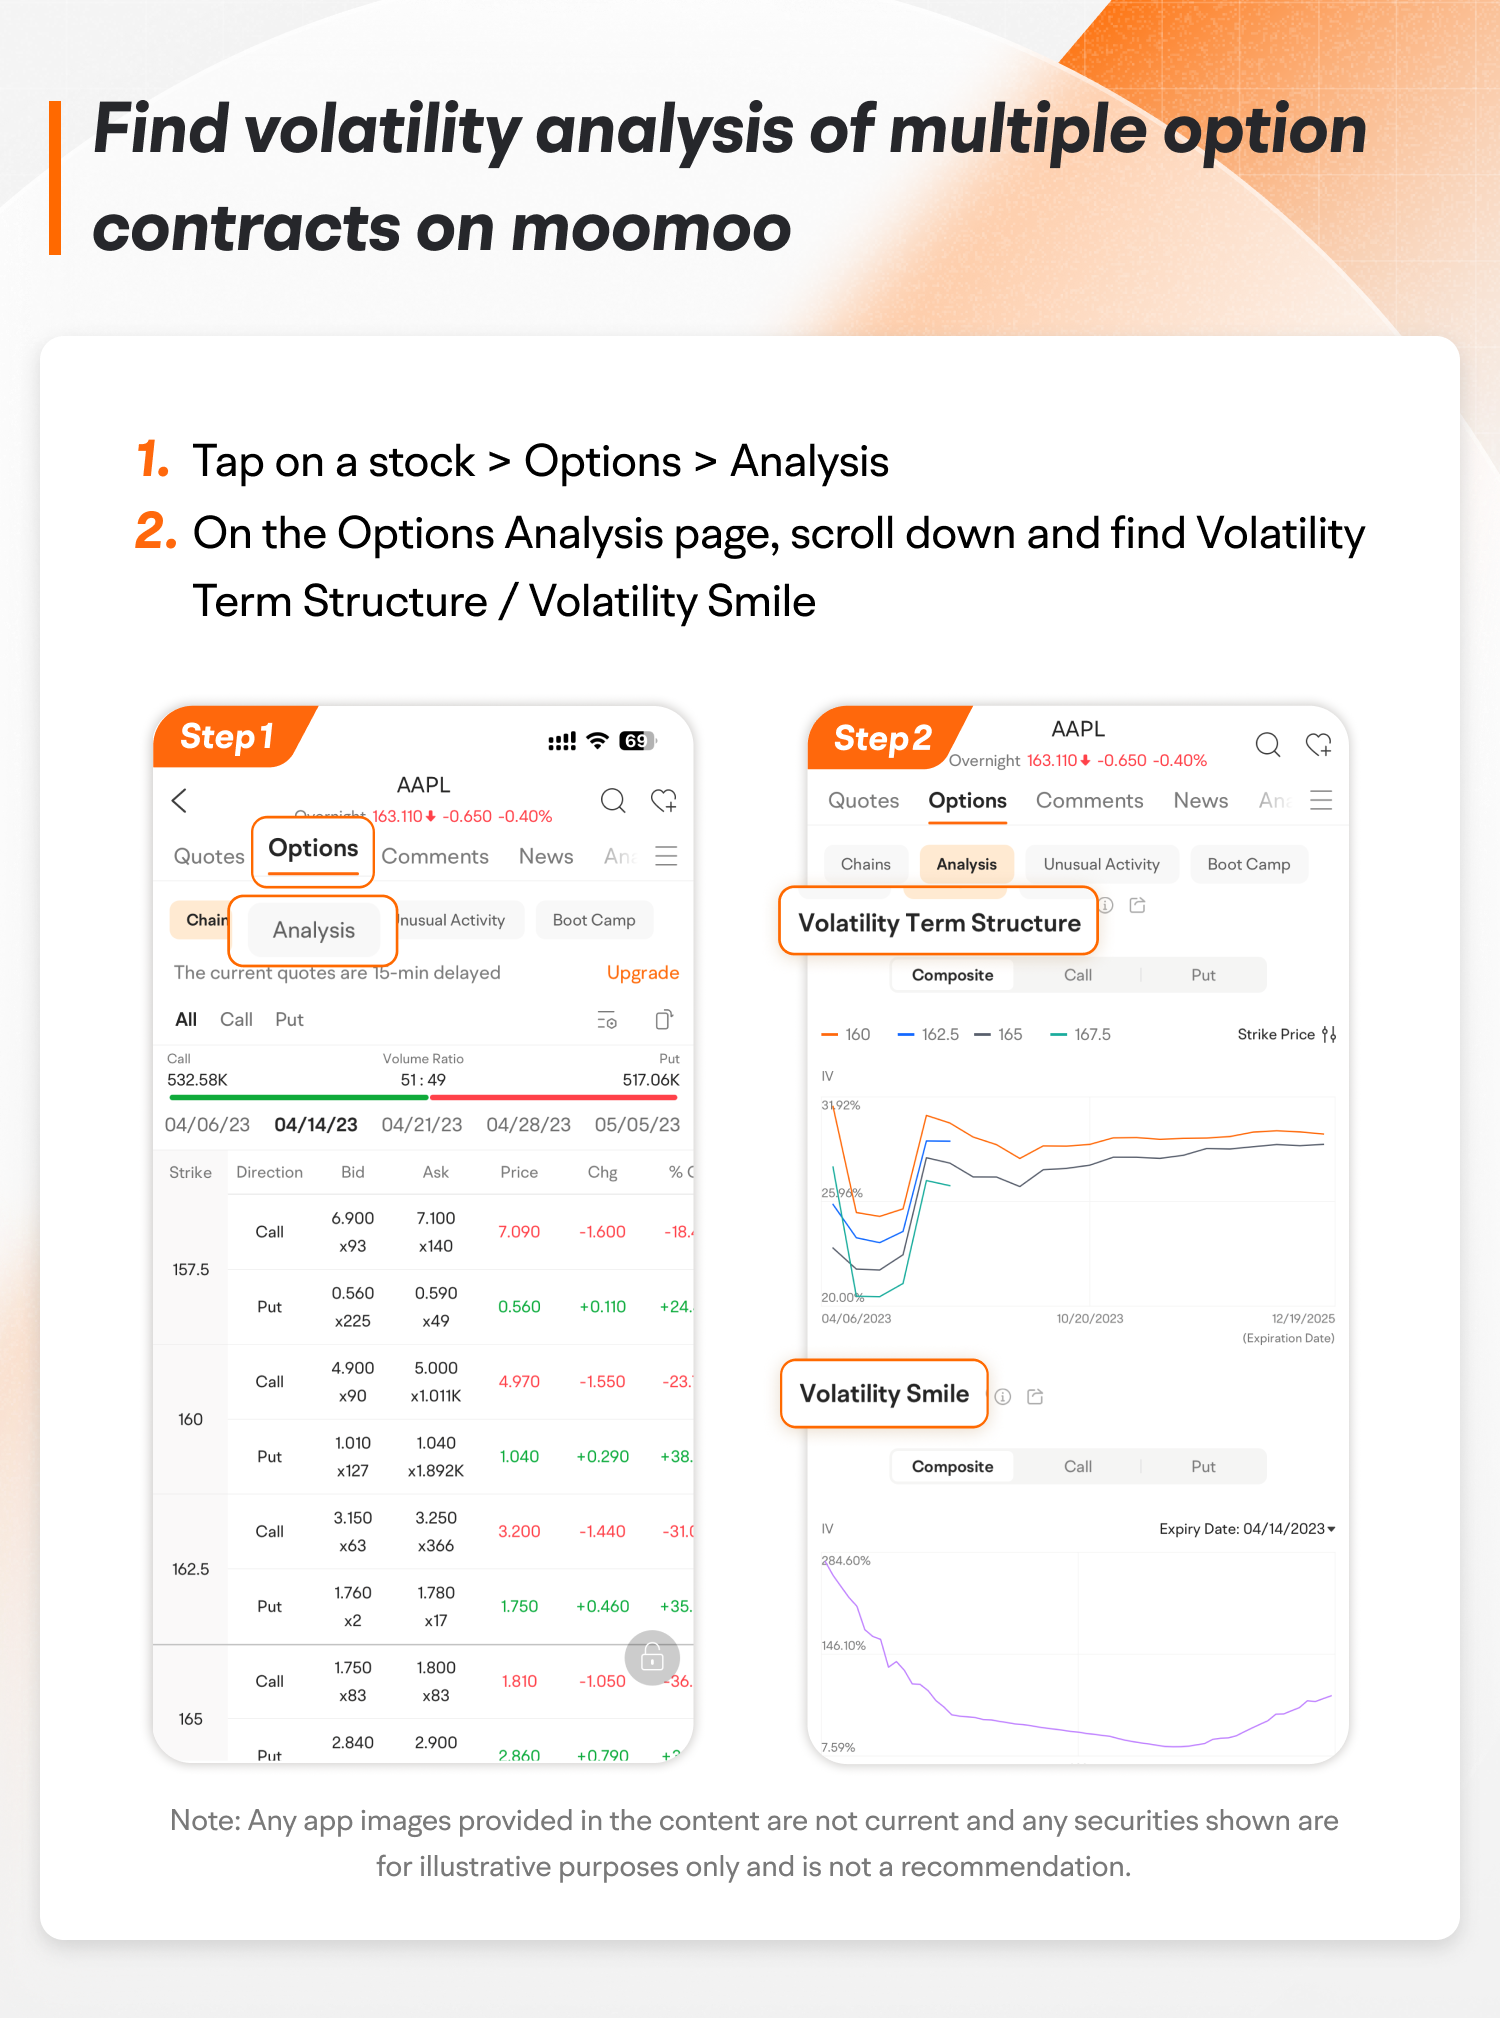
Find volatility analysis of multiple option contracts on moomoo
Step 1: Tap on a stock > Options > Analysis
Step 2: On the Options Analysis page, scroll down and find Volatility Term Structure / Volatility Smile
① Analyzing the Volatility Term Structure can be a useful tool when developing investment strategies.
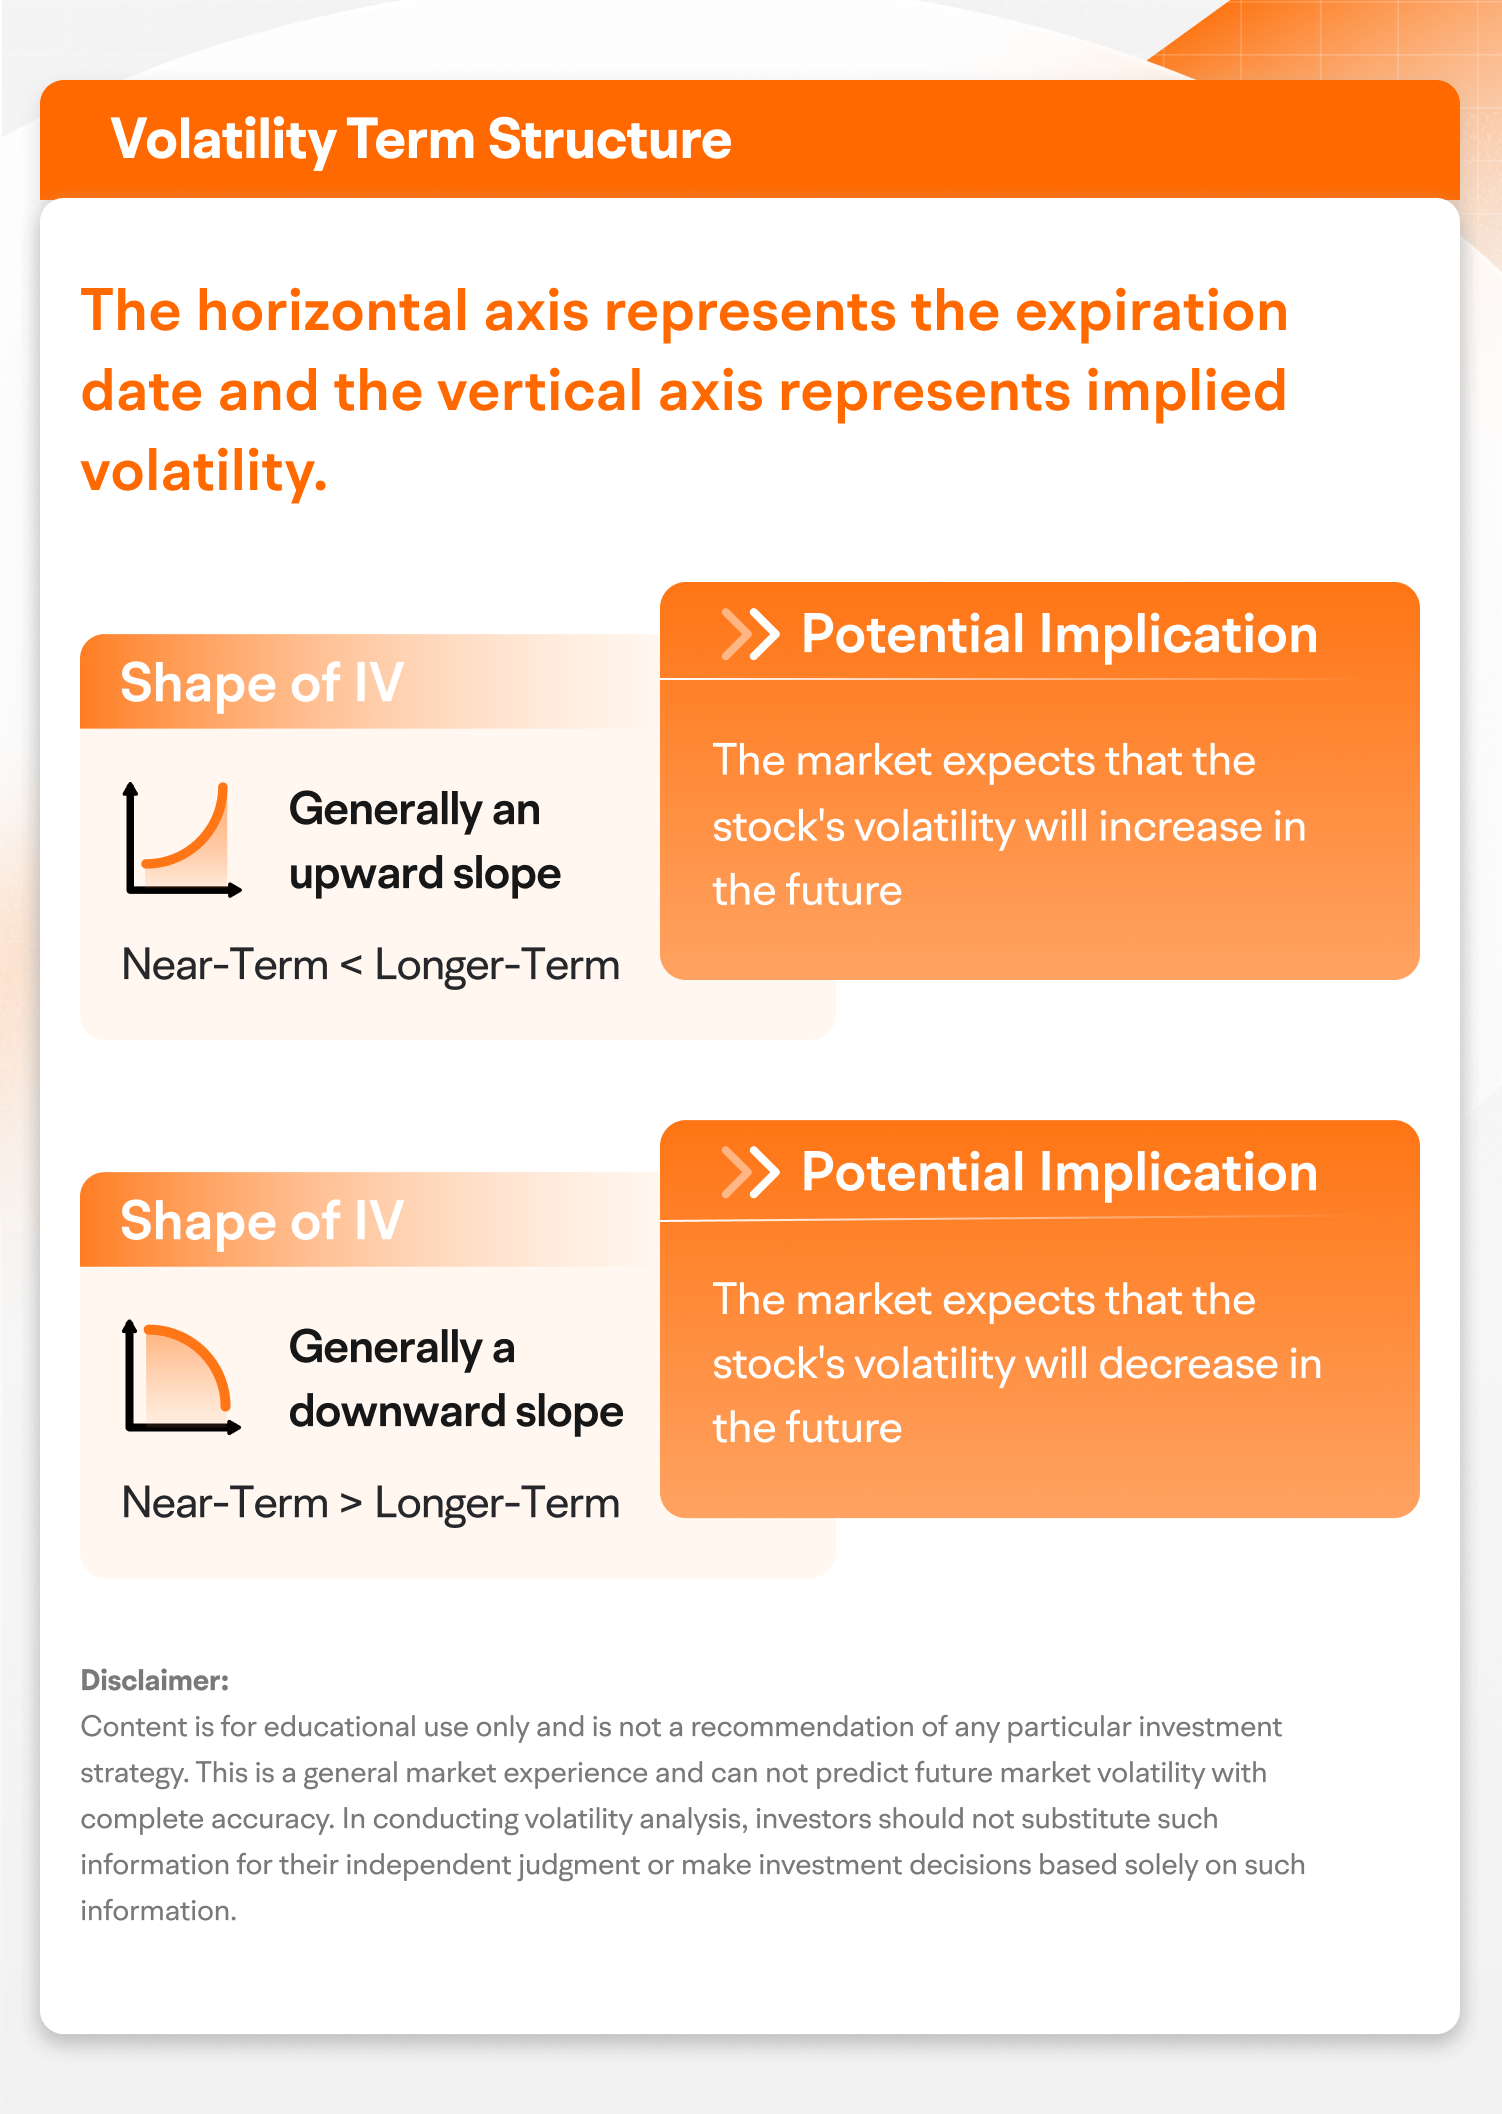
The volatility term structure refers to the different implied volatility of options on the same underlying asset but with different expiration dates, usually expressed as a curve.
There are two types of volatility term structures.
One is the contango structure, shown as the curve sloping upward. This structure suggests that the implied volatility of near-term options is lower than that of longer-term options. In other words, this structure implies that the market expects volatility to rise in the future.
The other type is the backwardation structure, shown as the curve sloping downward. This structure suggests that the implied volatility of near-term options is higher than that of longer-term options. In other words, the backwardation structure implies that the market expects volatility to fall in the future.
After analyzing the volatility term structure, you might identify a noticeable difference between the implied volatility of options with the same strike price but different expiration dates.
Thus, it could inform potential option strategies, such as calendar spreads, that align with anticipated changes in implied volatility over time.
② Analyzing the Volatility Smile Pattern can be a useful tool when developing investment strategies
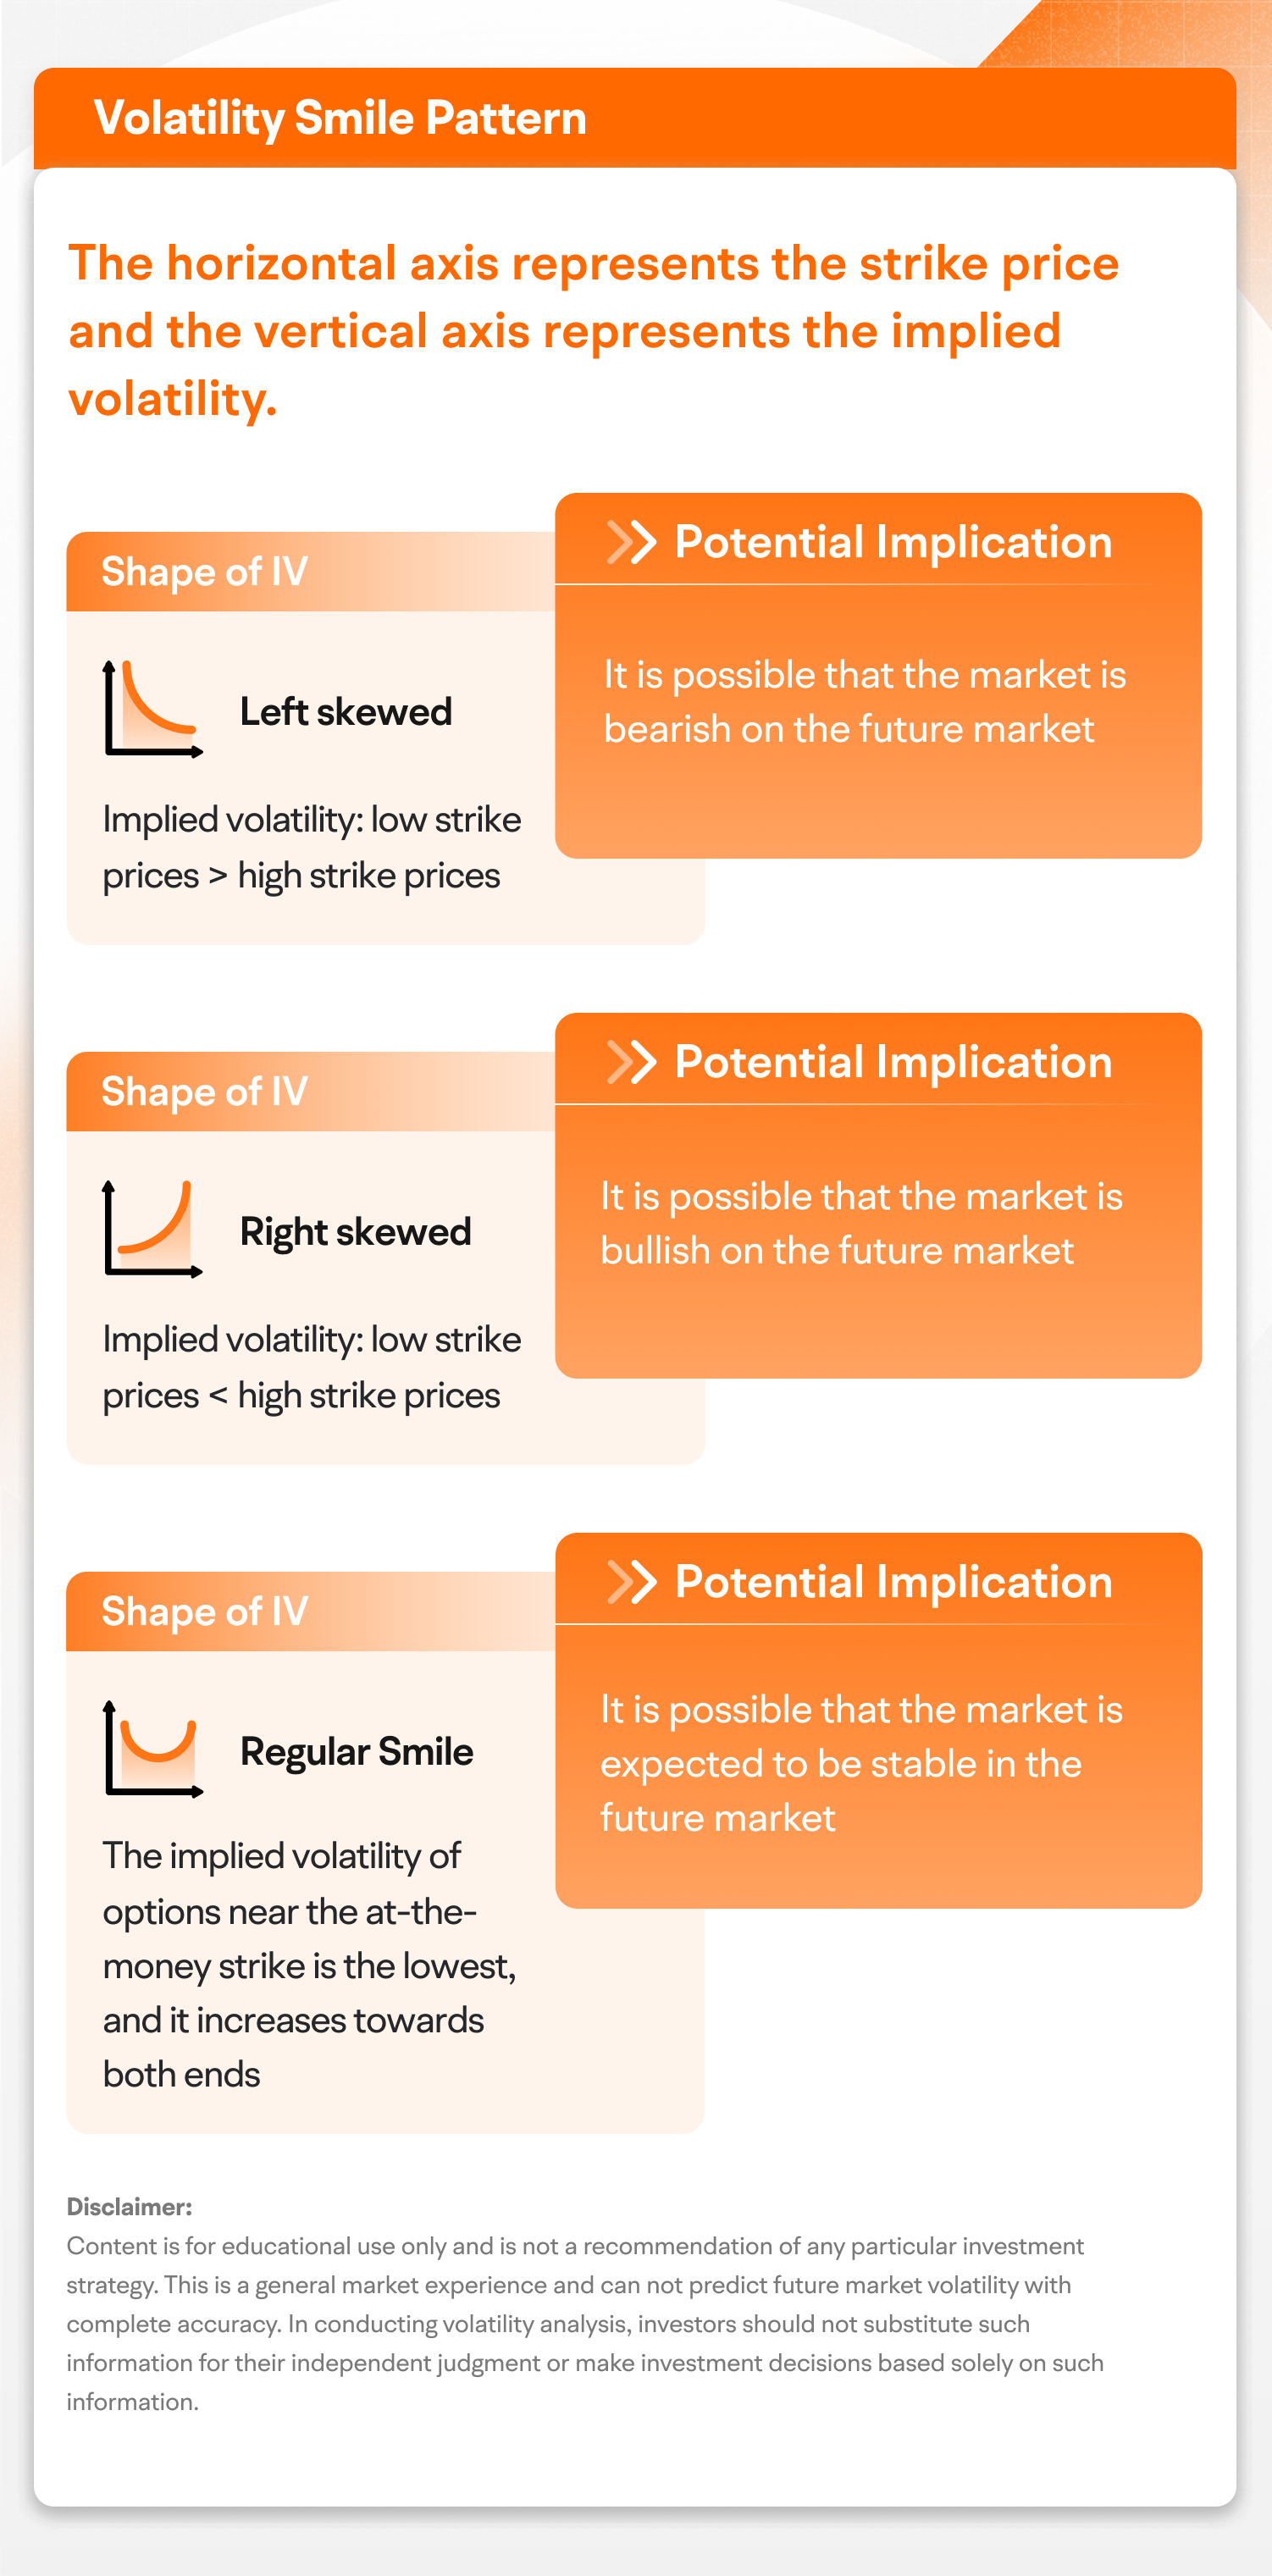
Volatility Smile refers to the implied volatility curve of options on the same expiration date.
The implied volatility corresponding to different strike prices are different, showing a smile-like shape.
Generally speaking, one of the major reasons for the formation of the volatility smile is the supply and demand of options with different strike prices in the market.
There are three types of implied volatility smile patterns: left skew, right skew, and smile.
By examining the implied volatility levels of options with different strike prices but the same expiration date, you could construct a vertical spread strategy that aligns with your outlook.
That's what today's lesson is all about. If you want to learn more about options, please follow [Moo Options Explorer] for timely updates!
This presentation is for informational and educational use only and is not a recommendation or endorsement of any particular investment or investment strategy. Investment information provided in this content is general in nature, strictly for illustrative purposes, and may not be appropriate for all investors. Read more
Recommend
Master 5 Terms to Read an Options Chain

Master these 5 terms to confidently read an options chain

Avoid the trap: don’t buy cheap options blindly

Exercise, Let expire or Close. Three Smart Moves
Avoid pitfalls: expiration choices explained
Open Interest Analysis: How to potentially grasp the market's capital flow?
moomoo Product Roadshow
The Most Expensive Lessons in Options
Educational Deep Dive Volatility, Greeks & Option Pricing
0DTE Tool, Hedge, or Speculation
10-Minute Guide to Understanding Options
How to Place Option Orders on Moomoo Desktop
Options Seller Dashboard:Quickly Find High-ROI Options Contracts
How to Analyze an Option in depth
Understanding Options : A Beginner's Guide
Top 0DTE Options by Volume: Start Trading Mag 7 Stock Options Today
Volatility Analysis: IV / HV / IV Rank / IV Percentile
Gamma Exposure (GEX): Understanding Dealer Hedging Flows, and Key Levels
Volatility Analysis: How to estimate an option's value more accurately?
Options Unusual Activity: how to potentially monitor the moves of institutional investors
Options Ticks: Capture real-time options market actions
Options Price Calculator: How to calculate the future price of an option
Options P/L Curve Tutorial: Simulate your Options Trade to Visualize Potential Profit and Loss
Volatility Analysis: Volatility Term Structure / Volatility Smile
Understanding Call and Put Options
Master 5 Terms to Read an Options Chain
Master these 5 terms to confidently read an options chain
Avoid the trap: don’t buy cheap options blindly
Exercise, Let expire or Close. Three Smart Moves
Avoid pitfalls: expiration choices explained
Open Interest Analysis: How to potentially grasp the market's capital flow?
moomoo Product Roadshow
The Most Expensive Lessons in Options
Educational Deep Dive Volatility, Greeks & Option Pricing
0DTE Tool, Hedge, or Speculation
10-Minute Guide to Understanding Options
How to Place Option Orders on Moomoo Desktop
Options Seller Dashboard:Quickly Find High-ROI Options Contracts
How to Analyze an Option in depth
Understanding Options : A Beginner's Guide
Top 0DTE Options by Volume: Start Trading Mag 7 Stock Options Today
Volatility Analysis: IV / HV / IV Rank / IV Percentile
Gamma Exposure (GEX): Understanding Dealer Hedging Flows, and Key Levels
Volatility Analysis: How to estimate an option's value more accurately?
Options Unusual Activity: how to potentially monitor the moves of institutional investors
Options Ticks: Capture real-time options market actions
Options Price Calculator: How to calculate the future price of an option
Options P/L Curve Tutorial: Simulate your Options Trade to Visualize Potential Profit and Loss
Volatility Analysis: Volatility Term Structure / Volatility Smile
Understanding Call and Put Options