Hammer Candlestick: A Guide for Malaysian Traders
What is a Hammer Candlestick?
Traders frequently utilize the Hammer Candlestick, a particular kind of candlestick pattern, to detect possible trend reversals within a declining market.
It is particularly useful in technical analysis and is considered a bullish signal, indicating that the price may be reaching a bottom and could reverse to move upwards.
An inverted hammer is another related candlestick pattern that acts as a bullish reversal signal following a downtrend. It features a small body at the candle's lower end and a long upper wick, indicating the rejection of lower prices.
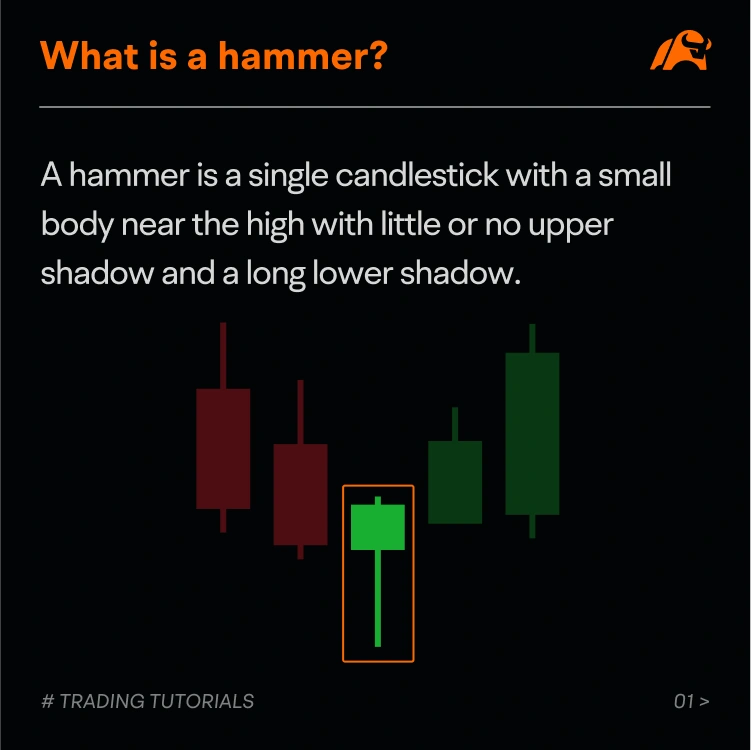
The Hammer pattern is characterized by a small real body at the top of the candle, with a long lower wick or shadow. The real body can be either red (bearish) or green (bullish), but the color is less important than the length of the wick. The long lower wick represents a period of selling pressure that was ultimately rejected by the market, as indicated by the small body at the top. This suggests that buyers were able to step in and push the price back up, potentially signaling a reversal from a downtrend.
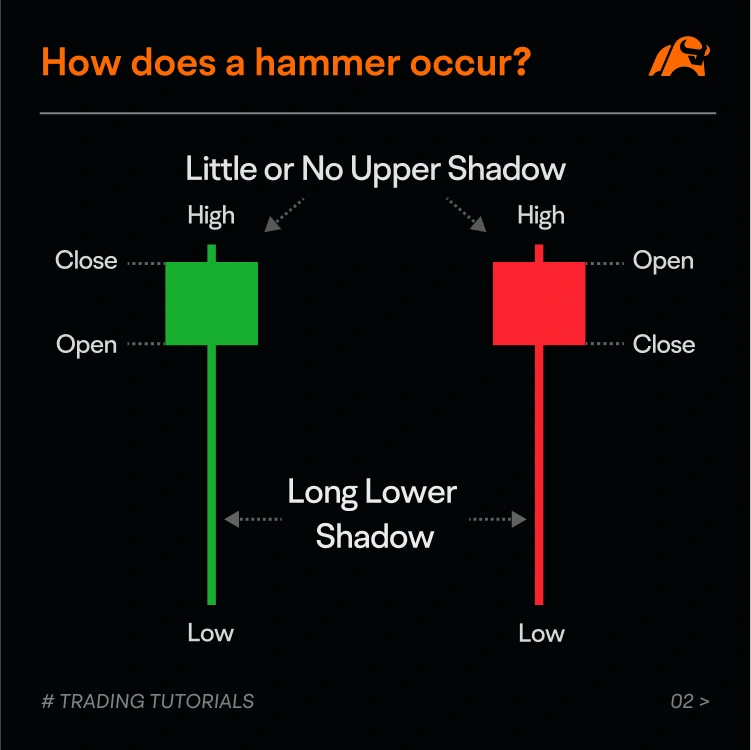
Traders often look for the Hammer pattern to confirm a reversal, especially when it appears after a significant drop in price. However, it’s important to use additional confirmation, such as other technical indicators or a subsequent bullish candlestick, to increase the reliability of the signal.
Definition and Structure
The Hammer candlestick pattern is a technical trading pattern that occurs when a security trades significantly lower than its opening price, but then rallies to close near its opening price. This pattern is characterized by a small real body at the top of the range and a long lower shadow that is at least twice the size of the real body. The long lower shadow indicates that the price dropped significantly during the trading period, but the buyers were able to push the price back up to close near the opening price.
The structure of a Hammer candlestick pattern is as follows:
A small real body at the top of the range
A long lower shadow that is at least twice the size of the real body
Little or no upper shadow
The color of the real body can be either red or green, but the green body is considered more bullish
The Hammer candlestick pattern is considered a bullish reversal signal, indicating that the downtrend is coming to an end and that an upside reversal will shortly follow. It shows that buyers are gaining strength and starting to overwhelm the sellers, which could lead to a trend reversal.
It’s worth noting that the Hammer candlestick pattern is not a guarantee of a trend reversal, and it should be used in conjunction with other technical analysis tools and indicators to confirm the signal.
Key Characteristics of a Hammer Candlestick
The Hammer Candlestick is a significant pattern in candlestick charting that traders use to spot potential trend reversals, particularly from a downward trend to an upward one. Here are the key characteristics that define a Hammer Candlestick:
Small Real Body: The real body of the Hammer is typically small, representing a period of indecision. It is located at the top of the candle, which is indicative of a bullish signal when found at the bottom of a downtrend.
Long Lower Shadow (Wick): The most distinctive feature of a Hammer is its long lower shadow, which is at least twice the length of the real body. This shadow signifies that the price dropped significantly during the session but was ultimately pushed back up, suggesting strong buying pressure.
Short or Absent Upper Shadow: The upper shadow, or wick, is usually short or nonexistent. This lack of an upper shadow reinforces the idea that the selling pressure was not strong enough to keep the price down.
Color: While the color of the real body is not as critical as its size, a green Hammer is generally more significant when it appears after a downtrend, as it represents a closing near the high of the session.
Location: The Hammer is most effective when it appears after a significant decline in price. It is often found at the end of a downtrend, suggesting that the bears have lost control and the bulls are starting to take over.
Confirmation: While the Hammer is a bullish reversal signal, it is always wise to seek confirmation from other technical indicators or subsequent price action. A confirmation could be a higher open on the next candle or a break above a recent high.
Volume: In some markets, particularly those that track volume, a Hammer formed on higher than average volume can be considered more reliable, as it suggests strong buying interest.
Shooting Star: The Shooting Star is a bearish reversal pattern that forms at the peak of an uptrend. It is characterized by a small real body at the bottom and a long upper wick, indicating that buyers have failed to maintain momentum and prices may soon decline.
Understanding these characteristics is crucial for traders to identify Hammer Candlesticks correctly and use them effectively in their trading strategies. If you’re interested in exploring other common candlestick patterns or want to see examples of Hammer Candlesticks in action, you can visit the moomoo official website for related courses that delve deeper into these topics. There, you’ll find comprehensive materials and educational resources designed to enhance your trading knowledge and skills.
How to Trade Using the Hammer Candlestick in Malaysia
Trading using the Hammer Candlestick in Malaysia, or anywhere else, involves several key steps:
1. Identify the Hammer Candlestick
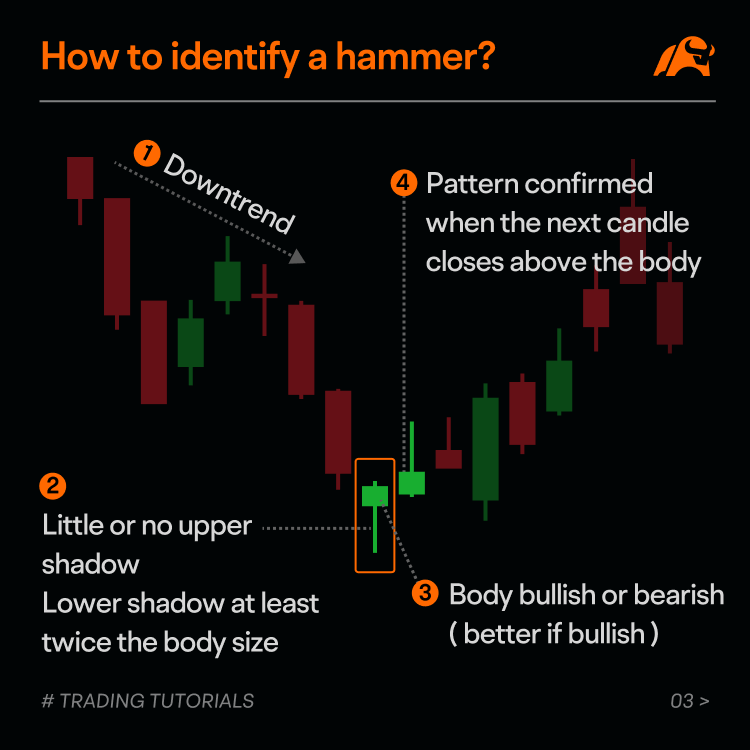
Look for a small body at the top of the candle with a long lower shadow, at least twice the length of the body. The color of the body is less important, but a green (bullish) hammer is stronger than a red (bearish) one.
2. Confirmation of the Pattern
Wait for the next candle to close above the hammer's closing price to confirm the reversal. This confirmation indicates that buying pressure is strong enough to continue the upward movement.
3. Entry Point
Consider entering a long position after the confirmation candle has closed above the hammer's close. Some traders may wait for additional confirmation from other technical indicators or a break above a nearby resistance level.
4. Stop-Loss
Set a stop loss below the low of the hammer's shadow to protect your trade. This level acts as a safety net in case the market moves against your position.
5. Profit Targets
Determine your profit targets based on the chart setup, such as previous resistance levels that may now act as support, or using a risk-reward ratio that aligns with your trading strategy.
6. Use in Conjunction with Other Indicators
The hammer is more reliable when used with other technical analysis tools like moving averages, RSI, or Fibonacci retracements. These can provide additional context and increase the confidence in the trade setup. For instance, if the RSI indicates an oversold condition when a Hammer forms, it strengthens the bullish signal.
7. Monitor and Adjust
Keep an eye on the trade and be ready to adjust your stop loss and profit targets as the market moves. Trailing stops can be used to lock in profits while allowing the trade to run.
8. Psychological Factors
Remember that trading involves psychological discipline. Stick to your trading plan, and don't let emotions like fear or greed influence your decisions.
In Malaysia, as in any market, these steps can help traders use the hammer candlestick pattern to their advantage. However, it's important to remember that no trading pattern is foolproof, and using them requires experience and understanding of the market's broader context.
Advanced Tips for Using Hammer Candlesticks in Malaysia

1. Use Multiple Timeframes
Analyze the Hammer pattern across different timeframes to gain a more comprehensive view of the market. This can help in identifying the pattern's significance within the broader market context.
2. Incorporate Elliott Wave Theory
Integrating Elliott Wave analysis with Hammer patterns can provide a deeper understanding of the market trend, aiding in more informed trading decisions .
3. Consider Market Sentiment
The impact of market sentiment on price movements should not be overlooked. Analyzing the Hammer pattern in the light of current market sentiment can help in reducing risk and improving profitability.
4. Employ Pattern Recognition Algorithms
For automated trading, use algorithms that can recognize the Hammer pattern and execute trades based on predefined rules. This can include trading only Hammers that form at specific support levels and under the right market conditions.
5. Backtest and Optimize Strategies
Backtesting the Hammer pattern strategy using historical data can help in fine-tuning the approach. This allows traders to see how the strategy would have performed under various market conditions and make necessary adjustments.
6. Real-Time Examples and Case Studies
Study real-life examples of successful Hammer pattern trades to understand how the pattern can be effectively used in different market scenarios. This practical knowledge can help traders refine their strategies and improve outcomes.
7. Risk Management
Implement strict risk management practices when trading with the Hammer pattern. This includes setting realistic profit targets, stop-loss levels, and ensuring that the size of each trade is appropriate to the trader's overall capital.
8. Avoid Common Mistakes
Be aware of common pitfalls in Hammer trading, such as relying solely on the pattern without confirmation or ignoring the overall market context. By avoiding these mistakes, traders can improve the effectiveness of their trading strategies.
9. Understand the Pattern's Limitations
Recognize that the Hammer pattern is not foolproof and can sometimes produce false signals. It is important to use it as part of a broader analysis that includes other technical tools and market indicators.
By incorporating these advanced tips, Malaysian traders can better leverage the Hammer candlestick pattern to make informed and profitable trading decisions. Remember, the key to successful trading is to use a combination of analysis methods and to always manage risk appropriately.
Conclusion

The Hammer candlestick is a valuable indicator for Malaysian traders, signaling potential market reversals. For effective use, combine it with other technical analysis tools and always adhere to sound risk management practices. Remember, a successful trading strategy is built on a foundation of knowledge, experience, and discipline.
This presentation is for informational and educational use only and is not a recommendation or endorsement of any particular investment or investment strategy. Investment information provided in this content is general in nature, strictly for illustrative purposes, and may not be appropriate for all investors. Read more