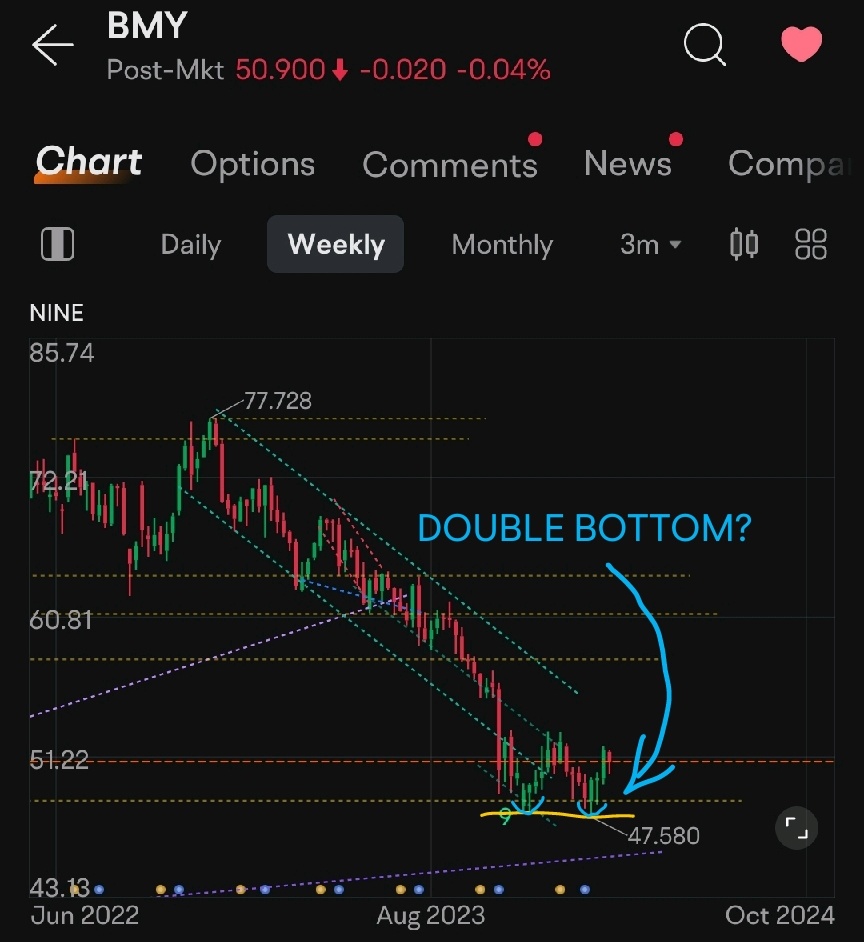
It is starting to look like a double bottom on the weekly candles.
The price action of BMY is finding support near the 47.50 price point. It appears to be forming a double bottom on the charts so far.

There is a bullish divergence on several of the popular oscillating indicators for the weekly candles. The major indicators for the daily candles, like RSI and MACD, are all officially in bullish territory.

Ultimately, the price would need to climb out of the trading range it has been in and above the trending resistance level that has held the price down for quite a while.
With the large amount of volume building up over the past several weeks, it appears that we are seeing investors accumulating shares at these relatively low prices. This could be a positive indication that investors are seeing potential upside in the future.

The price could always stay within this trading range for a while. If that proves to be the case, then the idea would be to buy at support and sell at resistance of the range. But if there is a breakout to the upside, then personally, I will be entering into long positions at that point.
$Pfizer(PFE.US$ $Eli Lilly and Co(LLY.US$ $AbbVie(ABBV.US$ $AstraZeneca(AZN.US$ $Bright Minds Biosciences(DRUG.US$ $The Health Care Select Sector SPDR® Fund(XLV.US$ $SPDR S&P 500 ETF(SPY.US$ $Invesco QQQ Trust(QQQ.US$ $SPDR Dow Jones Industrial Average Trust(DIA.US$ $Spdr Series Trust Spdr S&P Pharmaceuticals Etf(XPH.US$
Disclaimer: Community is offered by Moomoo Technologies Inc. and is for educational purposes only.
Read more
Comment
Sign in to post a comment

Nederhoed : Tomorrow should go
SpyderCallOP Nederhoed: hopefully. I hope it does not stay within the trading range it has been in for a while