Understanding balance sheets: how to assess a company’s risk
Why options traders should care about balance sheets
Options trading often focuses on short term price moves and market sentiment, but a company’s financial position still matters.
The balance sheet shows what a company owns, what it owes, and the value left for shareholders. Think of it as a financial health check. It helps you understand how resilient a business is and where potential risks may sit.
For options traders, this is useful in two key ways:
From a seller’s perspective
If you are selling put options to collect premium, you are taking on the risk of buying the stock if its price falls. If the company runs into financial trouble, you could end up holding a weak asset at an unfavourable price. A quick balance sheet check can help you avoid this.
From a buyer’s perspective
If a company’s financial position is deteriorating, particularly its ability to meet short term obligations, that can present opportunities to use bought put options to position for downside.
Three quick checks to assess financial strength
You do not need to go through an entire annual report. These three metrics can give you a solid read in just a few minutes.
1. Current ratio: short term safety
Formula: current assets ÷ current liabilities
This measures whether a company has enough short term assets, such as cash and receivables, to cover its short term obligations.
Above 1.5: generally low short term risk
Between 1 and 1.5: acceptable but worth monitoring
Below 1: higher risk, may struggle to meet obligations
2. Quick ratio: immediate liquidity
Formula: (cash + short term investments + receivables) ÷ current liabilities
This is a stricter version of the current ratio, as it excludes inventory and other less liquid assets. It focuses on how much readily available cash the company has.
1 or higher: strong liquidity position
Below 1: potential pressure in a stressed environment
3. Debt to asset ratio: long term risk
Formula: total liabilities ÷ total assets
This shows how much of the company is funded by debt. Higher levels of debt can increase risk, particularly in weaker market conditions.
Benchmarks vary by industry:
Financials & real estate (e.g., banks, insurers, broker-dealers; business-model driven): a 85%–95% debt ratio is often normal. Banks are commonly 90%–95%; above 95% warrants caution.
Tech / software / internet (asset-light, strong cash flows): typically below 30% is safer; the U.S. tech median is ~18.7%.
Example: balance sheet risk check
Using a simplified example from a large financial institution:
Current assets: ~US$120 billion
Current liabilities: ~US$95 billion
Current ratio: around 1.26
This sits in a moderate range, which can be acceptable for banks given their business model and liquidity structure.
Debt to asset ratio: around 75 percent
This is typical for the sector and generally considered manageable.
Takeaway: the company shows reasonable short term liquidity and industry appropriate leverage, making it a more stable candidate from an options perspective.
A simpler way to analyse balance sheets
You do not need to rely on complex reports to get a clear picture.
With the Company Fundamentals Hub, you can quickly review:
✅ Key financial metrics such as current ratio, quick ratio and debt levels
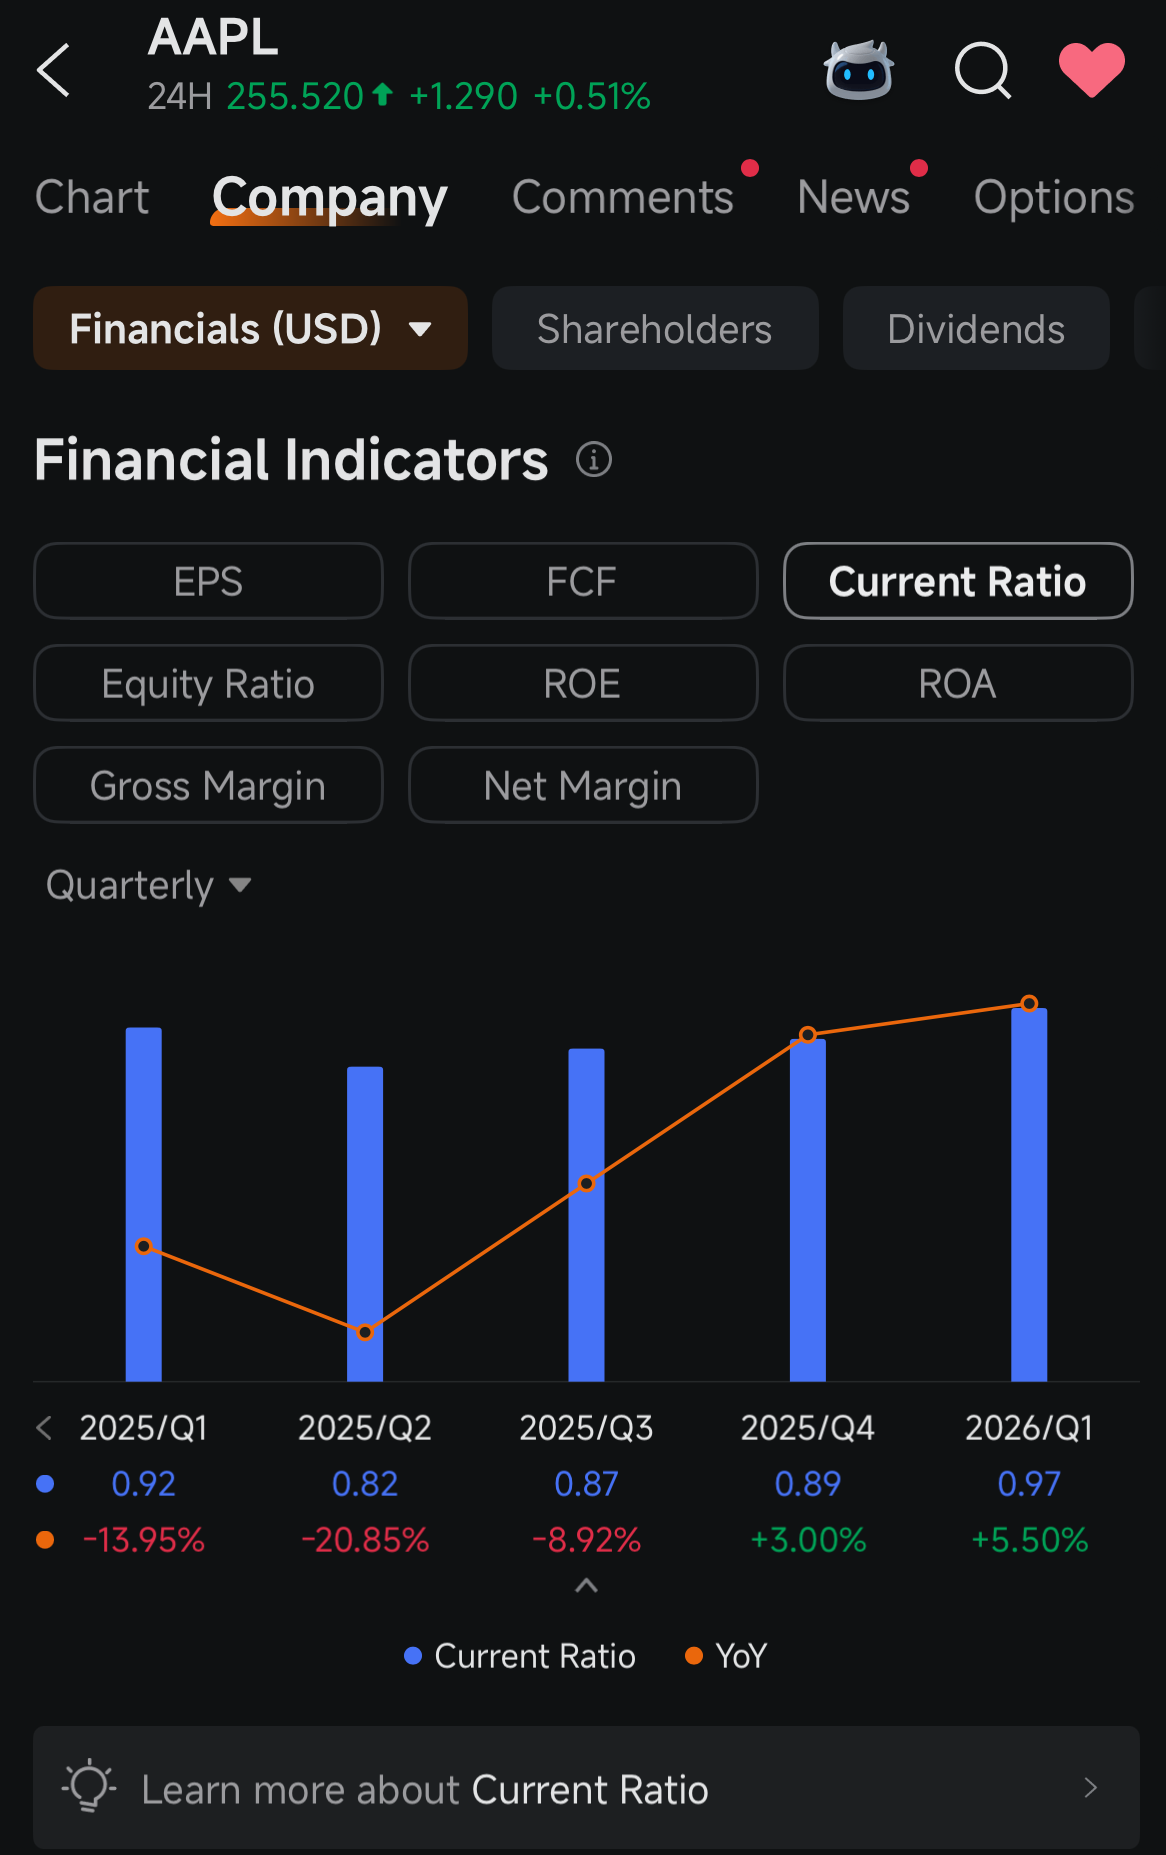
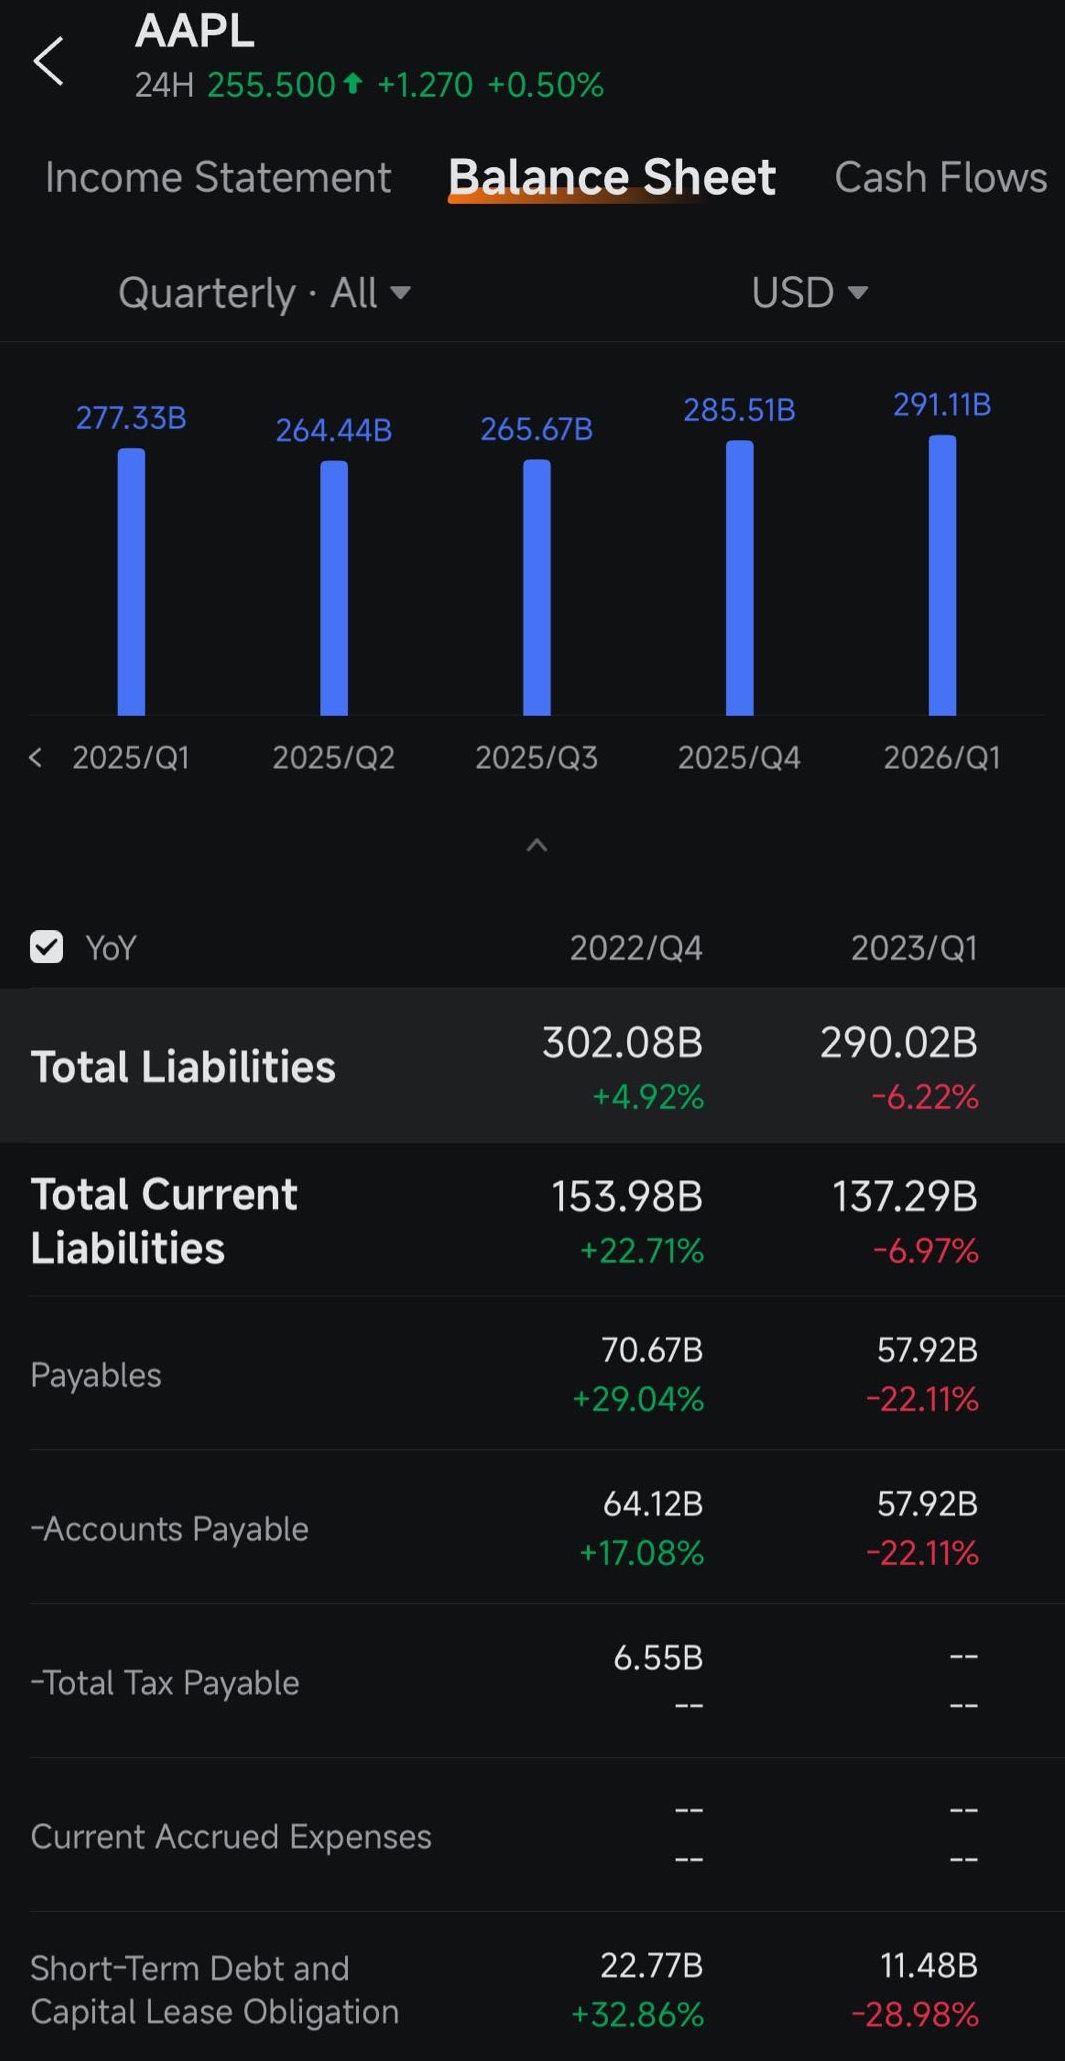
✅ Detailed balance sheet items with clear charts and trends over time
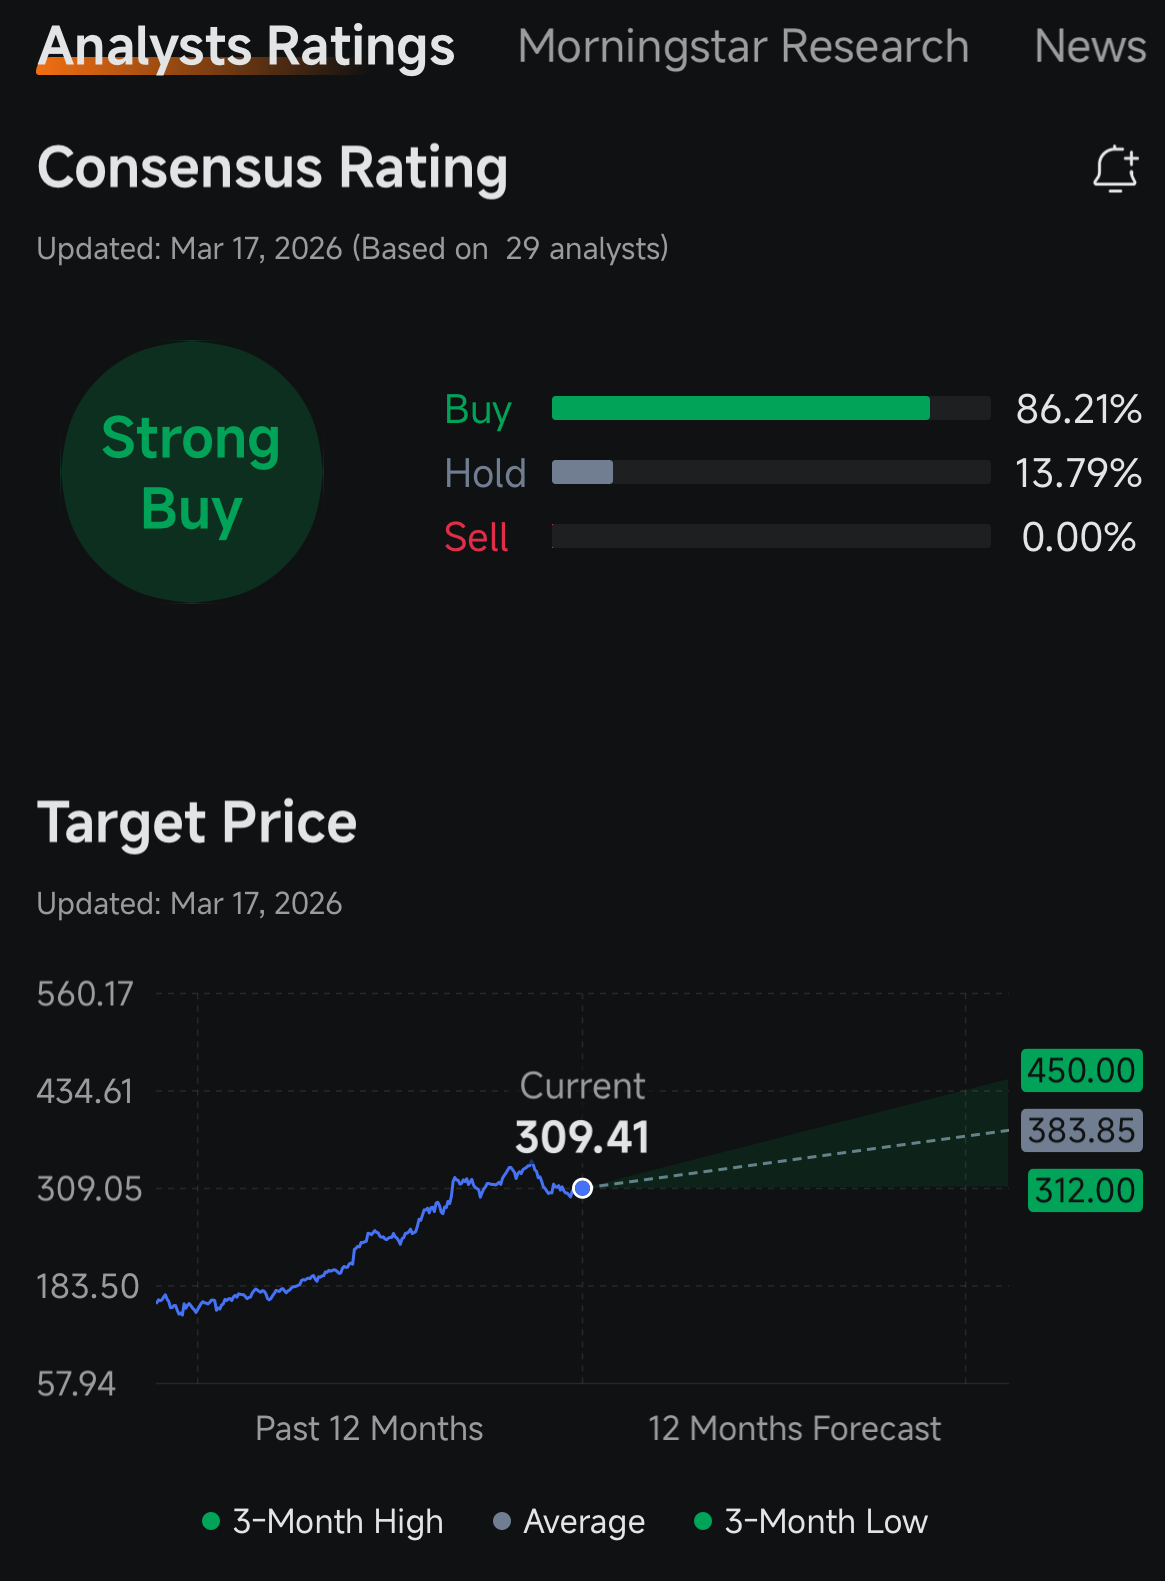
✅ Analyst ratings and consensus views, including target prices and sentiment
Balance sheets are a core part of understanding risk.
For options traders, they provide context behind the price action and help you avoid unnecessary exposure to weak businesses. Used alongside market trends and sentiment, they can support more informed and consistent decision making.
Building this habit will make your overall options strategy more resilient.
This presentation is for informational and educational use only and is not a recommendation or endorsement of any particular investment or investment strategy. Investment information provided in this content is general in nature, strictly for illustrative purposes, and may not be appropriate for all investors. Read more