Trend Projection: Your Smart Investment Assistant
Do you believe that "history repeats itself," yet still struggle to find patterns in endless candlestick charts and technical indicators to predict short-term stock price movements?
Now, your AI investment assistant is here!moomoo's Trend Projection feature uses AI technology to analyze vast amounts of historical candlestick data.
In just 1 second, it shows you how "history repeats itself" and showing the probability distribution of a stock's price movement over the next 20 days!
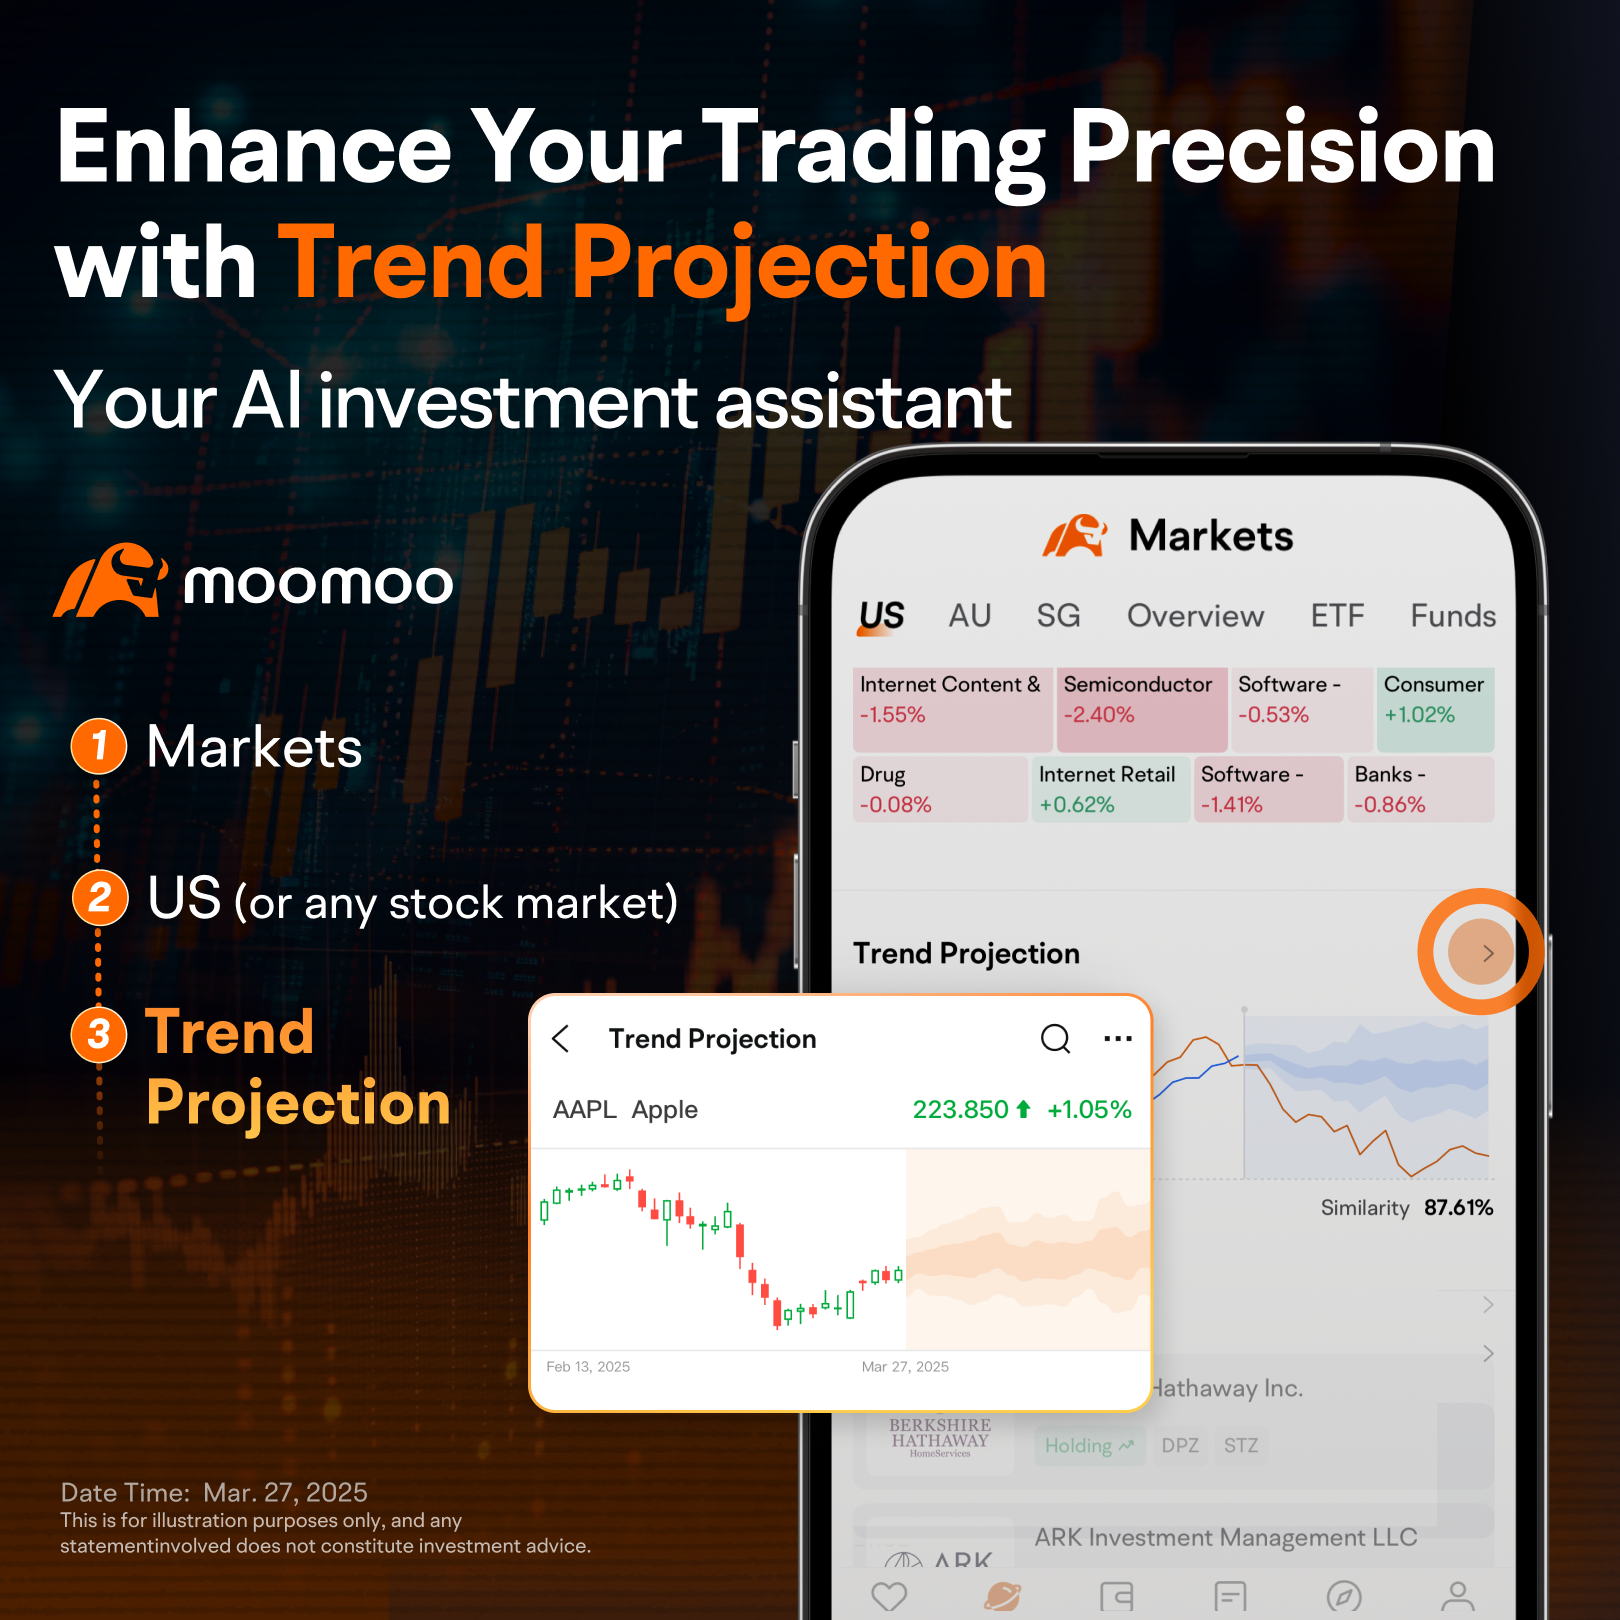
Its capabilities go far beyond what you might imagine! It can tell you:
·The probability of a stock rising or falling the next day after placing an order.
·The potential upside and downside over the next 20 days.
·Help you manage profit expectations and risk tolerance.
Let’s dive into how to use Trend Projection effectively!
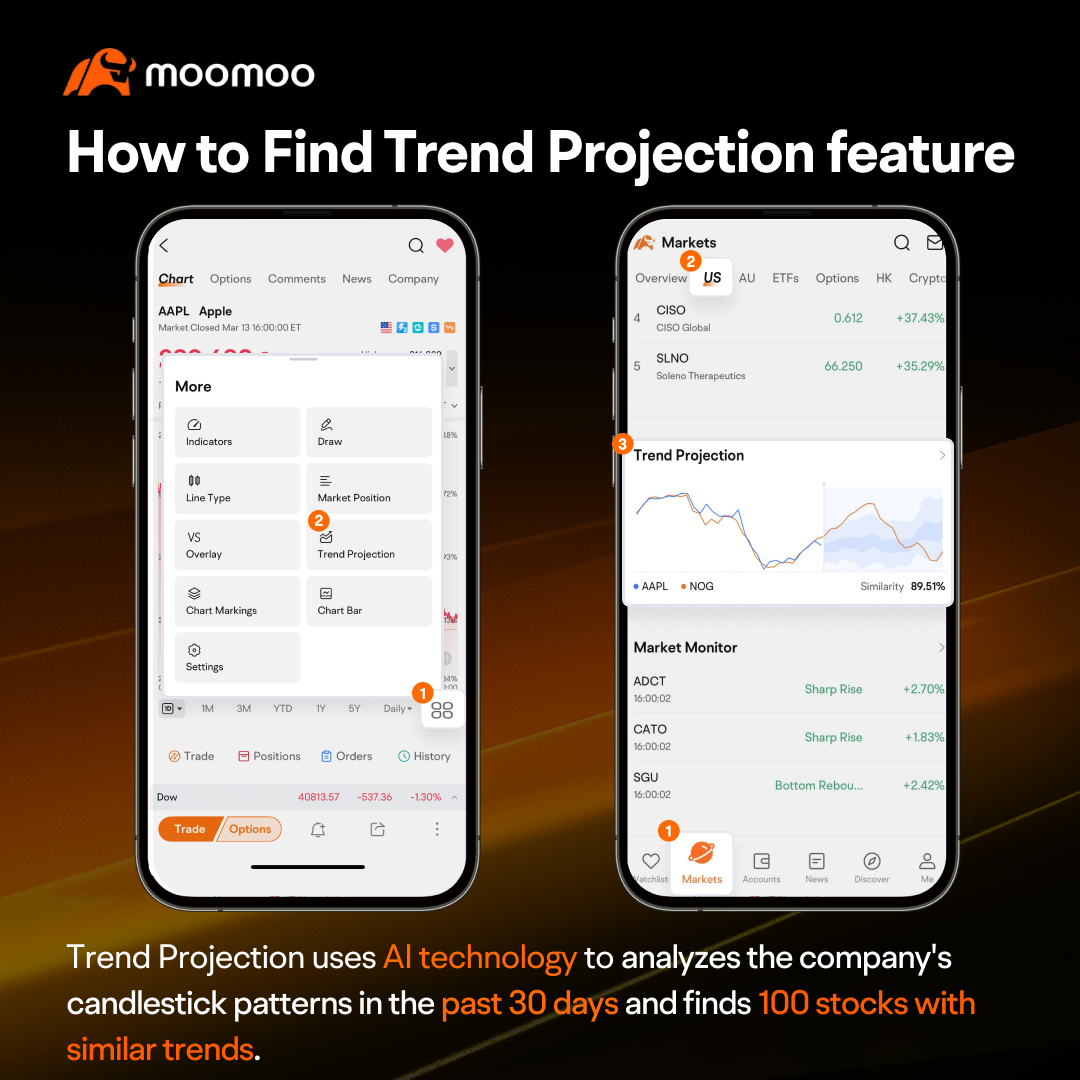
Open moomoo, select a stock you're interested in, tap the button on the bottom right corner of the candlestick chart, and choose Trend Projection.
Alternatively, go to Markets → US (or any stock market) → Trend Projection to find trending stocks and predictions for your watchlist.
Let's take Nvidia (NVDA) as an example.
After opening NVDA's Trend Projection, the AI analyzes NVDA's candlestick patterns over the past 30 days and filters out 100 stocks with the most similar historical trends from a massive dataset.
It then displays the historical candlestick charts of the top 5 most similar stocks and generates a probability distribution of NVDA's price movement over the next 20 days.
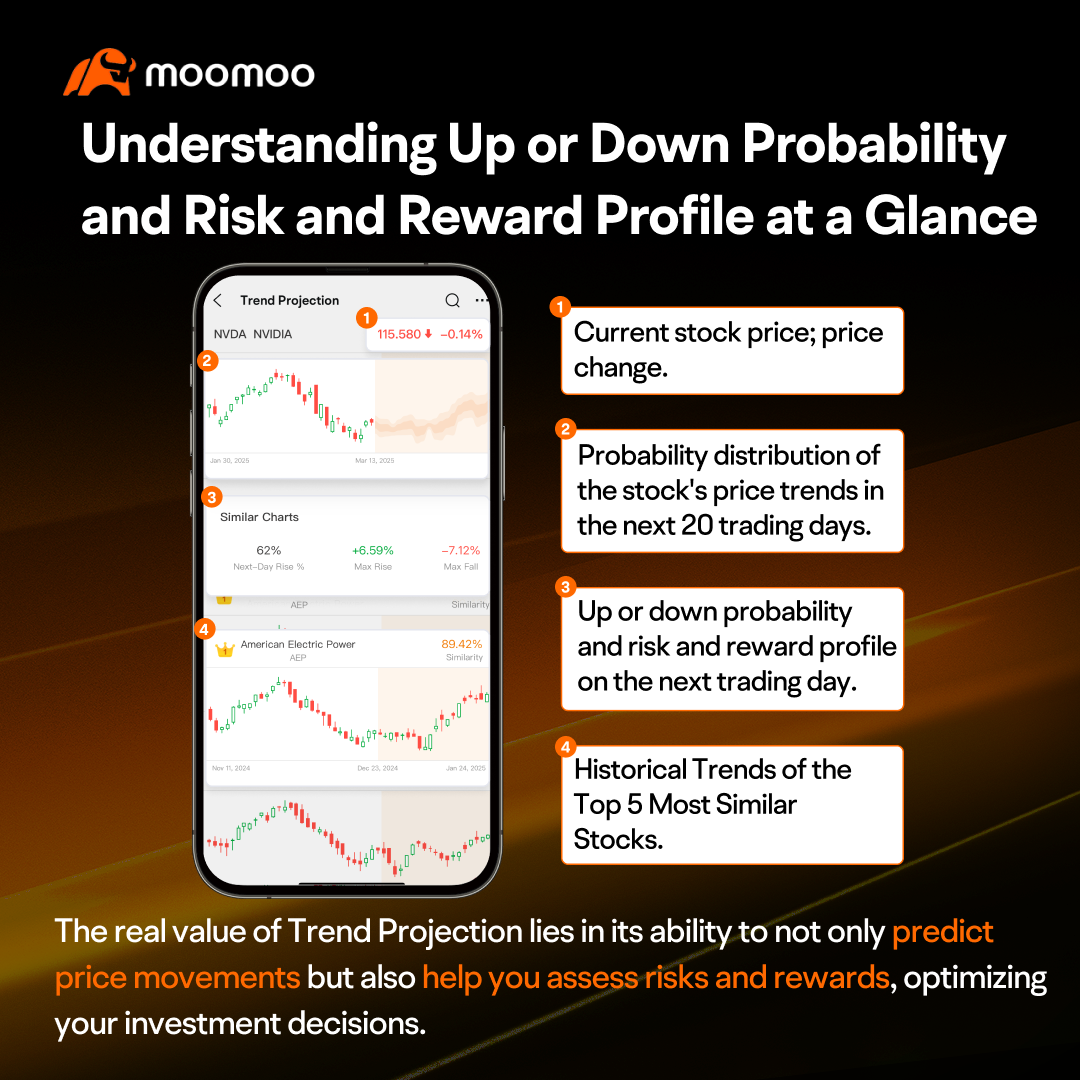
But this is just the beginning! The real value of Trend Projection lies in its ability to not only predict price movements but also help you assess risks and rewards, optimizing your investment decisions.
1. Probability Distribution for the Next 20 Days
The color intensity on the prediction chart indicates the probability level—the darker the color, the higher the probability.
Tip: Refer to the highest and lowest dashed lines to identify potential peaks and troughs, helping you find opportunities to buy low or sell high.
2. Next-Day Rise Probability
The AI calculates the probability of the stock rising or falling the next day based on the 100 most similar historical patterns.
3. Maximum Rise and Fall
The AI also calculates the maximum possible gain and loss for the next day.
Tip: Combine the rise/fall probabilities with the maximum gain and loss to better assess the risk-reward ratio and decide whether to place an order.
4. Historical Trends of the Top 5 Most Similar Stocks
This section shows the historical candlestick charts of the 5 most similar stocks. Focus on their volatility patterns to identify potential turning points and profit/loss ranges.
Tip: Stocks from similar industries tend to have more reliable patterns, so prioritize those for better insights!
It’s important to note that Trend Projection is based on historical data and AI learning algorithms, so it cannot predict future movements with 100% accuracy.
For Experienced Traders: Use Trend Projection to validate your technical analysis or find inspiration when you’re unsure about a stock's direction.
For Beginners: While we don't recommend relying solely on Trend Projection, it can help you understand potential price movements and assess risks, enabling smarter decisions.
Remember, investing involves risks, and decisions should be made cautiously. Trend Projection is your powerful assistant, but always consider multiple factors before making a decision.
Start your AI-powered investment journey with moomoo now!
This presentation is for informational and educational use only and is not a recommendation or endorsement of any particular investment or investment strategy. Investment information provided in this content is general in nature, strictly for illustrative purposes, and may not be appropriate for all investors. Read more