The main aim of stock picking is to find the market-beating stocks. But every investor is virtually certain to have both over-performing and under-performing stocks. At this point some shareholders may be questioning their investment in Hang Lung Group Limited (HKG:10), since the last five years saw the share price fall 52%. On top of that, the share price is down 5.5% in the last week.
After losing 5.5% this past week, it's worth investigating the company's fundamentals to see what we can infer from past performance.
Check out our latest analysis for Hang Lung Group
To paraphrase Benjamin Graham: Over the short term the market is a voting machine, but over the long term it's a weighing machine. By comparing earnings per share (EPS) and share price changes over time, we can get a feel for how investor attitudes to a company have morphed over time.
Looking back five years, both Hang Lung Group's share price and EPS declined; the latter at a rate of 10% per year. This reduction in EPS is less than the 14% annual reduction in the share price. This implies that the market is more cautious about the business these days. The low P/E ratio of 7.40 further reflects this reticence.
The company's earnings per share (over time) is depicted in the image below (click to see the exact numbers).
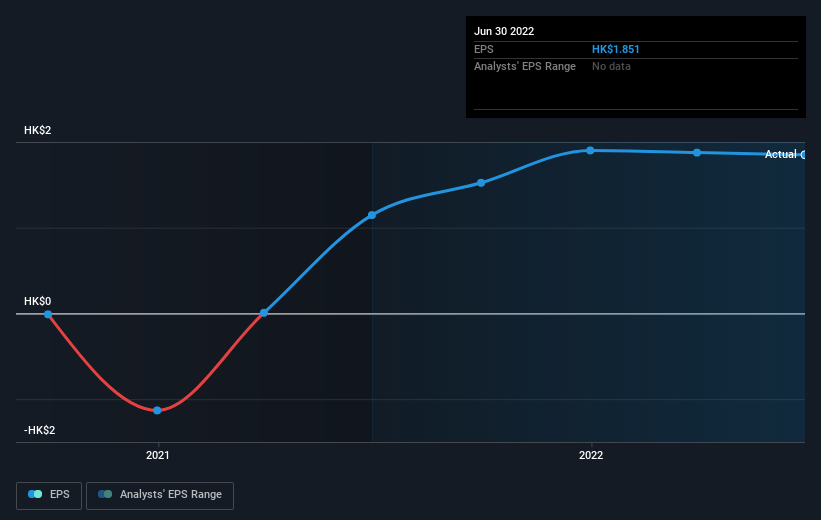
SEHK:10 Earnings Per Share Growth December 21st 2022
We consider it positive that insiders have made significant purchases in the last year. Having said that, most people consider earnings and revenue growth trends to be a more meaningful guide to the business. This free interactive report on Hang Lung Group's earnings, revenue and cash flow is a great place to start, if you want to investigate the stock further.
What About Dividends?
As well as measuring the share price return, investors should also consider the total shareholder return (TSR). The TSR is a return calculation that accounts for the value of cash dividends (assuming that any dividend received was reinvested) and the calculated value of any discounted capital raisings and spin-offs. It's fair to say that the TSR gives a more complete picture for stocks that pay a dividend. As it happens, Hang Lung Group's TSR for the last 5 years was -40%, which exceeds the share price return mentioned earlier. And there's no prize for guessing that the dividend payments largely explain the divergence!
A Different Perspective
While it's never nice to take a loss, Hang Lung Group shareholders can take comfort that , including dividends,their trailing twelve month loss of 9.7% wasn't as bad as the market loss of around 12%. Unfortunately, last year's performance may indicate unresolved challenges, given that it's worse than the annualised loss of 7% over the last half decade. While some investors do well specializing in buying companies that are struggling (but nonetheless undervalued), don't forget that Buffett said that 'turnarounds seldom turn'. I find it very interesting to look at share price over the long term as a proxy for business performance. But to truly gain insight, we need to consider other information, too. Case in point: We've spotted 2 warning signs for Hang Lung Group you should be aware of, and 1 of them is a bit unpleasant.
There are plenty of other companies that have insiders buying up shares. You probably do not want to miss this free list of growing companies that insiders are buying.
Please note, the market returns quoted in this article reflect the market weighted average returns of stocks that currently trade on HK exchanges.
Have feedback on this article? Concerned about the content? Get in touch with us directly. Alternatively, email editorial-team (at) simplywallst.com.
This article by Simply Wall St is general in nature. We provide commentary based on historical data and analyst forecasts only using an unbiased methodology and our articles are not intended to be financial advice. It does not constitute a recommendation to buy or sell any stock, and does not take account of your objectives, or your financial situation. We aim to bring you long-term focused analysis driven by fundamental data. Note that our analysis may not factor in the latest price-sensitive company announcements or qualitative material. Simply Wall St has no position in any stocks mentioned.
挑選股票的主要目的是找到市場跳動的股票。但是,每個投資者幾乎可以肯定擁有表現過高和表現不佳的股票。在這一點上,一些股東可能會質疑他們的投資 恒隆集團有限公司 (港幣代號:10),自過去五年以來股價下跌 52%。最重要的是,上週股價下跌了 5.5%。
在過去一周損失 5.5% 之後,值得研究該公司的基本面,以了解我們可以從過去的業績中推斷出什麼。
查看恒隆集團的最新分析
釋義本傑明·格雷厄姆:在短期內,市場是一台投票機,但從長遠來看,這是一個稱重機。通過比較每股收益(EPS)和股價隨著時間的變化,我們可以了解投資者對公司的態度如何隨著時間的推移而變化。
回顧五年前,恒隆集團的股價及每股盈利均下跌,後者每年的百分之十。每股盈餘的減少少於股價每年下跌 14% 的幅度。這意味著市場對這些天的業務更加謹慎。7.40 的低市盈率進一步反映了這種無效。
該公司的每股收益(隨著時間的推移)如下圖所示(點擊查看確切的數字)。
香港聯交所:2022 年 12 月 21 日每股盈利增長 10
我們認為內部人士在去年進行了大量購買,這是積極的。話雖如此,大多數人認為收益和收入增長趨勢是對業務更有意義的指南。這 自由 如果您想進一步調查股票,恒隆集團的收益、收益和現金流量的互動報告是一個很好的起點。
股息呢?
除了衡量股價回報外,投資者還應考慮股東總回報(TSR)。TSR 是一種回報計算,用於計算現金股息的價值(假設收到的任何股息已再投資)以及任何折現增資和分拆的計算價值。可以公平地說,TSR 為支付股息的股票提供了更完整的了解。事實上,恒隆集團過去 5 年的 TSR 為 -40%,超過前面提及的股價回報。而且沒有獎金可以猜測股息支付在很大程度上解釋了分歧!
不同的角度
雖然恒隆集團股東可以感到安慰,但其後 12 個月虧損 9.7% 並不像市場虧損約 12% 那麼糟糕,包括股息在內,恒隆集團的股東可以感到安慰。不幸的是,去年的表現可能表明尚未解決的挑戰,因為它比過去半年的年度化虧損 7% 更糟糕。雖然一些投資者擅長購買正在掙扎的公司(但儘管被低估),但不要忘記巴菲特說「周轉很少」。從長遠來看股價作為業務表現的代理,我覺得非常有趣。但是要真正獲得洞察力,我們也需要考慮其他信息。例子點:我們已經發現 恒隆集團的 2 個警告標誌 你應該知道,其中 1 個有點不愉快。
還有很多其他公司有內部人士購買股票。你可能會這樣做 不 想錯過這個 自由 內部人士正在購買的成長公司名單。
請注意,本文中引述的市場回報反映了目前在香港交易所交易的股票的市場加權平均回報。
對這篇文章有反饋嗎?關注內容? 取得聯繫 直接與我們聯繫。 或者,通過電子郵件發送電子郵件給編輯團隊。
這篇文章由簡單牆聖是一般性質. 我們僅使用公正的方法,根據歷史數據和分析師預測提供評論,我們的文章並不打算作為財務建議。 它並不構成購買或出售任何股票的建議,也不會考慮您的目標或您的財務狀況。我們的目標是為您帶來由基本數據驅動的長期集中分析。請注意,我們的分析可能不會考慮最新的價格敏感公司公告或定性材料。簡易華街在提及的任何股票中都沒有倉位。
