How to Use Short Sale Analysis
How to Interpret Short Sale Data
Short sale data indicates market sentiment and tracks price trends.
Investors with a long position can track short sale data with the hopes of avoiding stocks that might move downward.
Short-sellers can focus on stocks with a high short sale volume to potentially find investment opportunities.
Note: Any app images provided in the content are not current, and any securities shown are for illustrative purposes only and are not a recommendation.
How to Access Short Sale Analysis
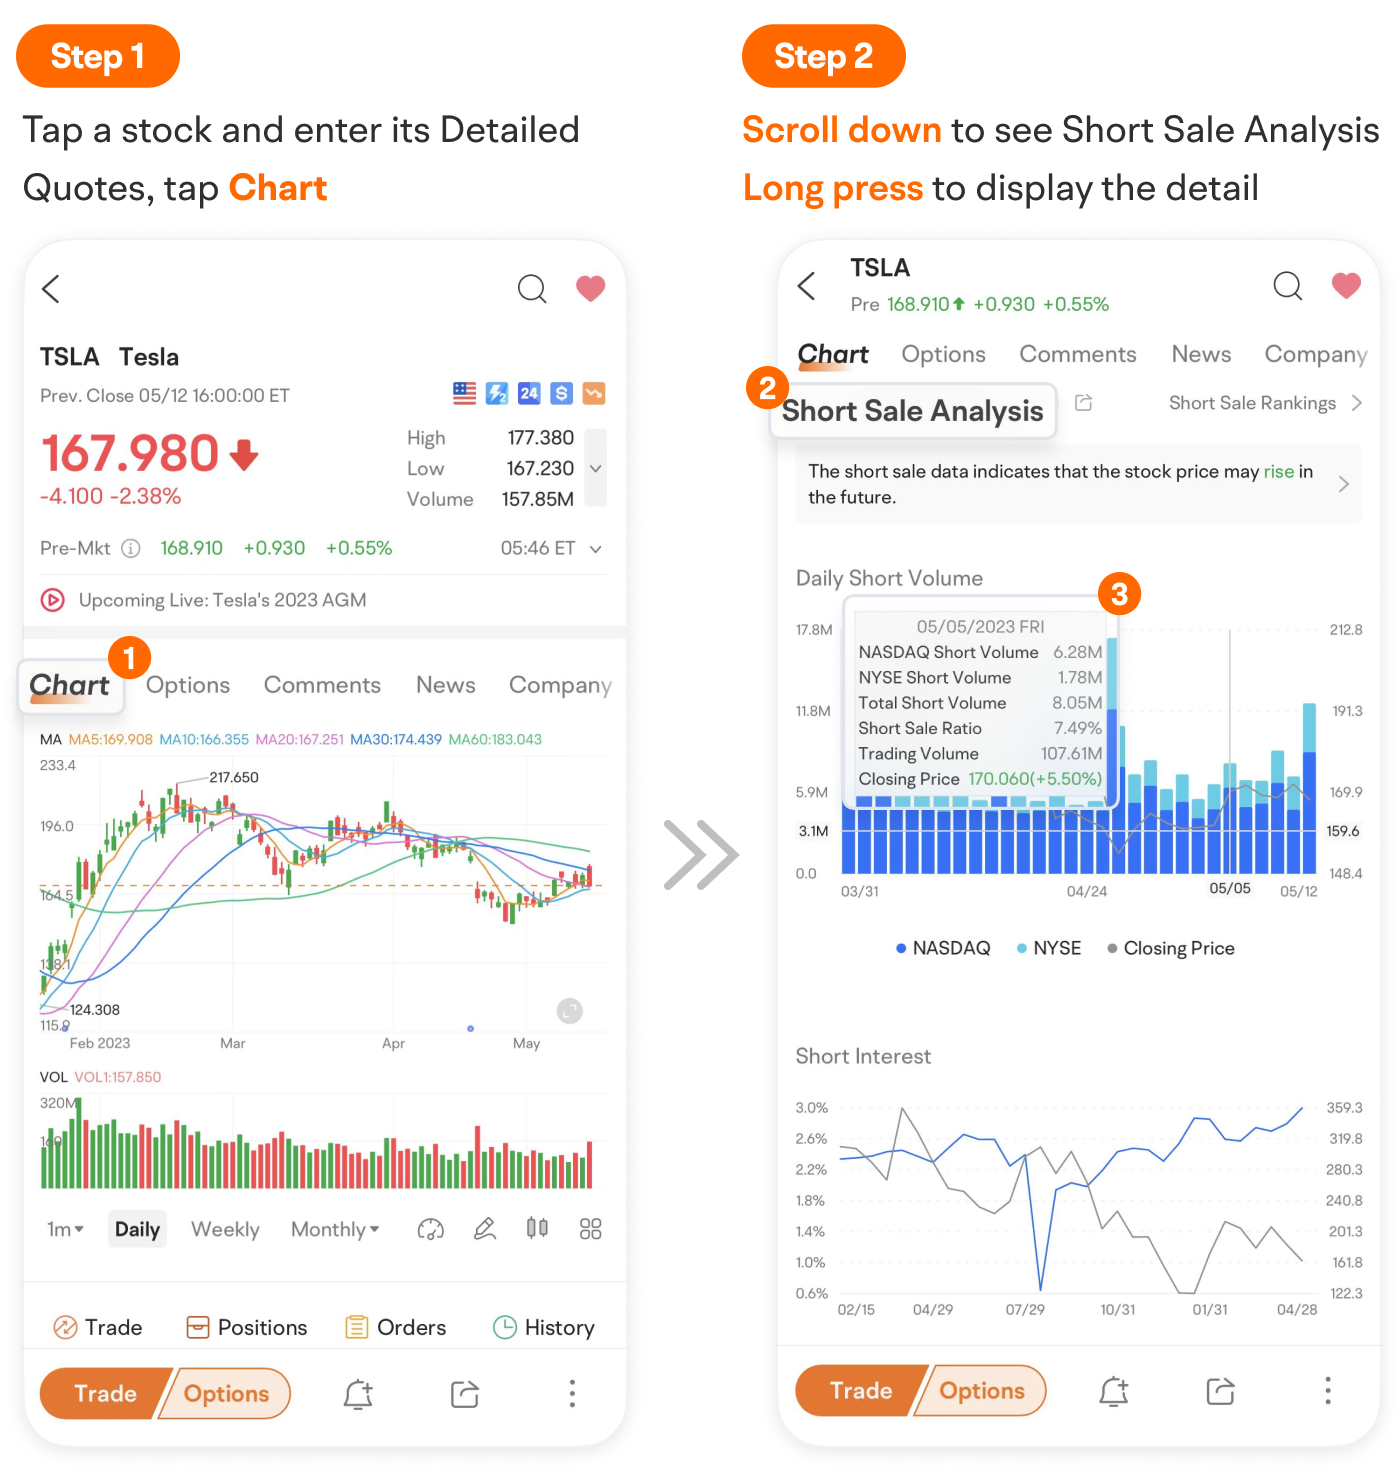
1. Tap a stock and enter its Detailed Quotes, tap Chart.
2. Scroll down to see Short Sale Analysis.
3. Long press to display the details and drag the chart to view the data of different dates.
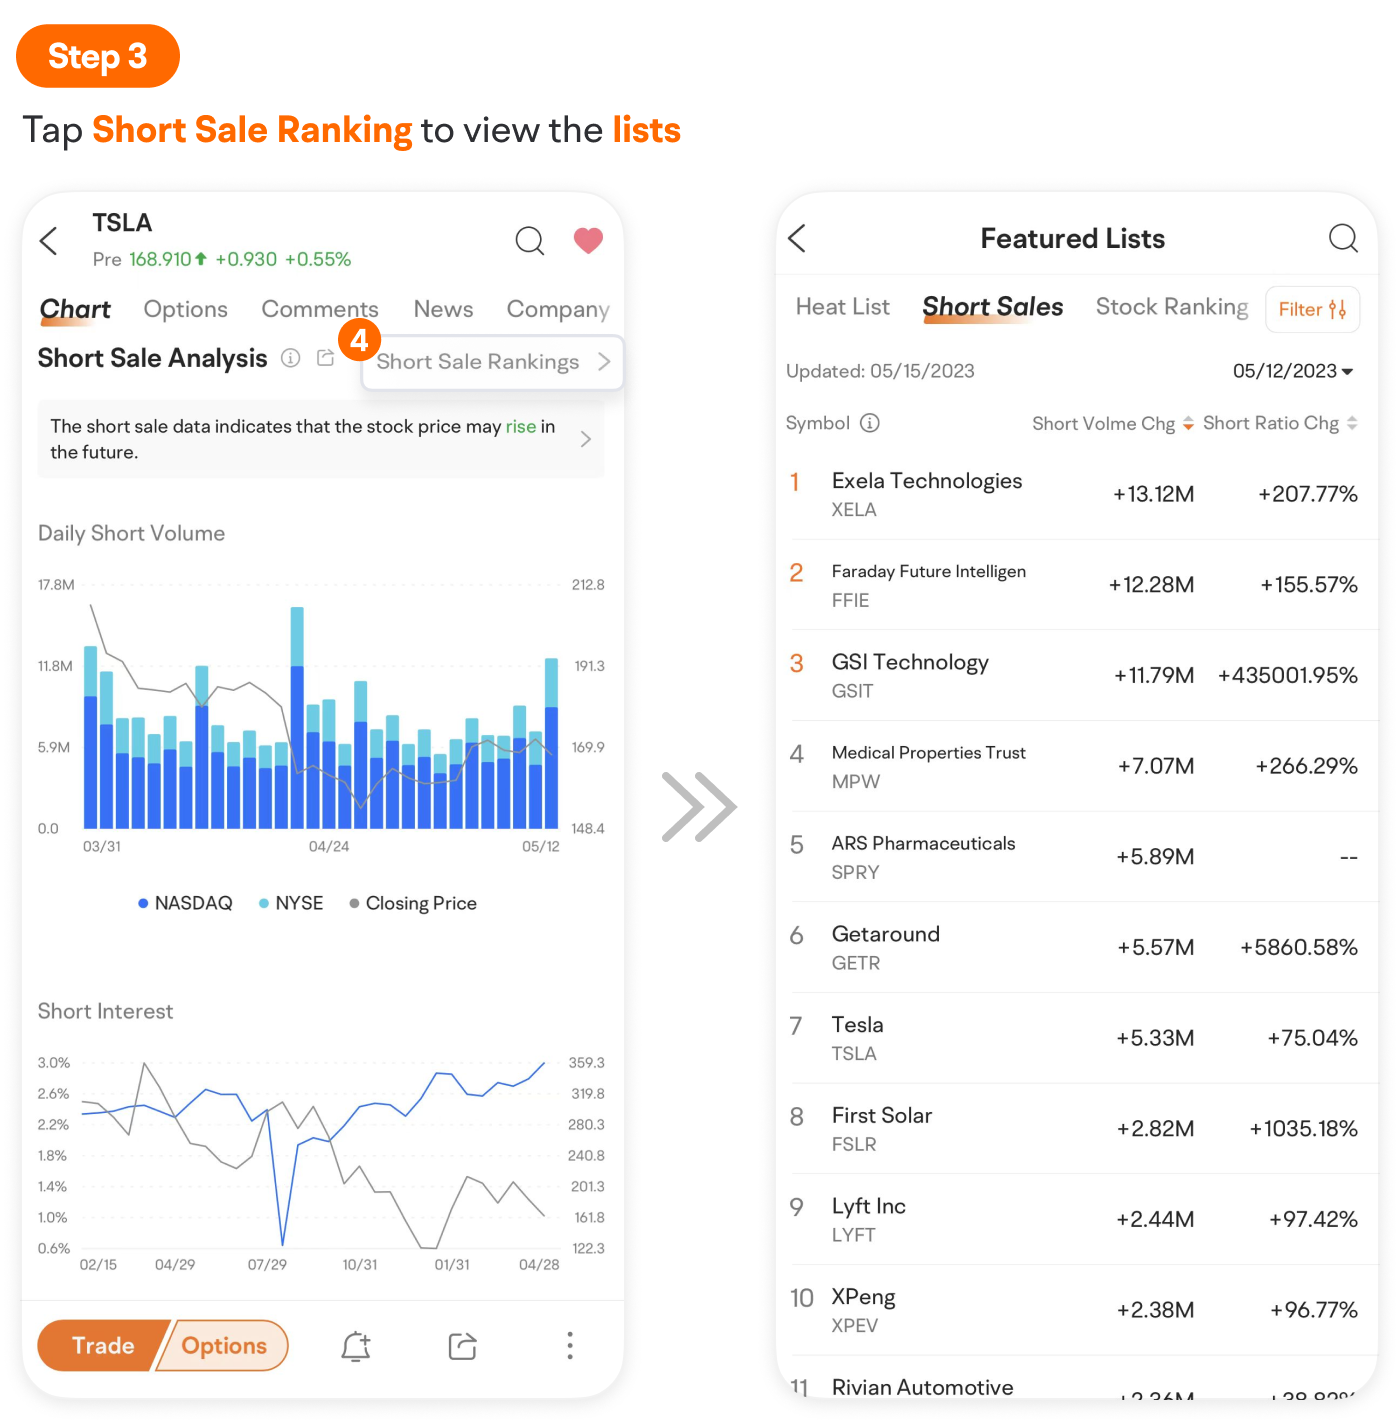
Tap Short Sale Ranking to view the lists.
How to Analyze Short Sale Data
Daily Short Volume - Help speculate on future trends
Main Indicators:
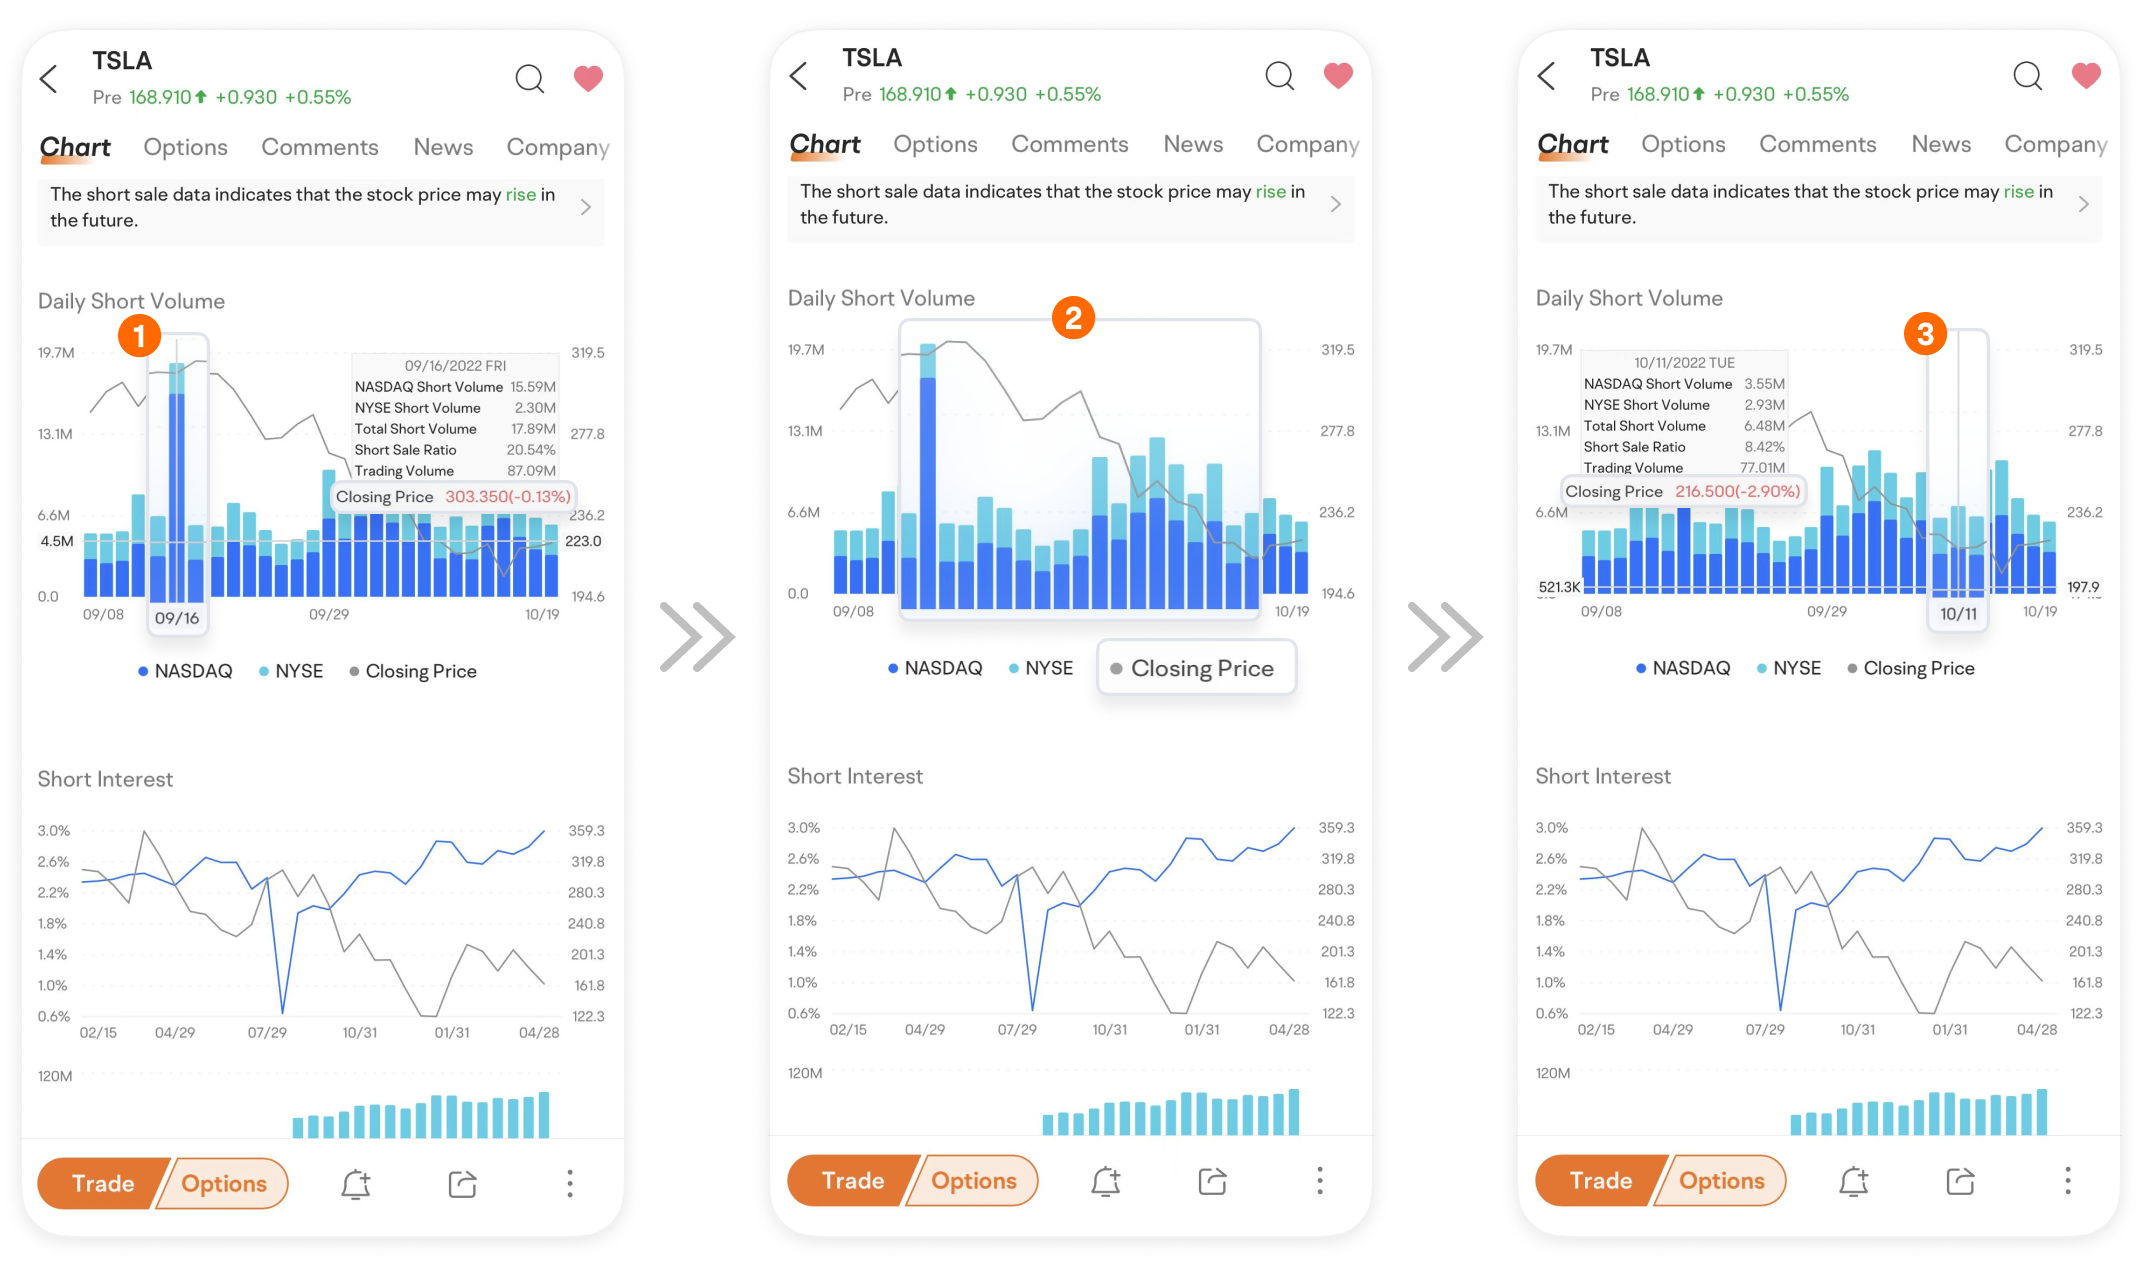
1. Daily Short Volume: number of shares traded short of the trading day on the market (updated every day).
2. Short Interest Ratio = Short Interest / Average Daily Trading Volume
Example:
Let's take Tesla stock as an example. It closed at $303.35 on September 16, 2022, with a peaked daily short volume.
Then, as we can see below, the stock continued to fall and dropped to $216.5 on October 11, 2022.
Analysis:
We can conclude from the example that short volume reflects, to some extent, investors' expectations of future trends.
If the short volume has a sharp increase, the stock price might be more likely to fall in the short term.
Short Interest - Determine market sentiment
Main Indicators:
Short Interest Volume: the number of short shares that have not closed to date (updated every two weeks).
Short Interest Ratio = Short Interest Volume / Total Equity
Days to Cover = Short Interest Volume / 30-day Average Daily Volume
Example:
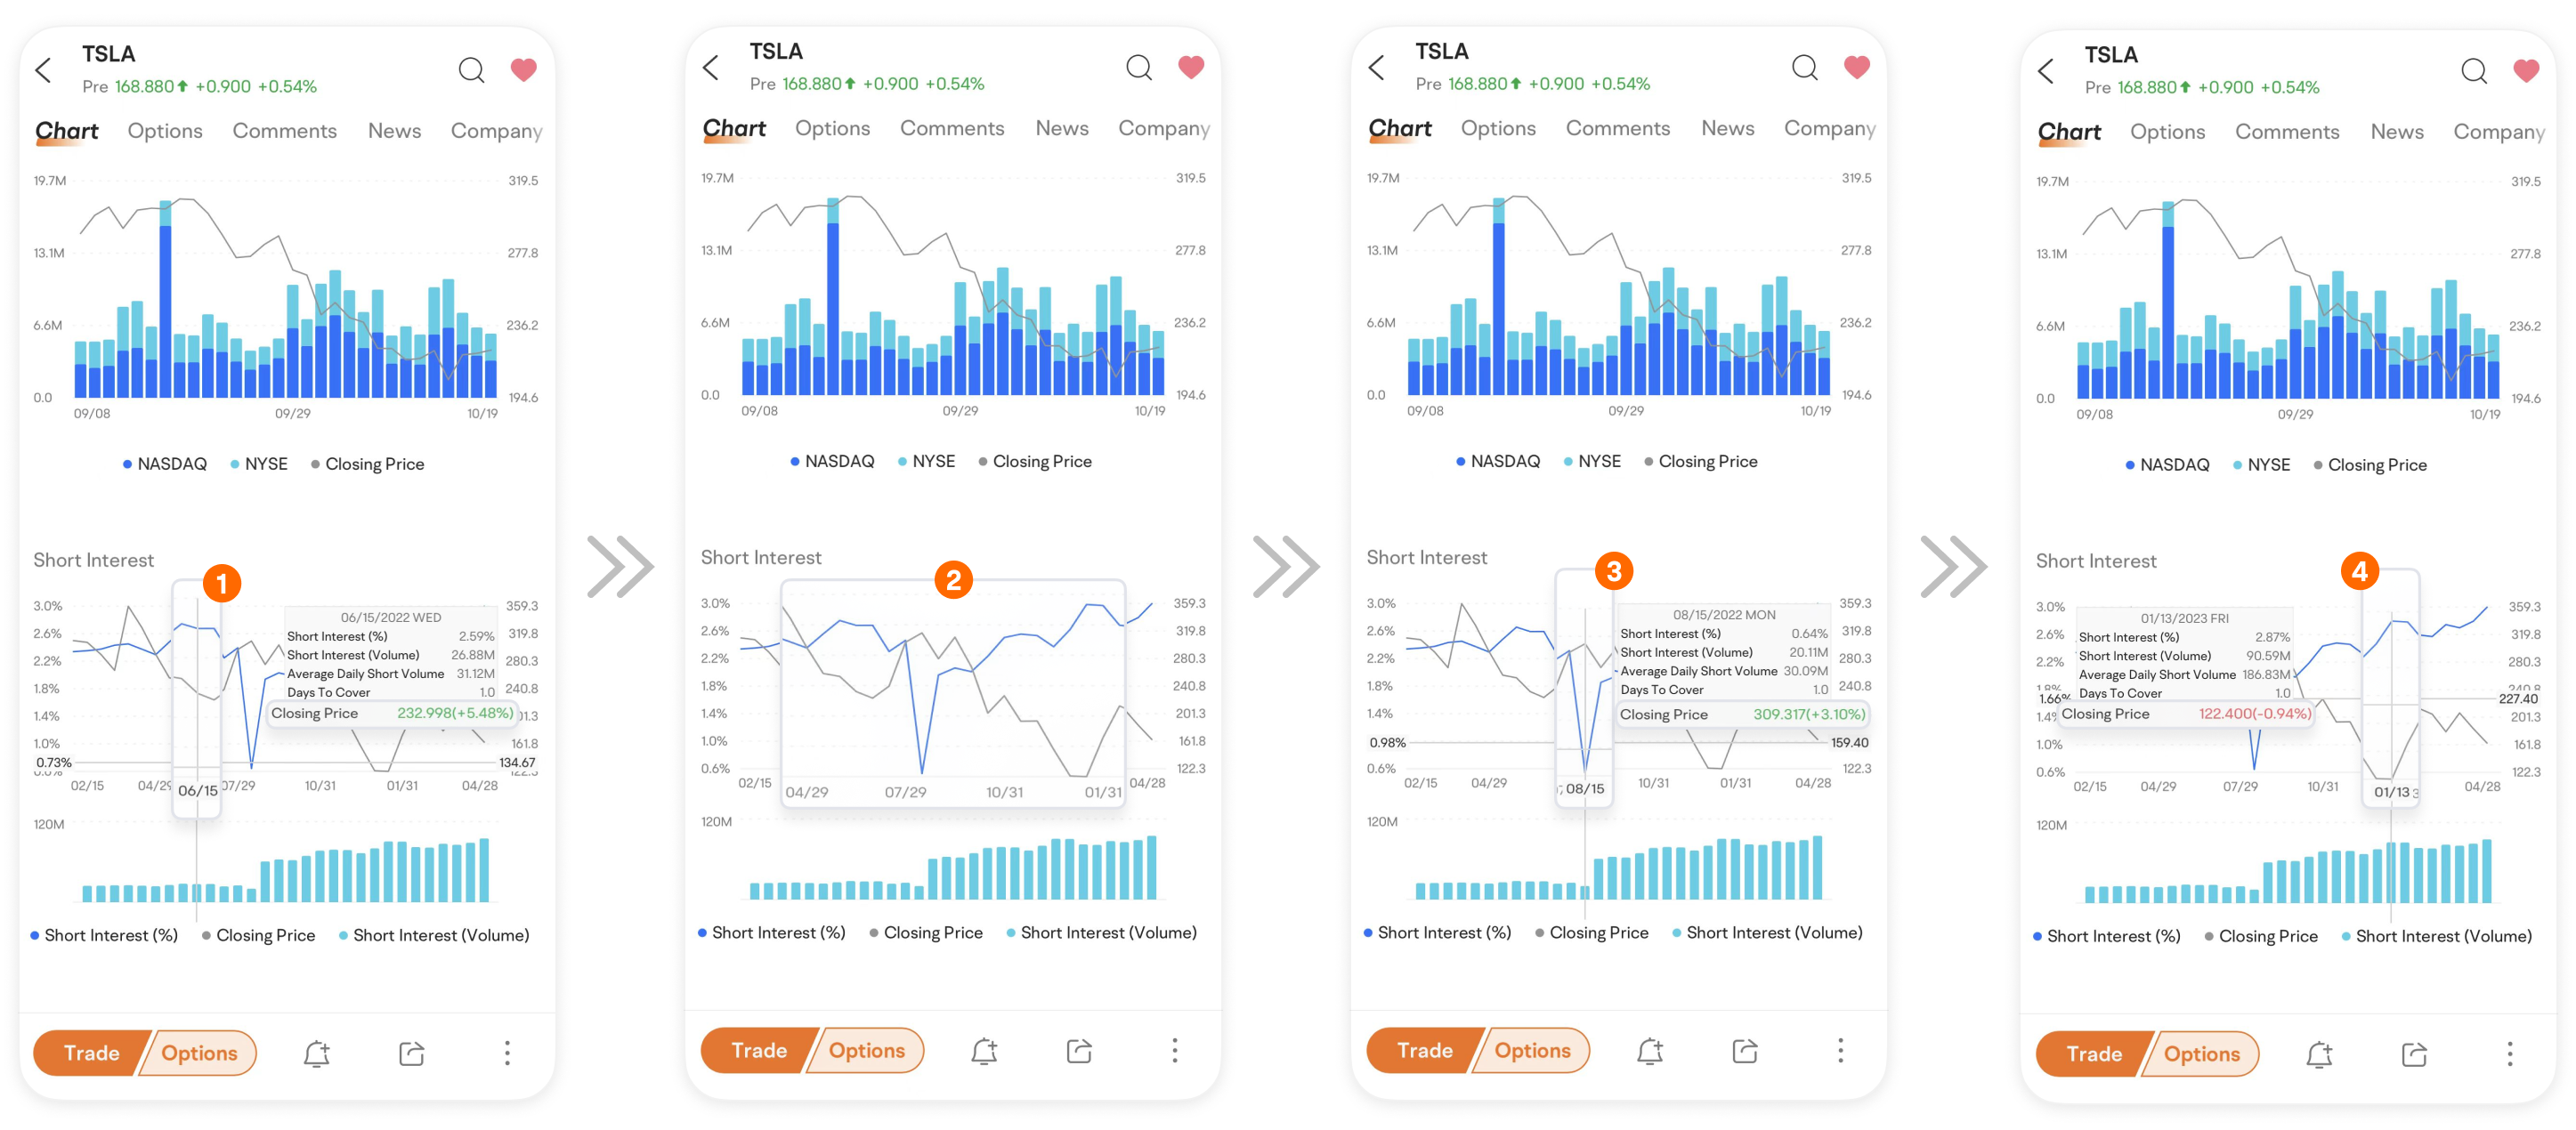
Let's get back to the example of Tesla. The short interest ratio of Tesla decreased sharply from June 15 to August 15, 2022, while the price rose from $232.998 to $309.317.
However, when the short interest ratio reversed and went higher, the stock price showed a downward trend.
On January 13, 2023, Tesla hit 52 weeks low, while the short interest ratio surged to its peak.
Analysis:
Generally, the higher the short interest volume, the more likely the stock price may fall.
Conversely, a significant decline in the short interest volume may indicate a potential price rise, resulting from either short-sellers buying back the shares to close their positions or the bullish market sentiment.
Although the stock price and the short interest ratio are negatively correlated, remember it's not always the case, and other indicators should be considered when forecasting trends.
Short Sale Rankings - Spot potential investment opportunities
Tap Short Sale Rankings to view the short sales list and find potential investment opportunities.
1. Tap Filter in the upper right corner to change the settings.
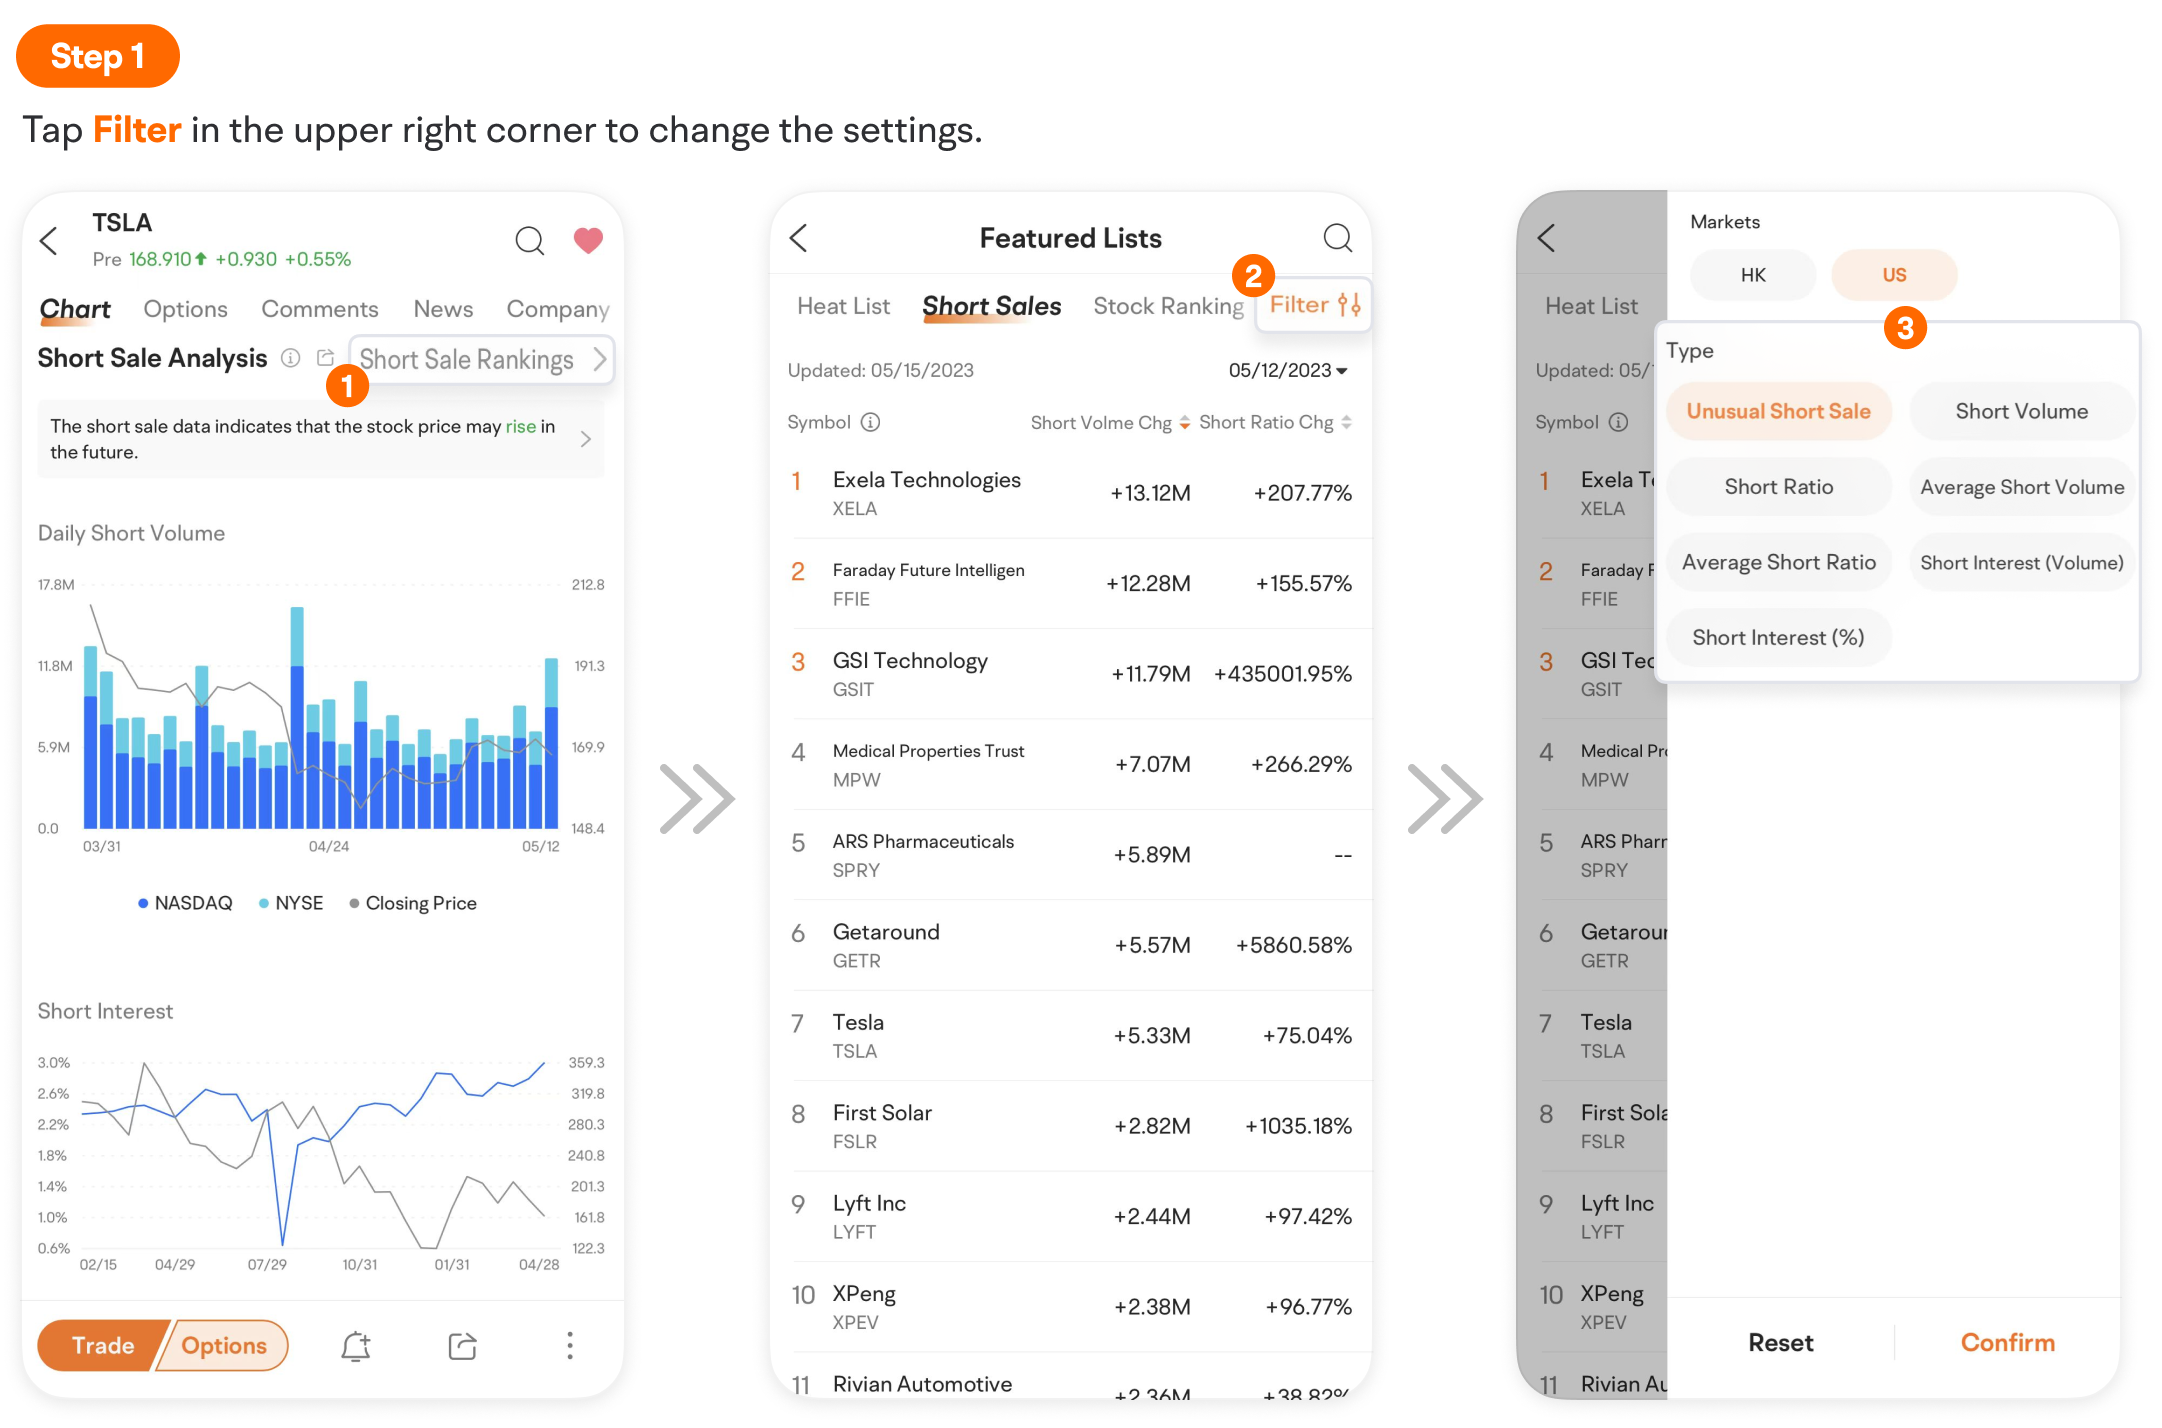
Unusual Short Sales, Short Volume, and Short Ratio are updated daily.
Average Short Volume and Average Short Ratio are the average data for the last week or month.
You can also choose to display Short Interest (volume), and Short Interest (%).
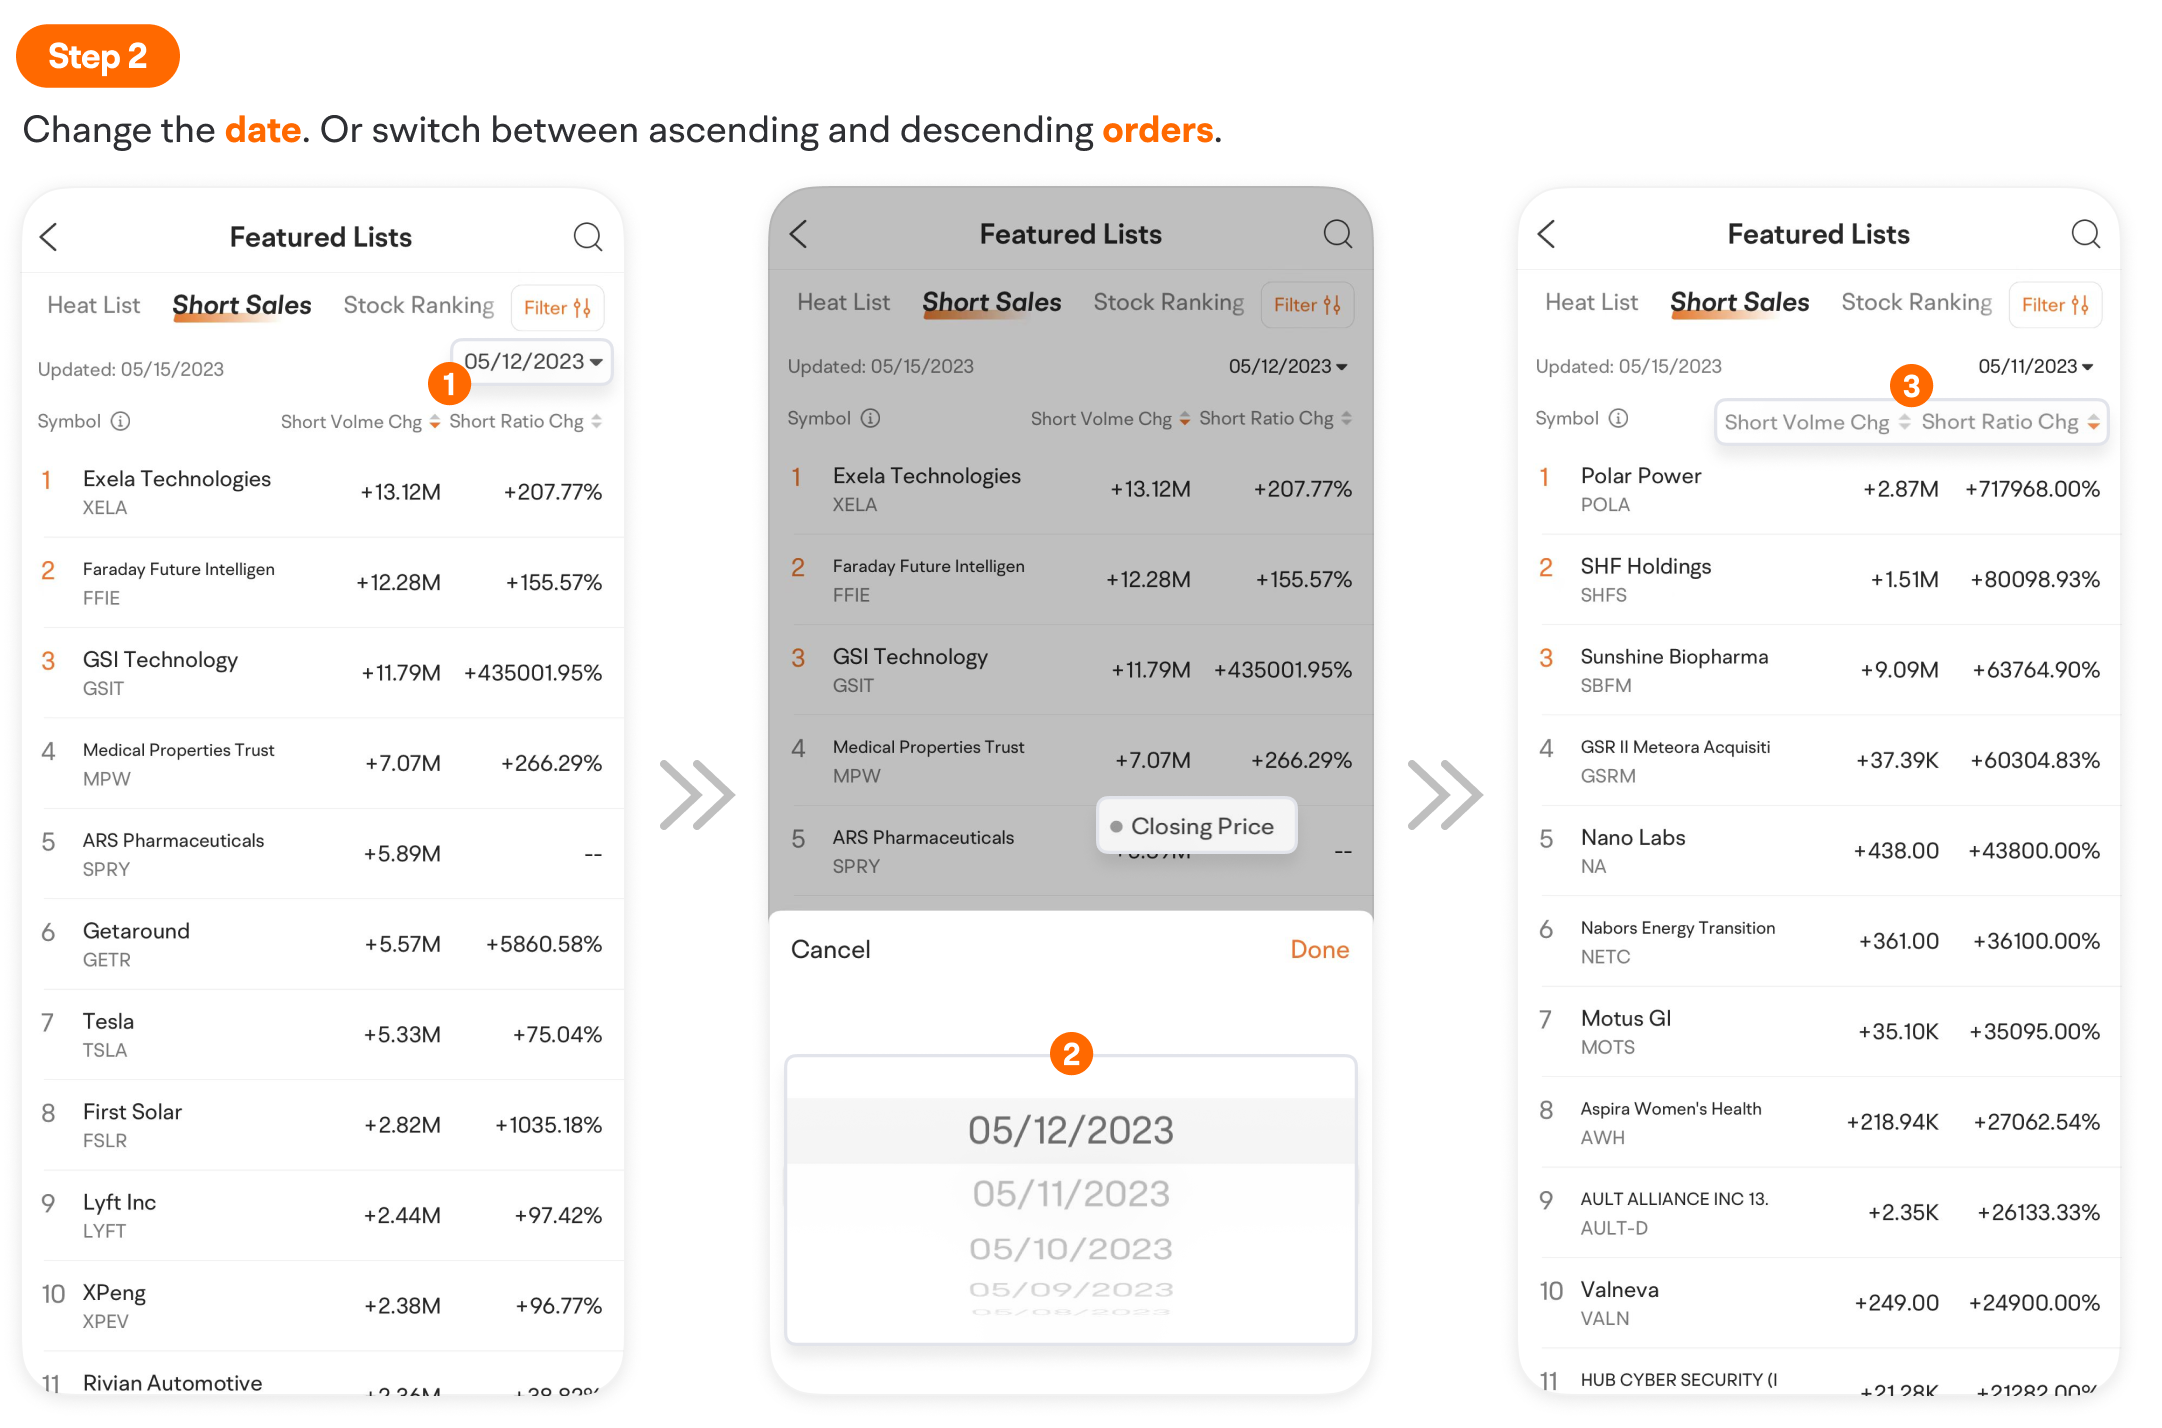
2. You can change the date and switch between ascending and descending orders.
How to short a stock?
1. First, open a margin account.
Once you open a margin account, tap [Trade] and select [Sell]. If you do not have a long position, tapping the Sell button directly will be considered short selling.
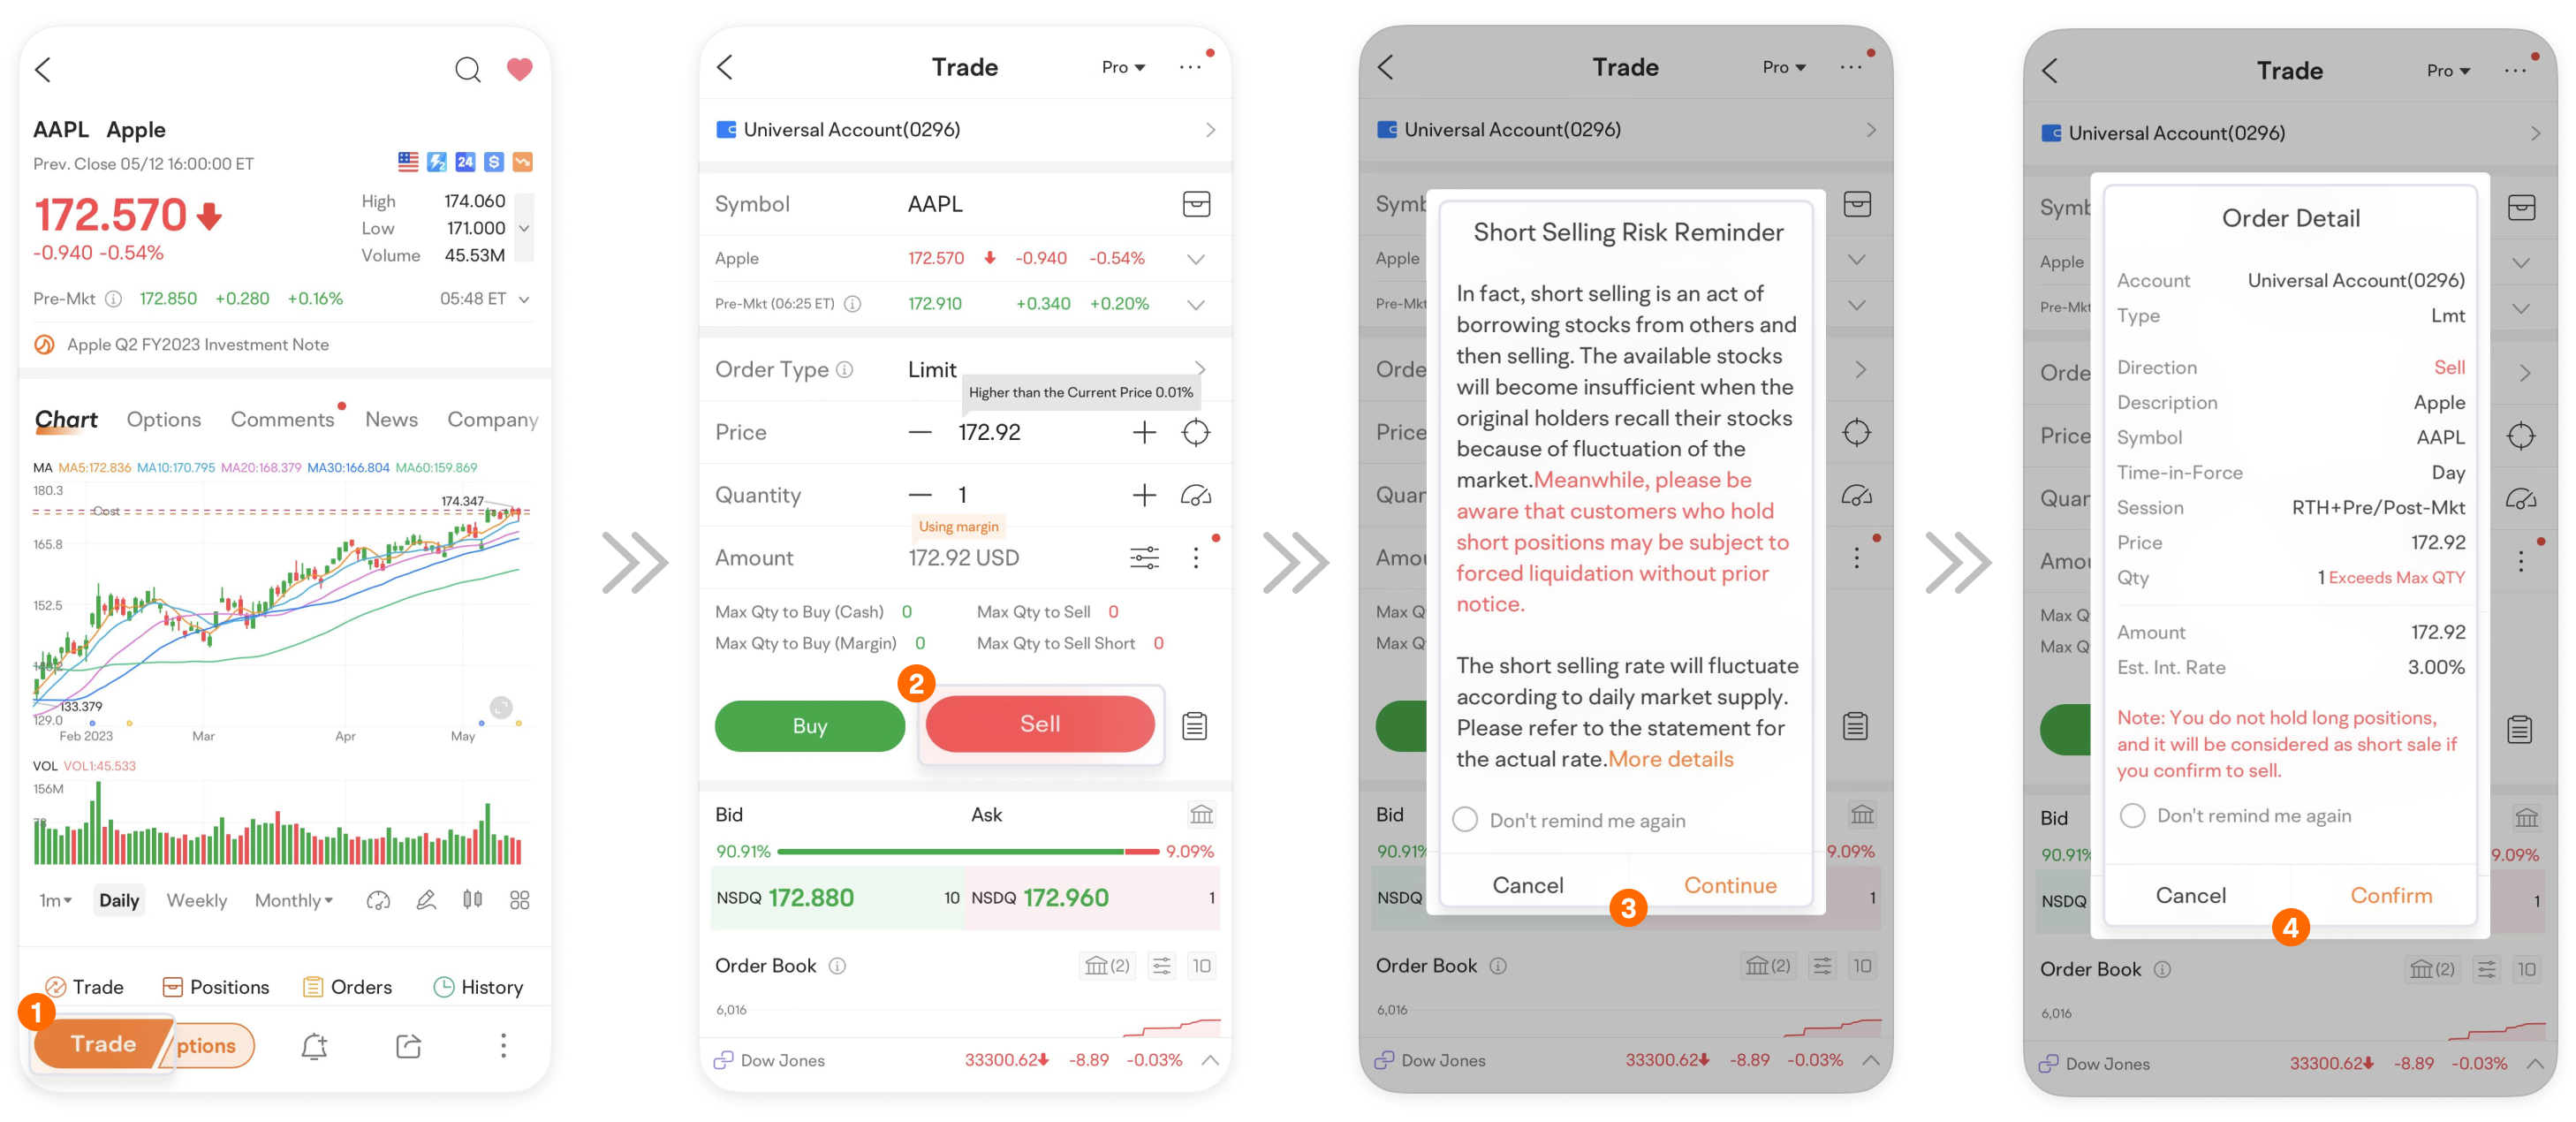
Reminder: Short selling is an act of borrowing and selling stocks. Please note that risk management is needed as users holding short positions may be forced to liquidate without prior notice. When short selling, there is no limit on how high a stock price could rise, so the potential loss is unlimited. Other risks include dividend risk and margin risk, this strategy is not appropriate for all investors.
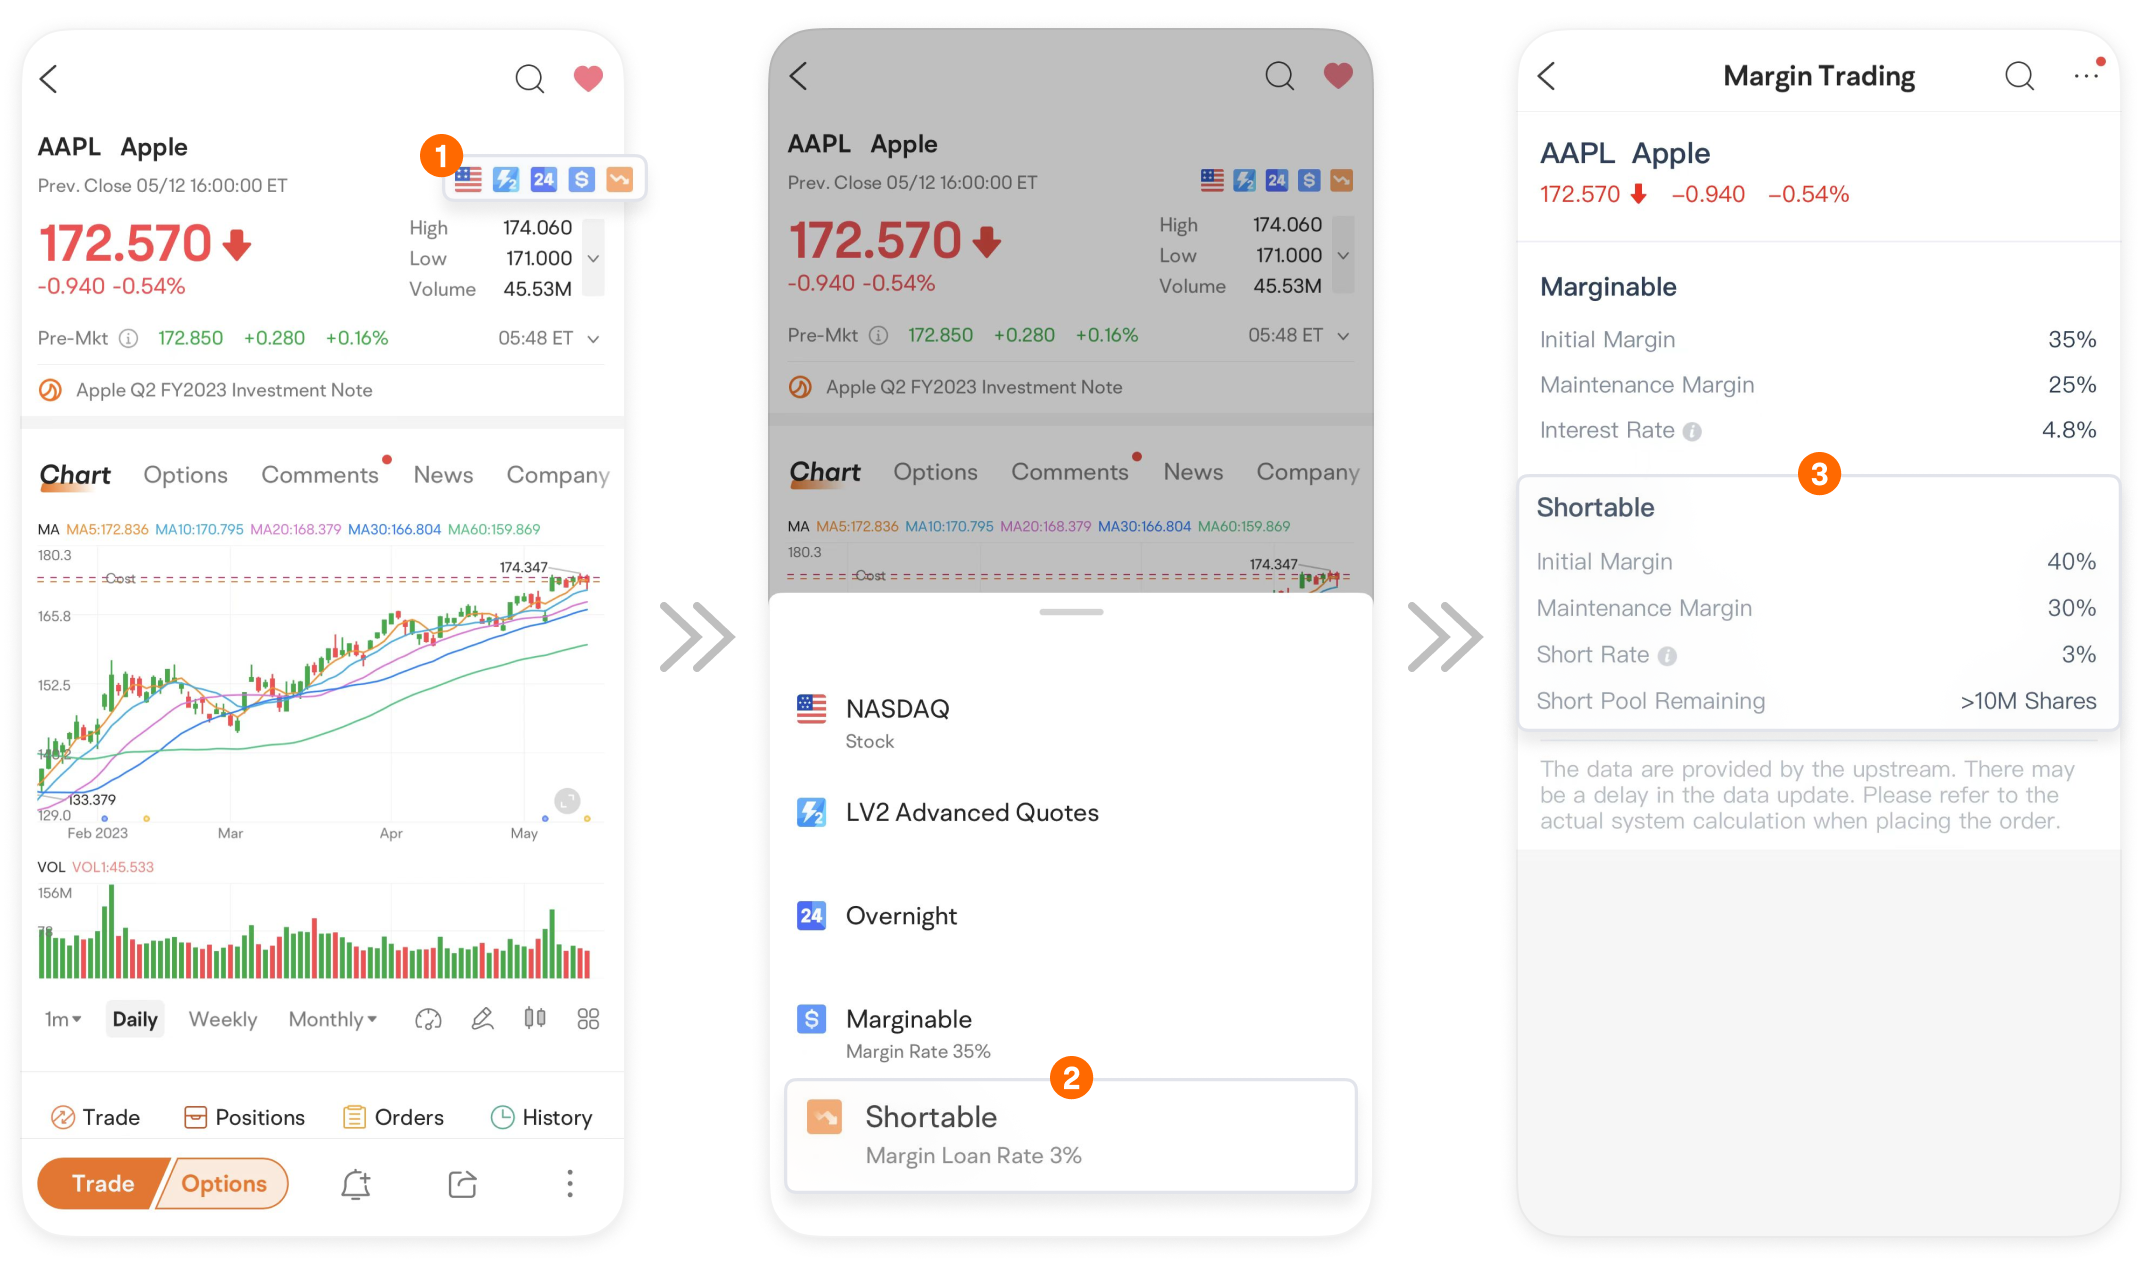
2. Short selling requires margin and additional fees, which could vary as daily market supply changes.
On the Detailed Quotes page, you can view whether the stock is shortable and its margin requirements.
This presentation is for informational and educational use only and is not a recommendation or endorsement of any particular investment or investment strategy. Investment information provided in this content is general in nature, strictly for illustrative purposes, and may not be appropriate for all investors. Read more
Recommend

How to Use Level 2 market data

How to Use Capital Tracking

How to Place A Bracket Order

How to Use Limit and Market Orders
How to Switch Trading Mode
How to Track Earnings Reports
How to Do Financial Analysis
How to trade with advanced order types?
How to Use Moomoo's Ticks Feature
How to Manage Watchlist
How to Use Basic Order Types
How to Use Stock Screener on moomoo?
Short Sale Analysis – Quickly Identify Market Sentiment
Customize Strategy - Pick Stocks in 4 Steps
How to Use Similar Charts
How to Use Position Cost Distribution
How to Use Heat List
How to Use Institutional Tracker
How to Use Heat Map
How to Interpret 15 Technical Indicators with 1 Feature
How to Custom Technical Indicators
How to Use Earnings Beat on moomoo
Free Real-Time Quotes: Have your Fingers on the Pulse of Short-Term Stock Prices
How to Use Short Sale Analysis
How to Paper Trade on moomoo
Evaluating Stocks with Candlestick Patterns
How to Use Options Screener
Financial analysis – Graphical presentation of data, business performance at a glance
How to Diversify Order Settings
How to Use Level 2 market data
How to Use Capital Tracking
How to Place A Bracket Order
How to Use Limit and Market Orders
How to Switch Trading Mode
How to Track Earnings Reports
How to Do Financial Analysis
How to trade with advanced order types?
How to Use Moomoo's Ticks Feature
How to Manage Watchlist
How to Use Basic Order Types
How to Use Stock Screener on moomoo?
Short Sale Analysis – Quickly Identify Market Sentiment
Customize Strategy - Pick Stocks in 4 Steps
How to Use Similar Charts
How to Use Position Cost Distribution
How to Use Heat List
How to Use Institutional Tracker
How to Use Heat Map
How to Interpret 15 Technical Indicators with 1 Feature
How to Custom Technical Indicators
How to Use Earnings Beat on moomoo
Free Real-Time Quotes: Have your Fingers on the Pulse of Short-Term Stock Prices
How to Use Short Sale Analysis
How to Paper Trade on moomoo
Evaluating Stocks with Candlestick Patterns
How to Use Options Screener
Financial analysis – Graphical presentation of data, business performance at a glance
How to Diversify Order Settings