How to Use Heat Map
In the ever-changing stock market, investors always need to stay on top of the market to quickly seize investment opportunities. But how can you make complex data clear and easy to understand? That's where a data visualization tool called the heat map comes in handy.
With different sizes and colors, the heat map provides a visual representation of stock price changes in an intuitive way.
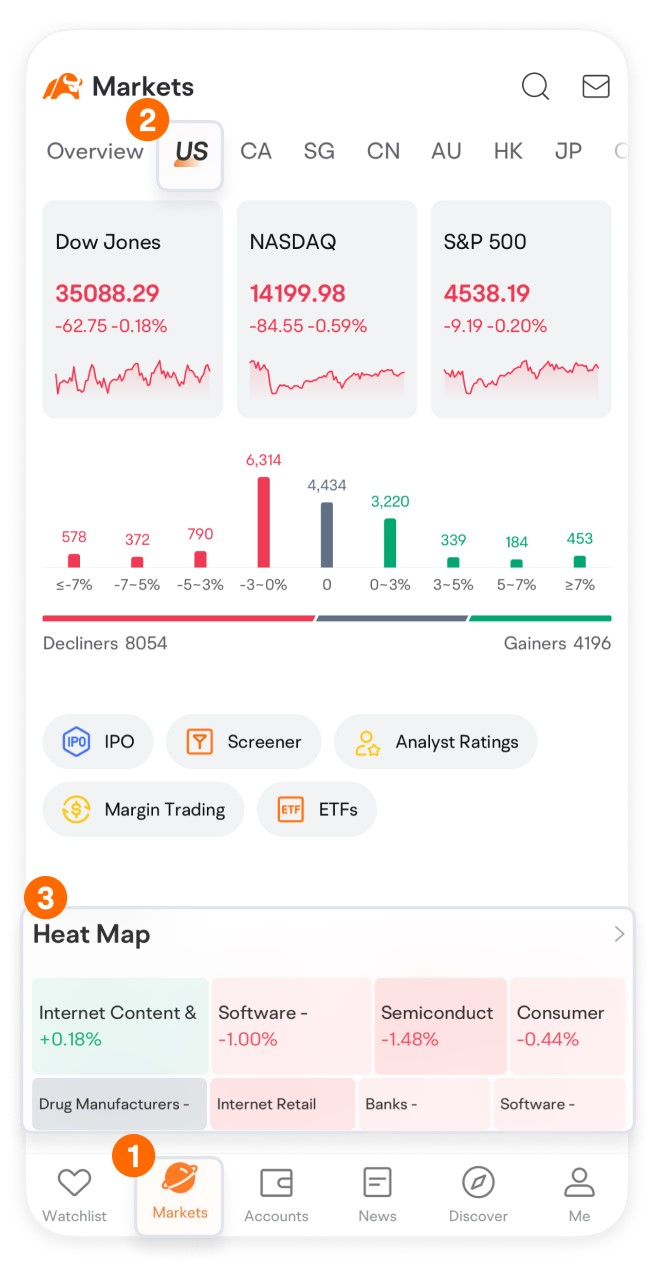
How do you find the Heat Map on moomoo?
Tap on Market > US, and scroll down to find Heat Map.
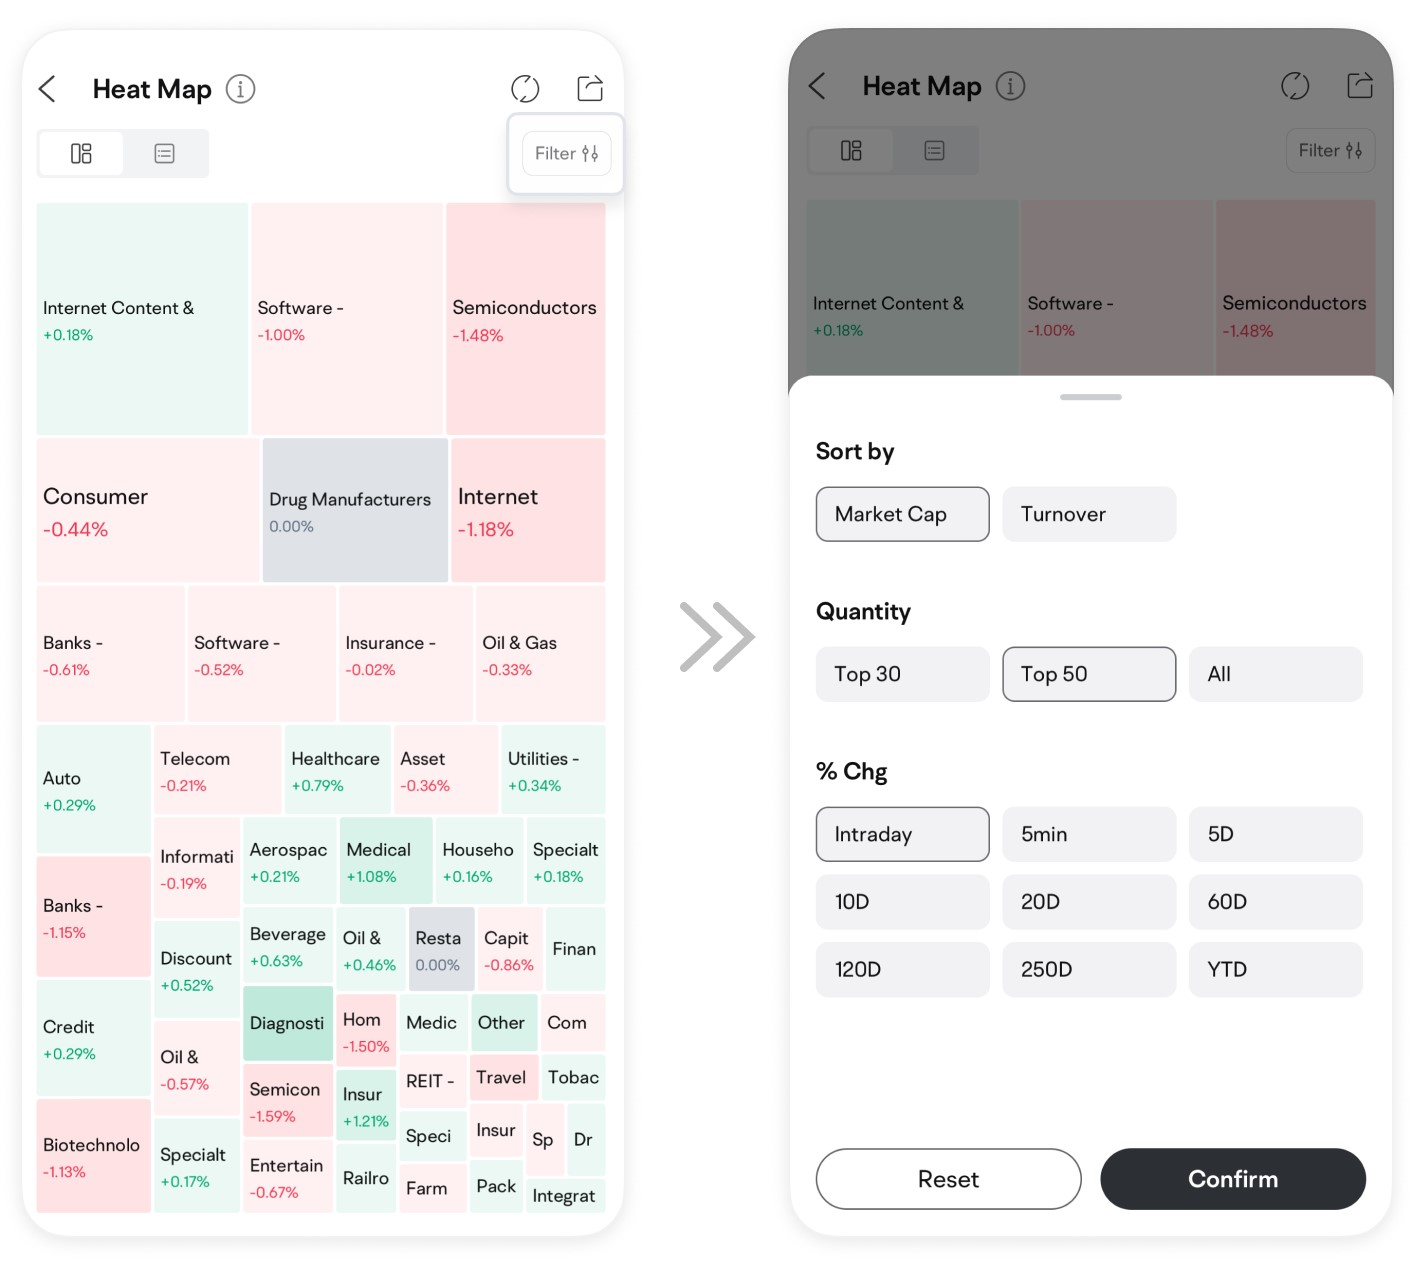
You can switch views in the upper left corner, while the upper right corner provides filtering options such as changing the sorting order of the color blocks, adjusting the number of color blocks, and selecting the time range for the data displayed.

How do you read the Heat Map?
The size of each color block represents the market or trading volume, with bigger blocks indicating higher market value or trading volume.
The color depth reflects the extent of the price change. For instance, on a heat map that uses green for gains and red for losses, a darker shade of green indicates a larger gain, while a deeper shade of red indicates a larger loss.
By looking at the heat map, you can see which sectors have the largest market values and which ones experience the most significant changes in prices. You might identify potential investment opportunities by tapping on a sector that takes you to a page listing individual stocks.

On moomoo's app, you can view heat maps for multiple countries or regions and sectors.
To view a heat map for a specific country or region, simply navigate to the corresponding category. You can easily check heat maps for US stocks, new listings, Singapore stocks, Canadian stocks, Australian stocks, and more.

However, it's important to note that heat maps should be used alongside other technical indicators and financial information to make informed investment decisions.
This presentation is for informational and educational use only and is not a recommendation or endorsement of any particular investment or investment strategy. Investment information provided in this content is general in nature, strictly for illustrative purposes, and may not be appropriate for all investors. Read more
Recommend
How to Use Level 2 market data

How to Use Capital Tracking
How to Place A Bracket Order

How to Use Limit and Market Orders
How to Switch Trading Mode
How to Track Earnings Reports
How to Do Financial Analysis
How to trade with advanced order types?
How to Use Moomoo's Ticks Feature
How to Manage Watchlist
How to Use Basic Order Types
How to Use Stock Screener on moomoo?
Short Sale Analysis – Quickly Identify Market Sentiment
Customize Strategy - Pick Stocks in 4 Steps
How to Use Similar Charts
How to Use Position Cost Distribution
How to Use Heat List
How to Use Institutional Tracker
How to Use Heat Map
How to Interpret 15 Technical Indicators with 1 Feature
How to Custom Technical Indicators
How to Use Earnings Beat on moomoo
Free Real-Time Quotes: Have your Fingers on the Pulse of Short-Term Stock Prices
How to Use Short Sale Analysis
How to Paper Trade on moomoo
Evaluating Stocks with Candlestick Patterns
How to Use Options Screener
Financial analysis – Graphical presentation of data, business performance at a glance
How to Diversify Order Settings
How to Use Level 2 market data
How to Use Capital Tracking
How to Place A Bracket Order
How to Use Limit and Market Orders
How to Switch Trading Mode
How to Track Earnings Reports
How to Do Financial Analysis
How to trade with advanced order types?
How to Use Moomoo's Ticks Feature
How to Manage Watchlist
How to Use Basic Order Types
How to Use Stock Screener on moomoo?
Short Sale Analysis – Quickly Identify Market Sentiment
Customize Strategy - Pick Stocks in 4 Steps
How to Use Similar Charts
How to Use Position Cost Distribution
How to Use Heat List
How to Use Institutional Tracker
How to Use Heat Map
How to Interpret 15 Technical Indicators with 1 Feature
How to Custom Technical Indicators
How to Use Earnings Beat on moomoo
Free Real-Time Quotes: Have your Fingers on the Pulse of Short-Term Stock Prices
How to Use Short Sale Analysis
How to Paper Trade on moomoo
Evaluating Stocks with Candlestick Patterns
How to Use Options Screener
Financial analysis – Graphical presentation of data, business performance at a glance
How to Diversify Order Settings