How to Use Earnings Beat on moomoo
What is Earnings Beat?
Analysts forecast a company's earnings based on its past performance and market trends. If a company's actual earnings beat or miss expectations, its stock price may move accordingly.
How does it help investors?
1. Identify top performers during earnings season.
2. Capitalize on market volatility from earnings surprises.
How to use Earnings Beat on moomoo
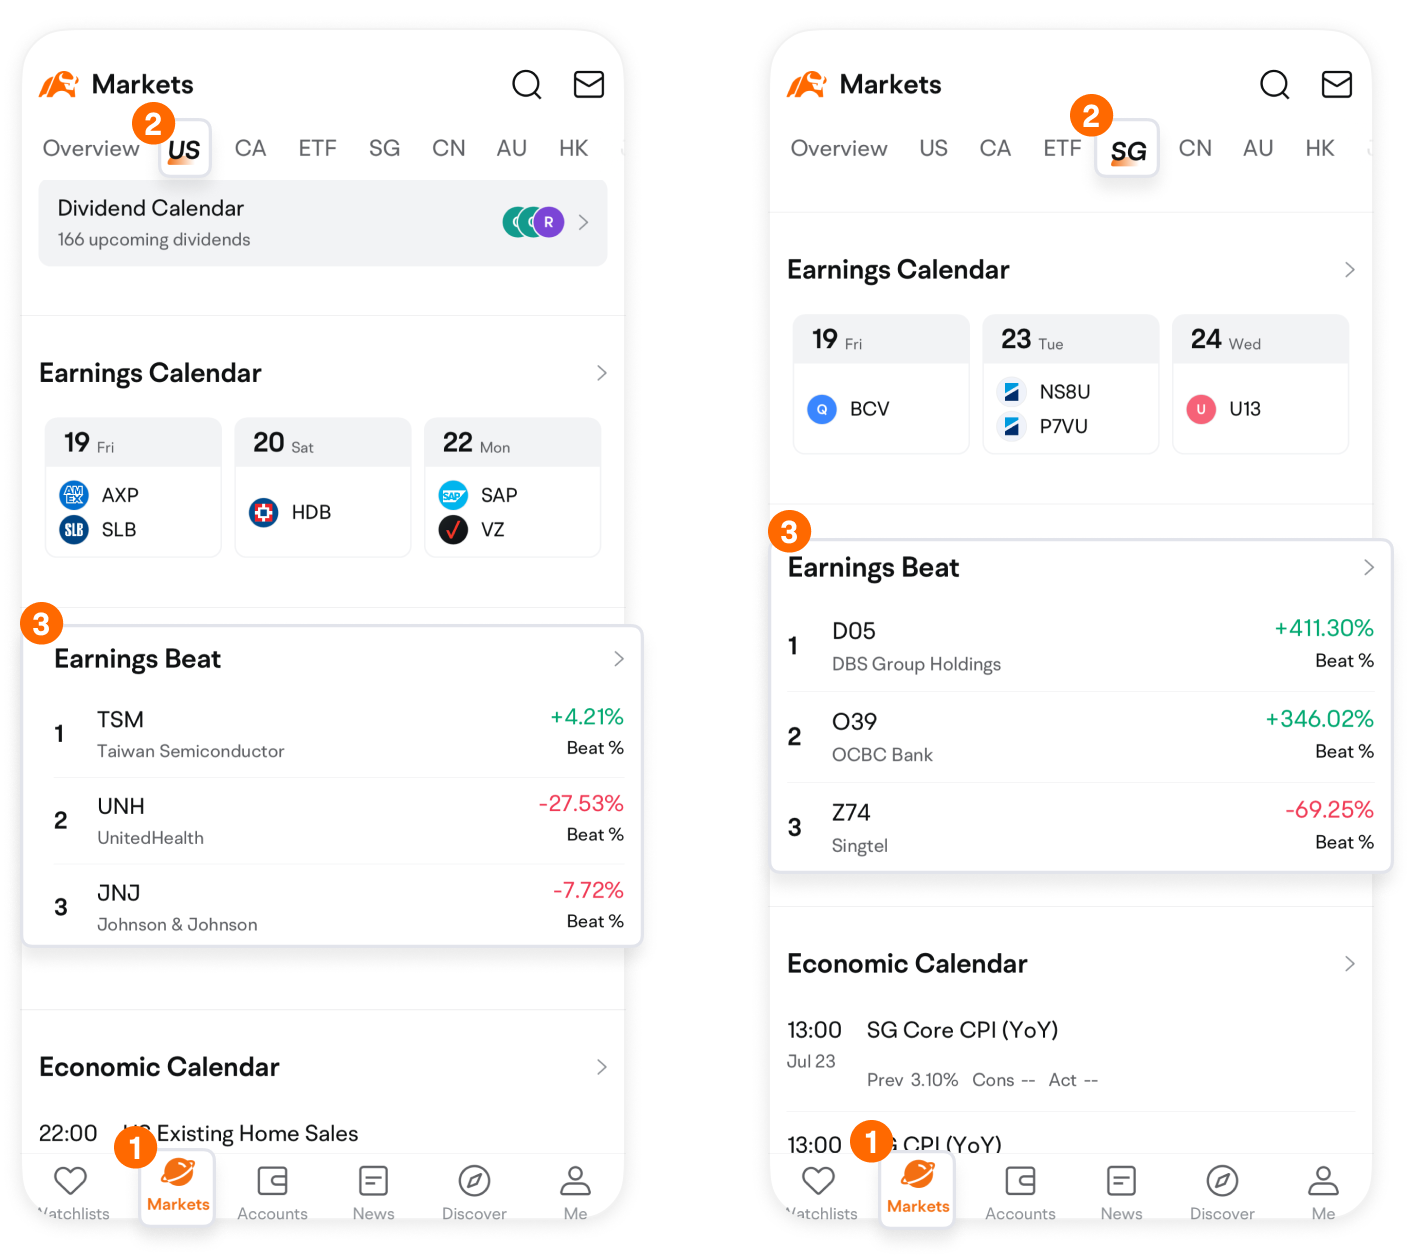
Markets > US/CA/SG.. > Earnings Beat. Each tab shows earnings data for that market.
The Overview tab displays the top 3 stocks by market cap. Positive percentages mean earnings exceeded expectations; negative means they fell short. Data updates immediately after new release.
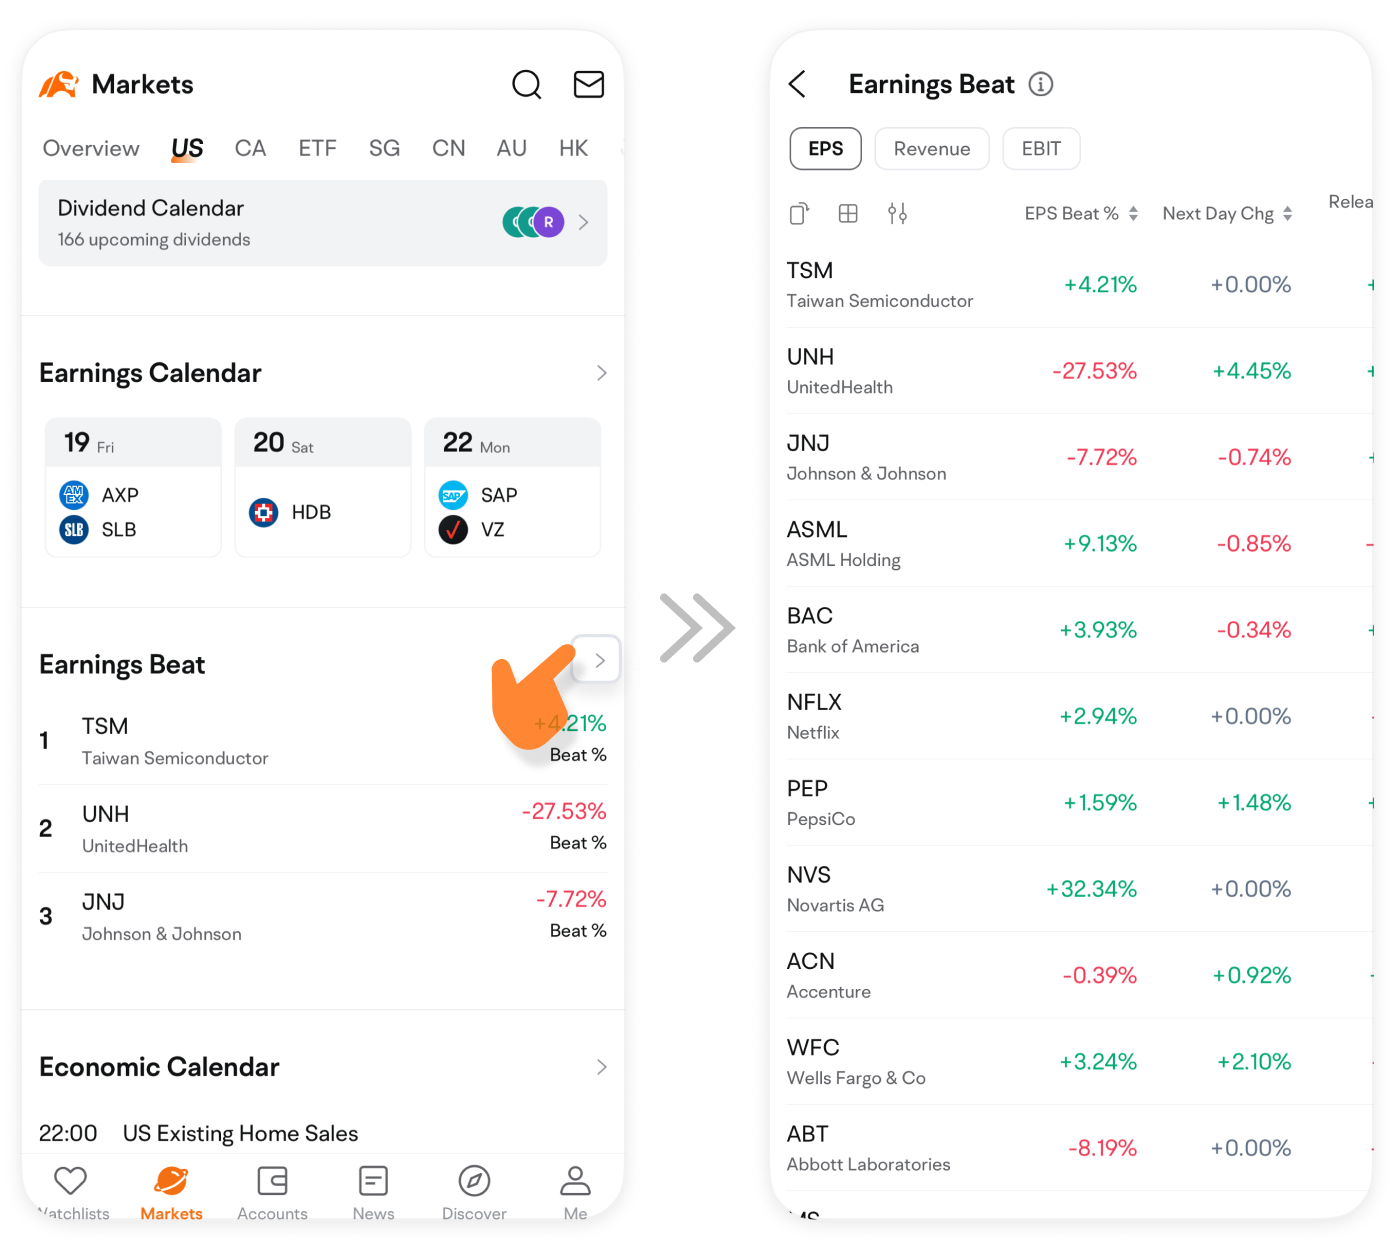
Click the right arrow for detailed stock lists.
Exploring Earnings Beat
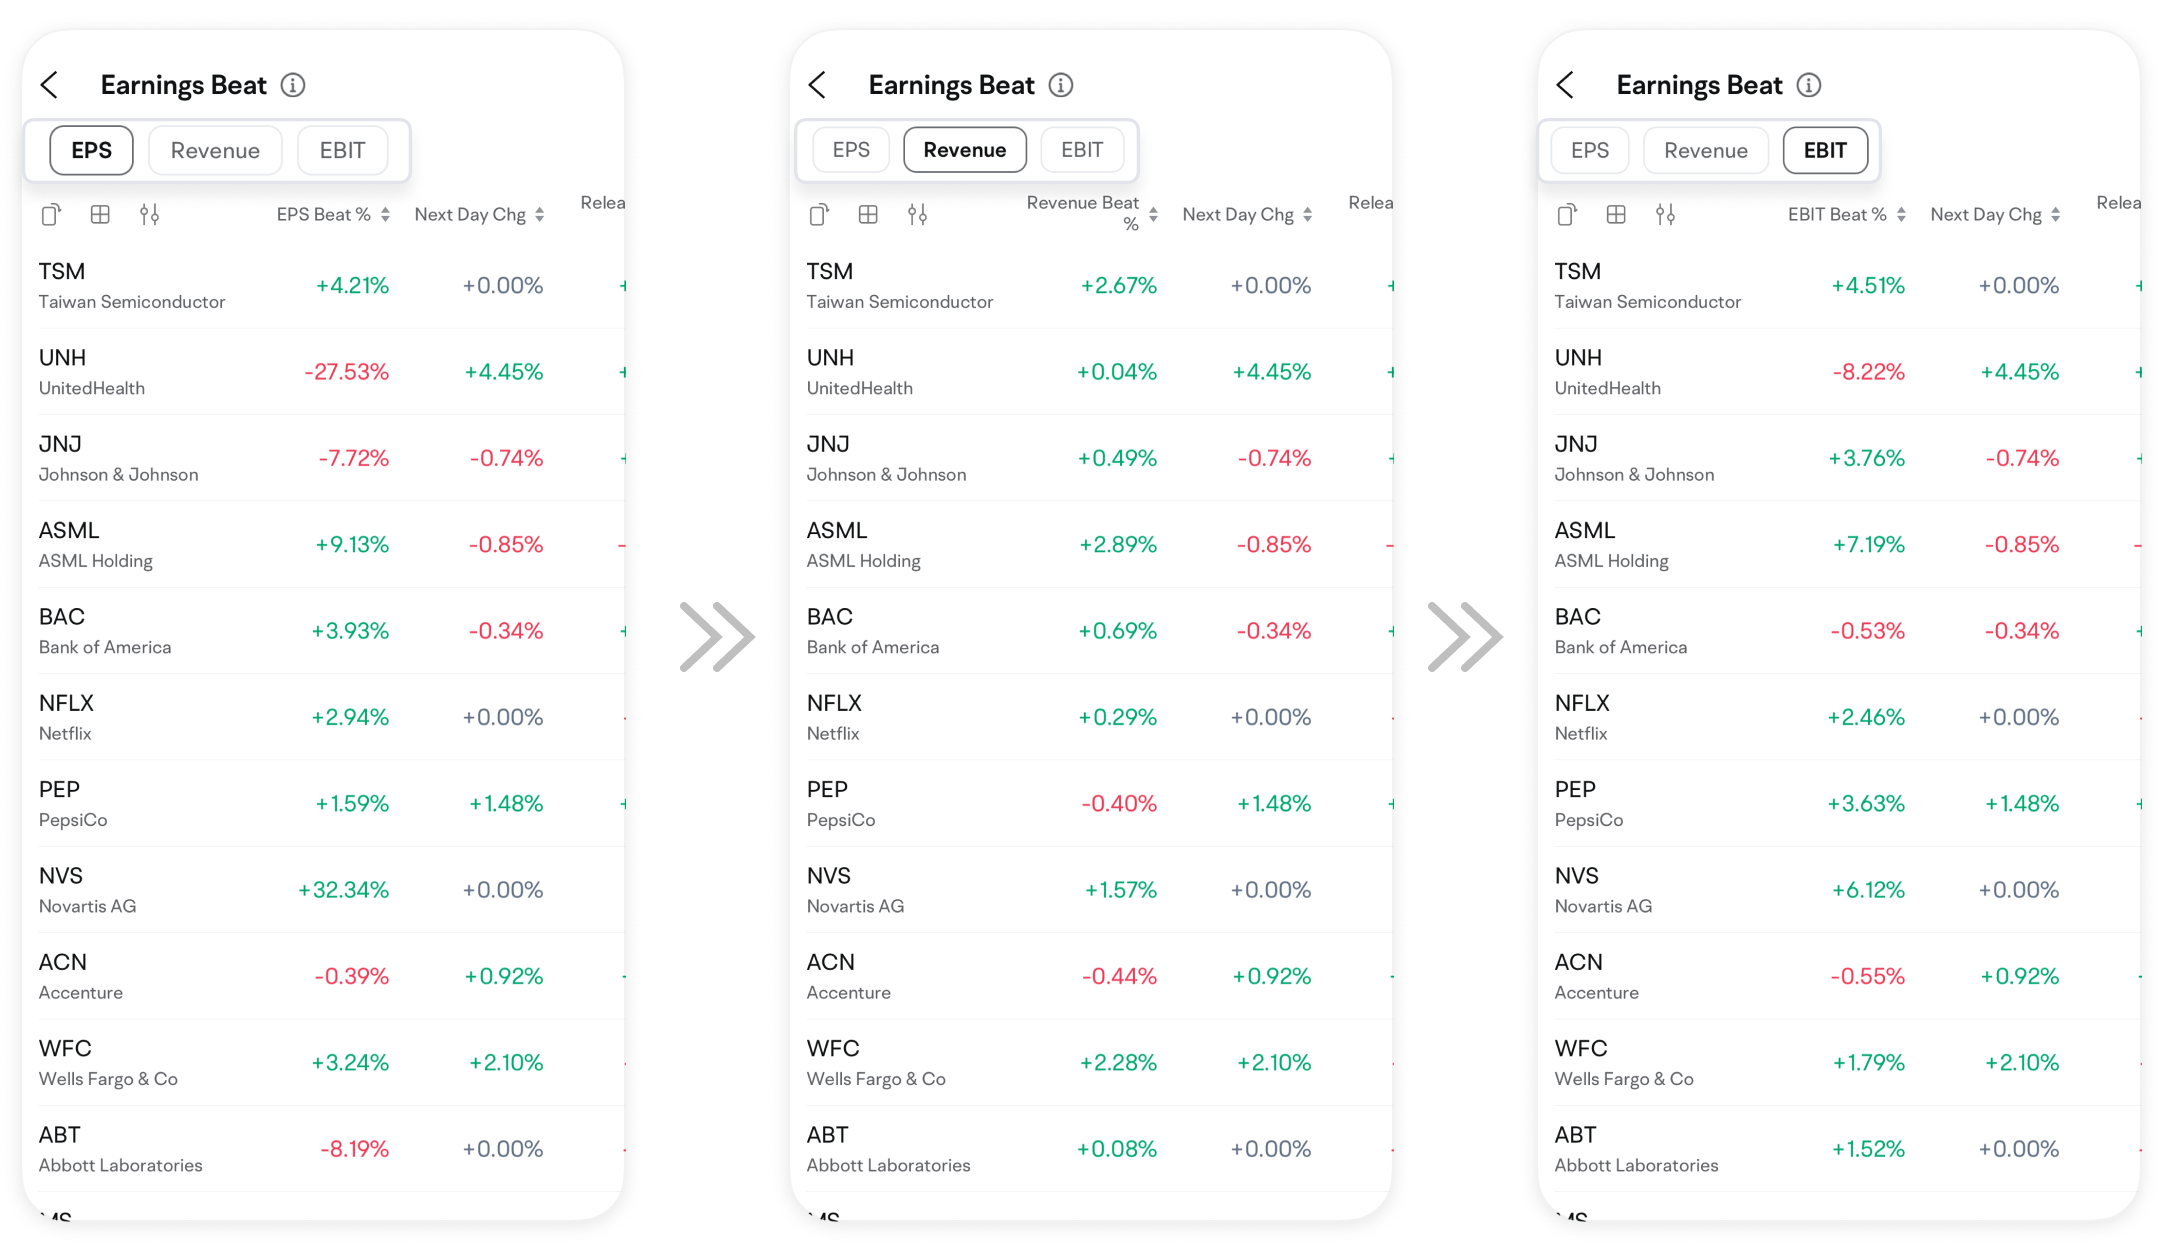
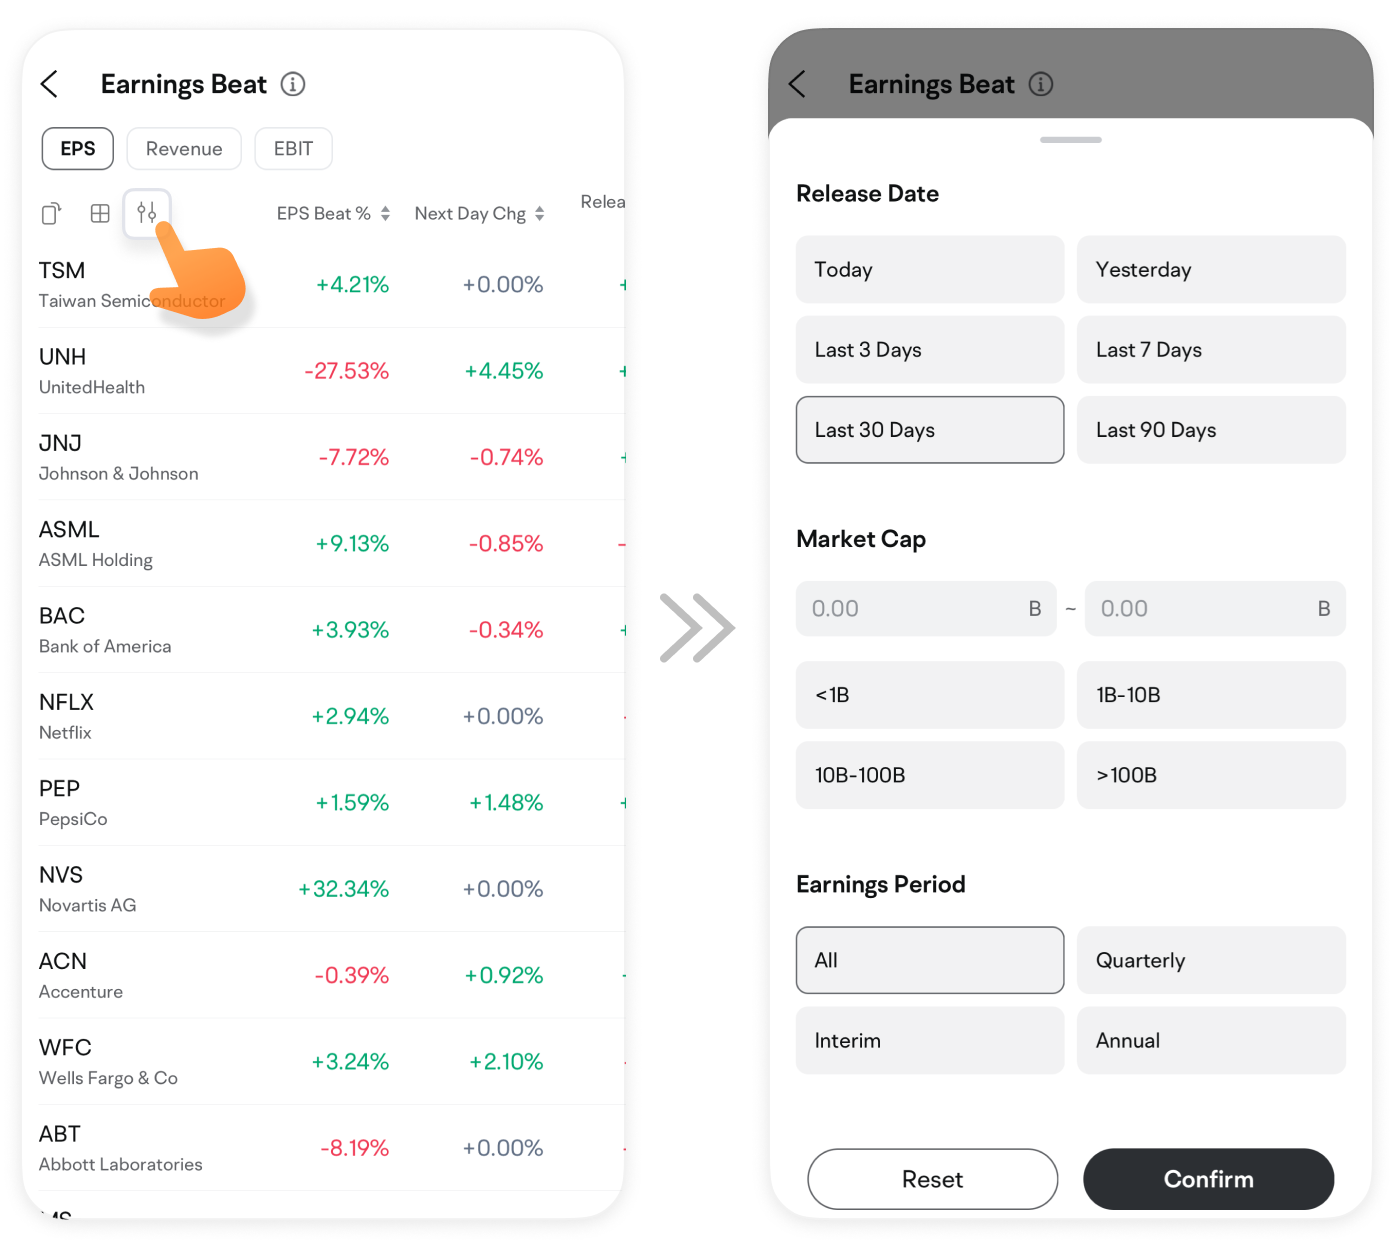
Going to the Earnings Beat page, you'll find three tabs at the top: EPS, Revenue, and EBIT. Click on each to view their earnings beat data.
In addition to earnings beat ratios, moomoo offers a wealth of data:
· Earnings day and next-day price changes (positive for gains, negative for losses)
· Report release time, actual vs. forecast values, last year's actual values, year-over-year growth, market cap, and P/E ratio (TTM).
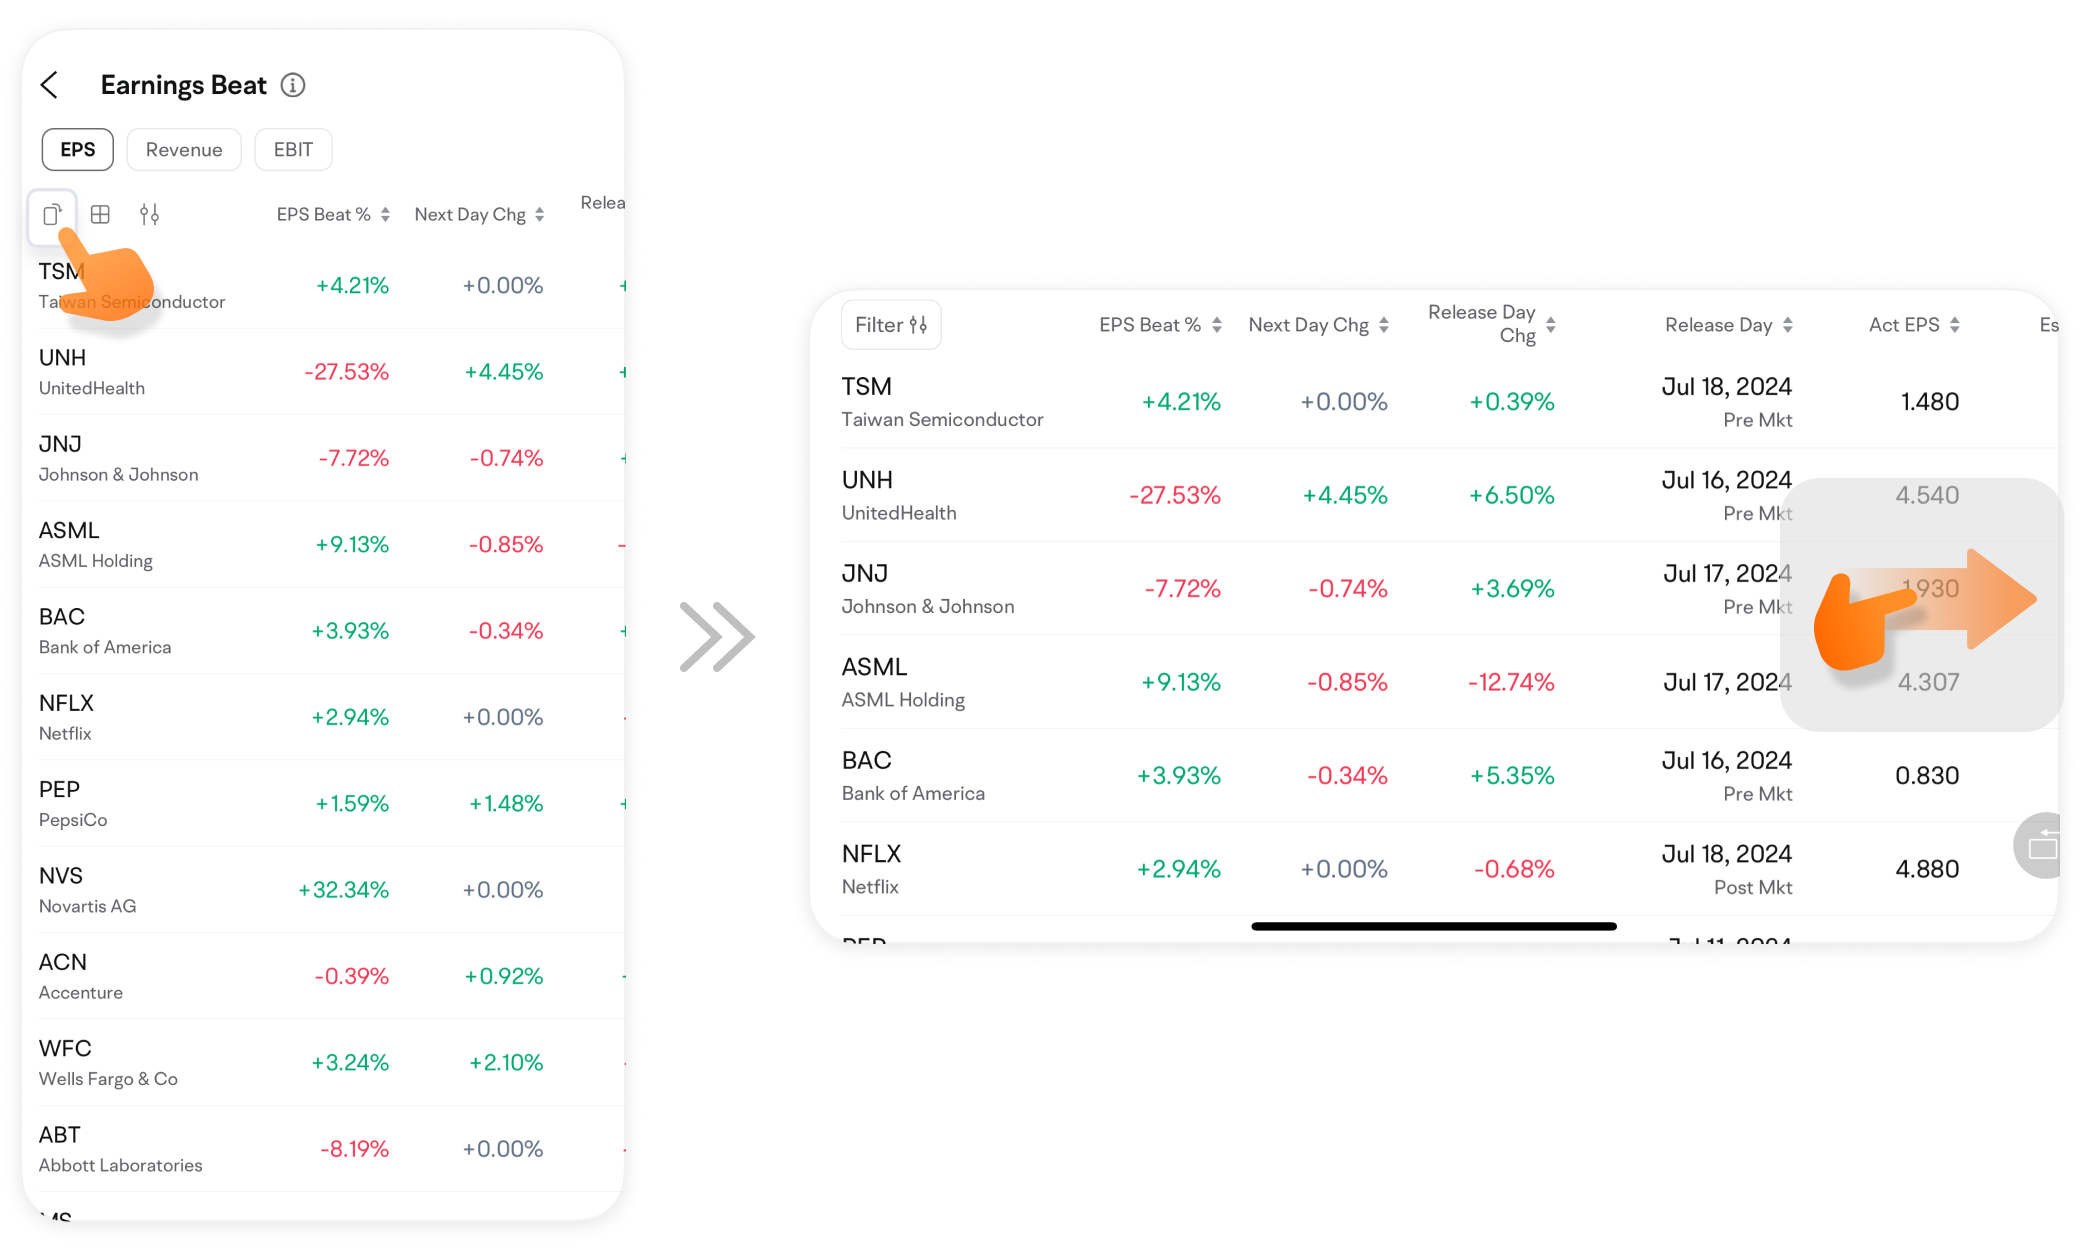
Swipe left/right or use landscape mode for more data. The stock list below is sorted by market cap by default. Click the small triangle next to any field to re-sort (except for the earnings period field).
Earnings Beat Filters
Tap the filter icon to choose criteria like release date, period, market cap, P/E ratio, and beat ratio. These filters help you narrow down your search and find the earnings data you’re interested in.
Case study
The market often focuses on Earnings Per Share (EPS) as it represents a company's net profit level. When a company's EPS significantly exceeds market expectations, it usually indicates strong business performance, often driving short-term stock price increases and boosting long-term investor confidence. Use the Earnings Beat feature to quickly find top stocks with EPS beats.
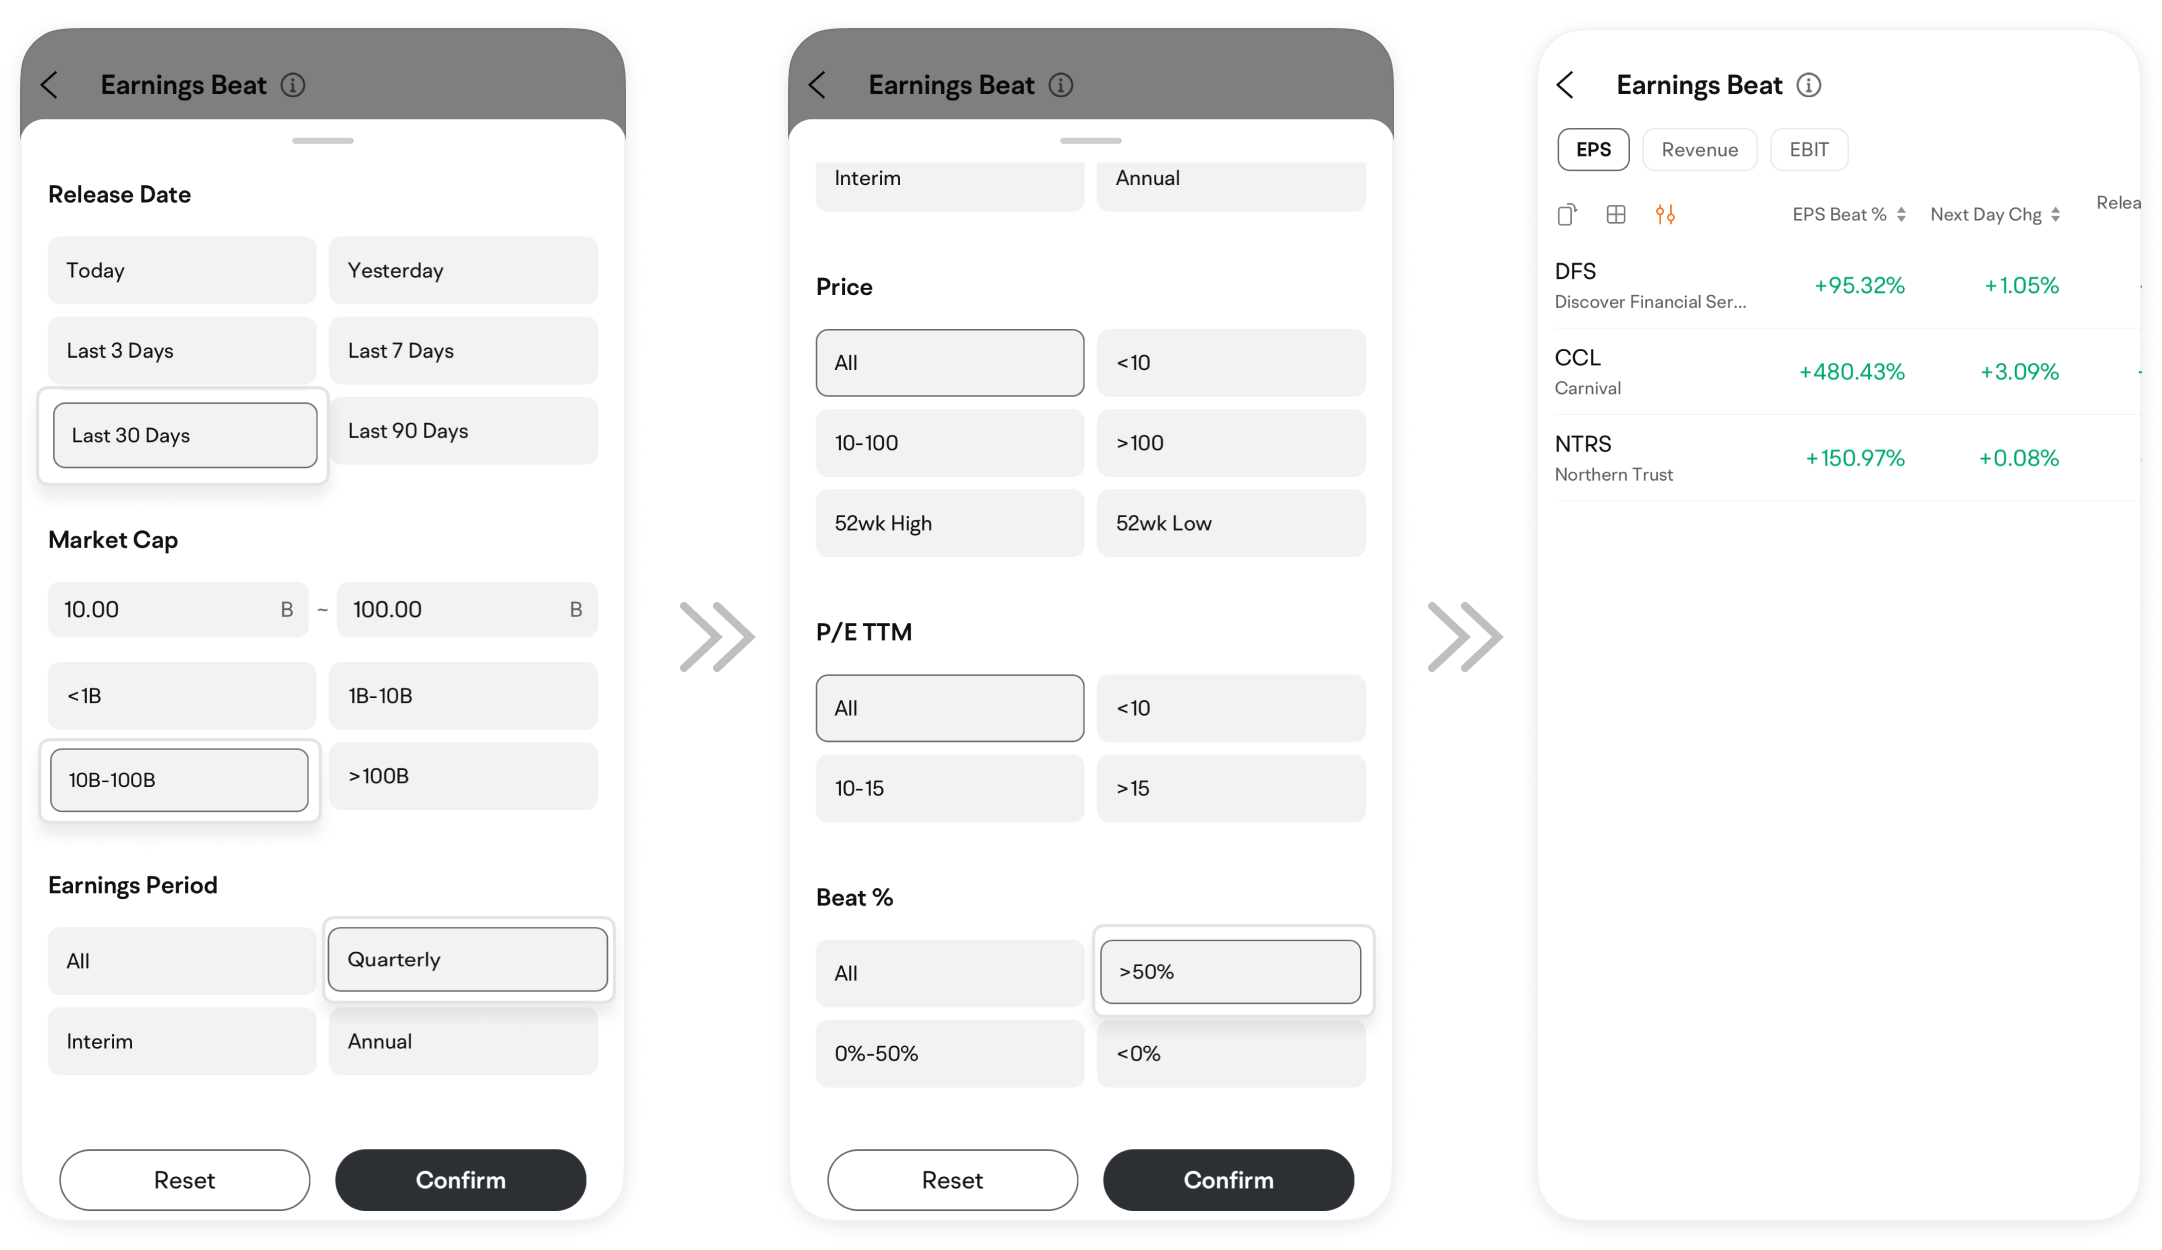
Go to Earnings Beat > EPS, and use the filters to streamline your search. For example:
Select companies that released earnings in the past 30 days.
Set the market cap range from $10 billion to $100 billion if you're interested in large-cap stocks.
Choose "Quarterly" as the period.
Set the beat ratio to >50%.
Keep other options at their default values. Click "Done" to generate a list of stocks with significant EPS beats.
Remember, even if a company reports excellent earnings, its stock price might still fall due to other factors investors consider. Therefore, it's essential to use a combination of fundamental and technical analysis to make well-informed investment decisions.
This presentation is for informational and educational use only and is not a recommendation or endorsement of any particular investment or investment strategy. Investment information provided in this content is general in nature, strictly for illustrative purposes, and may not be appropriate for all investors. Read more
Recommend

How to Use Level 2 market data

How to Use Capital Tracking

How to Place A Bracket Order

How to Use Limit and Market Orders
How to Switch Trading Mode
How to Track Earnings Reports
How to Do Financial Analysis
How to trade with advanced order types?
How to Use Moomoo's Ticks Feature
How to Manage Watchlist
How to Use Basic Order Types
How to Use Stock Screener on moomoo?
Short Sale Analysis – Quickly Identify Market Sentiment
Customize Strategy - Pick Stocks in 4 Steps
How to Use Similar Charts
How to Use Position Cost Distribution
How to Use Heat List
How to Use Institutional Tracker
How to Use Heat Map
How to Interpret 15 Technical Indicators with 1 Feature
How to Custom Technical Indicators
How to Use Earnings Beat on moomoo
Free Real-Time Quotes: Have your Fingers on the Pulse of Short-Term Stock Prices
How to Use Short Sale Analysis
How to Paper Trade on moomoo
Evaluating Stocks with Candlestick Patterns
How to Use Options Screener
Financial analysis – Graphical presentation of data, business performance at a glance
How to Diversify Order Settings
How to Use Level 2 market data
How to Use Capital Tracking
How to Place A Bracket Order
How to Use Limit and Market Orders
How to Switch Trading Mode
How to Track Earnings Reports
How to Do Financial Analysis
How to trade with advanced order types?
How to Use Moomoo's Ticks Feature
How to Manage Watchlist
How to Use Basic Order Types
How to Use Stock Screener on moomoo?
Short Sale Analysis – Quickly Identify Market Sentiment
Customize Strategy - Pick Stocks in 4 Steps
How to Use Similar Charts
How to Use Position Cost Distribution
How to Use Heat List
How to Use Institutional Tracker
How to Use Heat Map
How to Interpret 15 Technical Indicators with 1 Feature
How to Custom Technical Indicators
How to Use Earnings Beat on moomoo
Free Real-Time Quotes: Have your Fingers on the Pulse of Short-Term Stock Prices
How to Use Short Sale Analysis
How to Paper Trade on moomoo
Evaluating Stocks with Candlestick Patterns
How to Use Options Screener
Financial analysis – Graphical presentation of data, business performance at a glance
How to Diversify Order Settings