Evaluating Stocks with Candlestick Patterns
It's hard to find stocks with potential? Moomoo might help.
Generally, we select stocks by analyzing fundamentals or technical indicators, such as candlestick patterns and chart formations.
In this tutorial, we'll show you how to access Candlestick Patterns on moomoo.
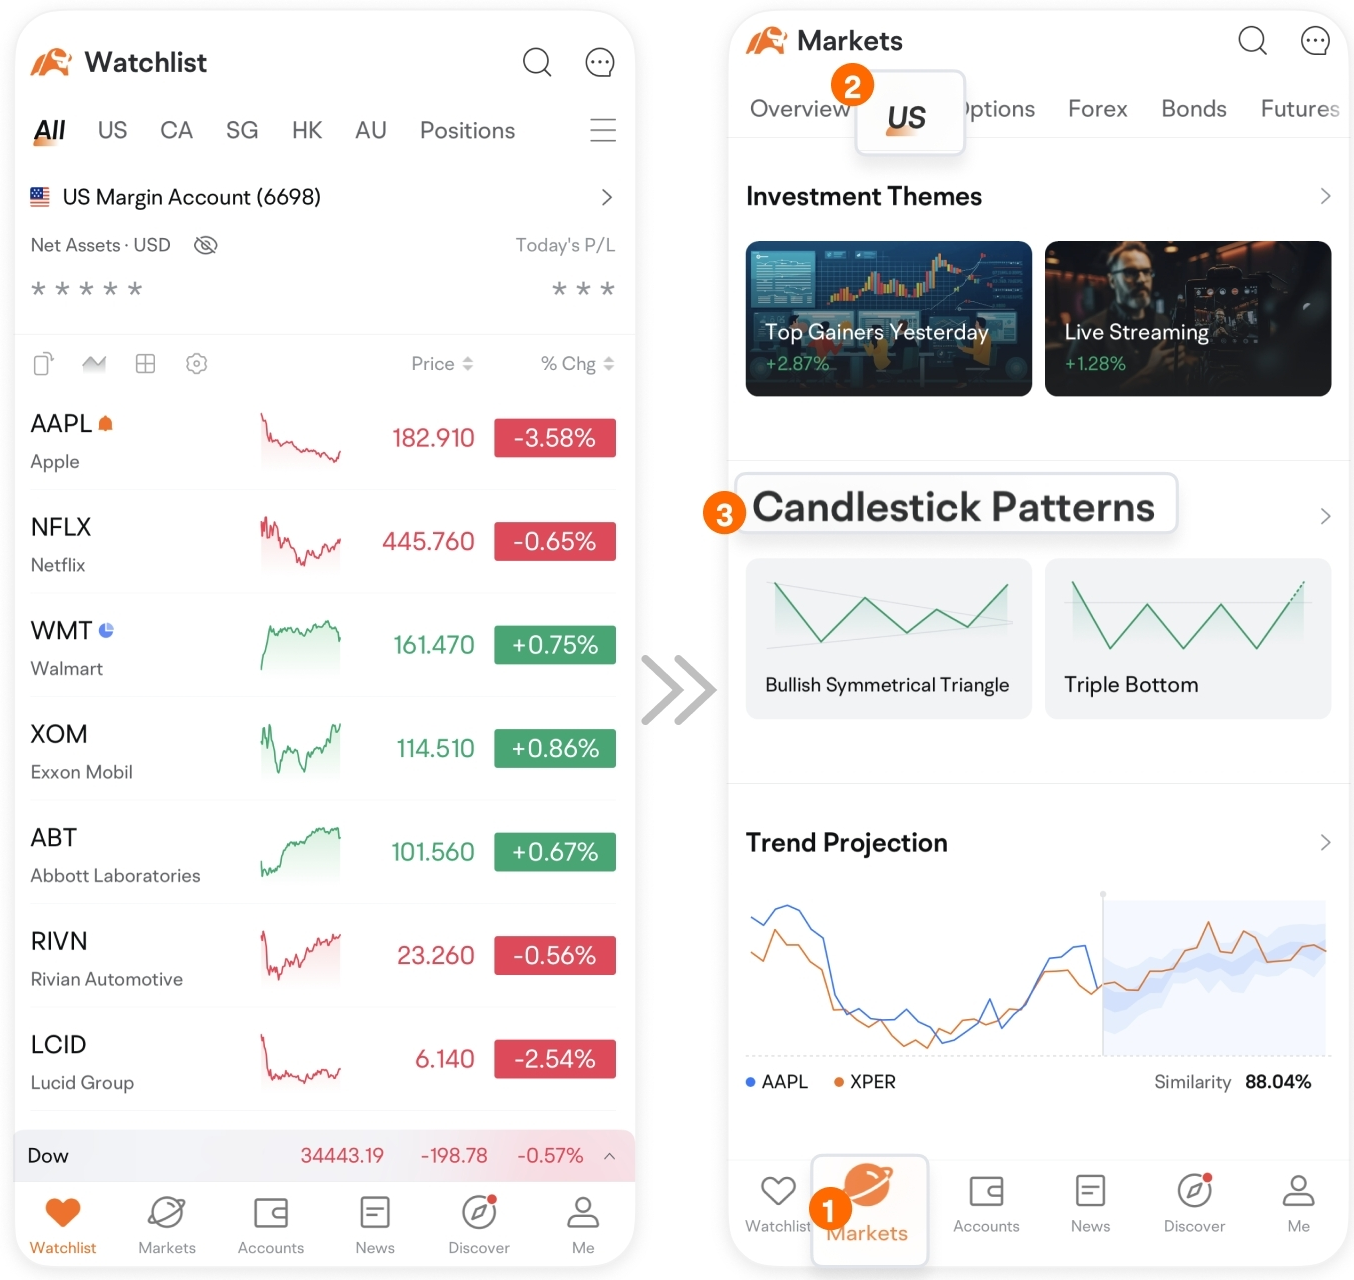
Tap Markets> US> Candlestick Patterns
Here we list 20 common bullish and bearish patterns.
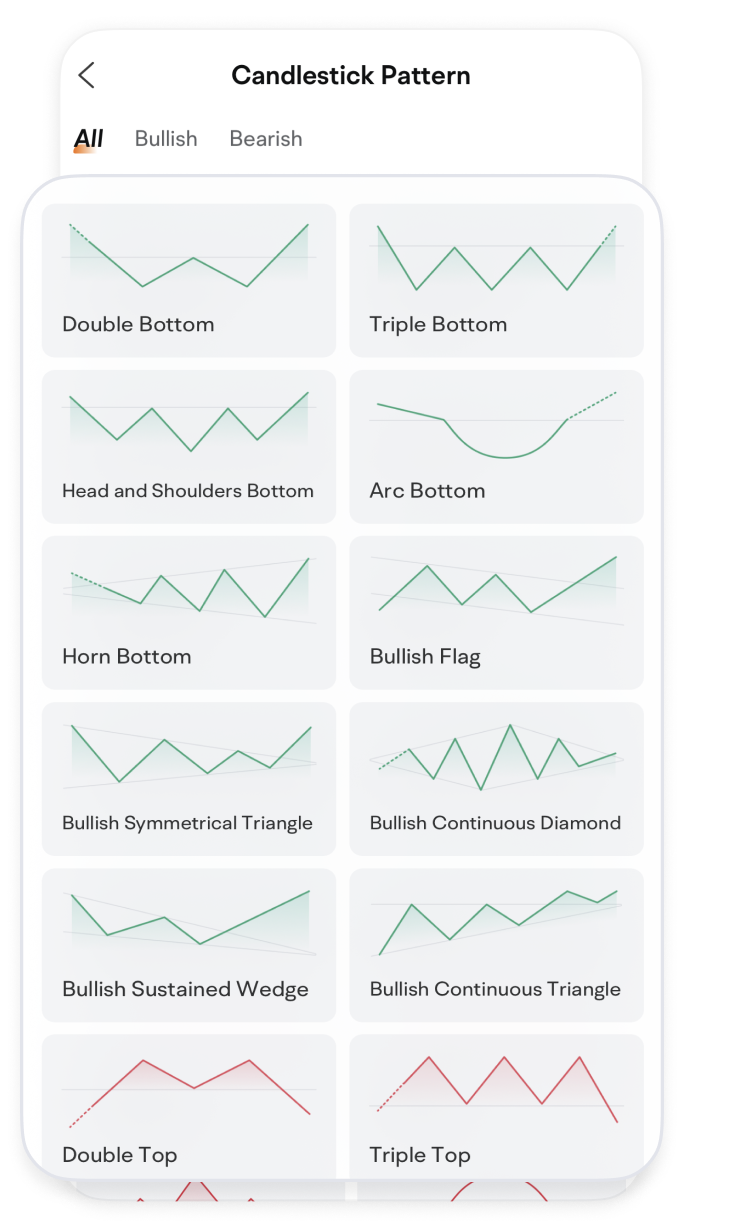
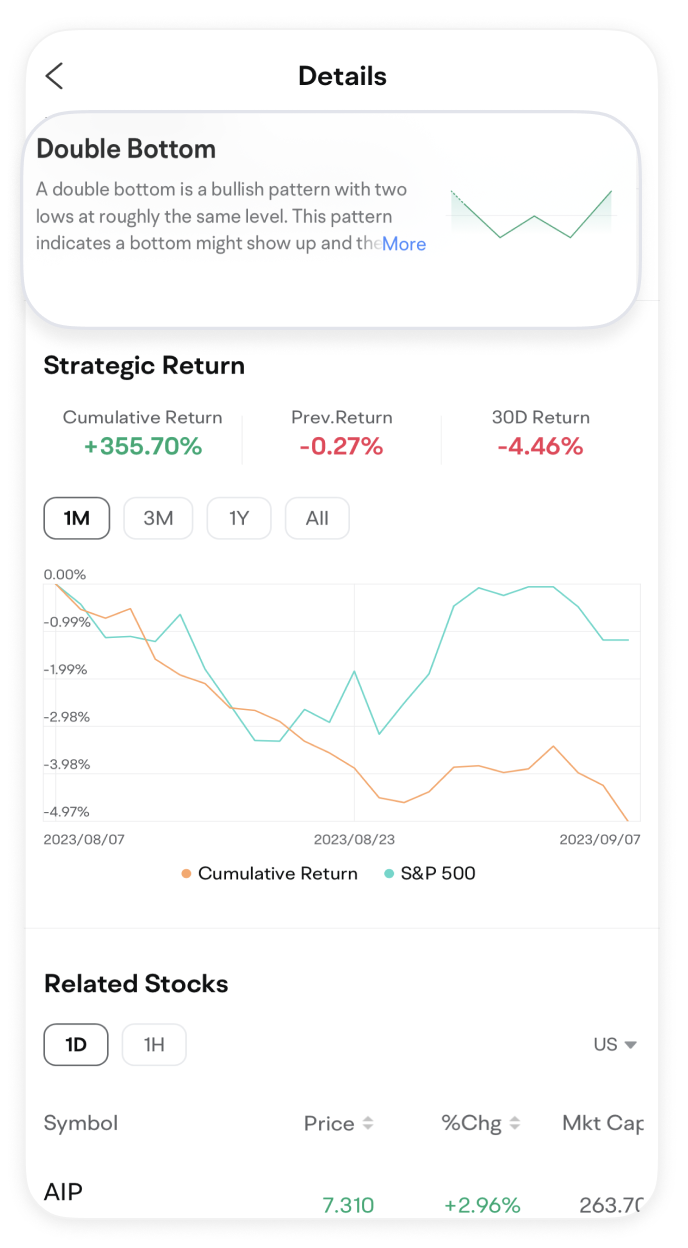
Tap on a pattern to see stocks with the most similar candlestick formations to the selected pattern.
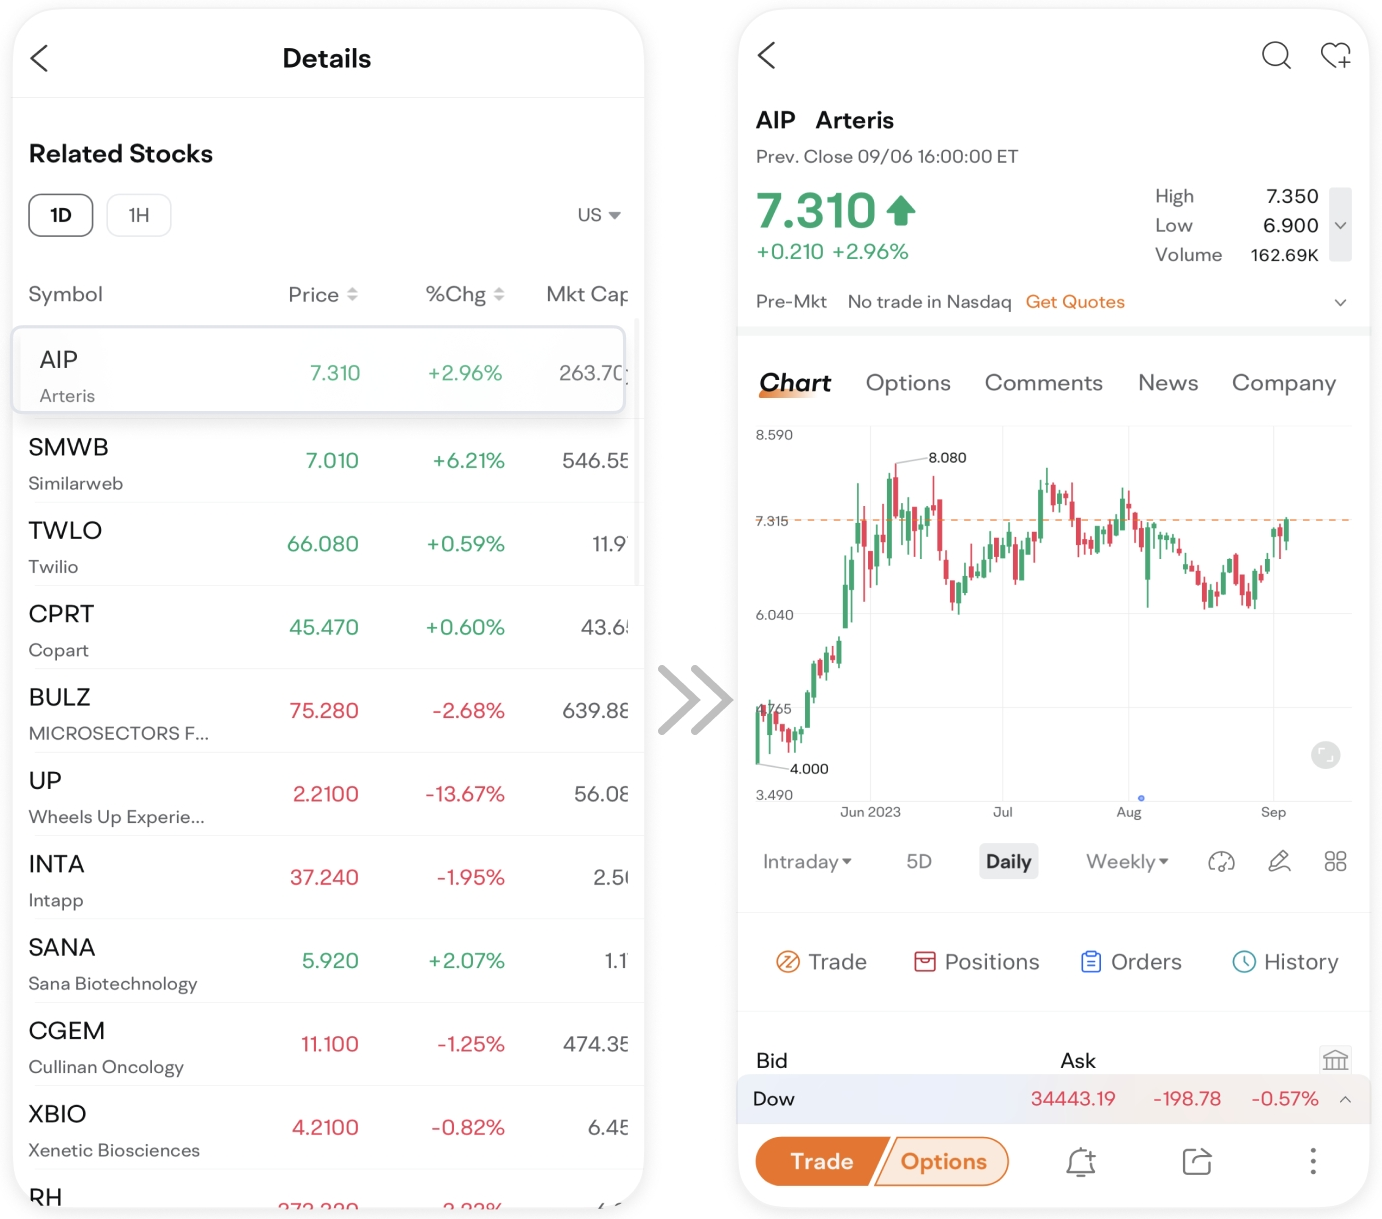
Then select a screened stock to view its detailed quotes page for more information.
How to show the pattern on the stock's candlestick chart?
Detailed Quotes> Toolbox>Chart Settings> Candlestick Chart Info> Enable Candlestick Pattern.
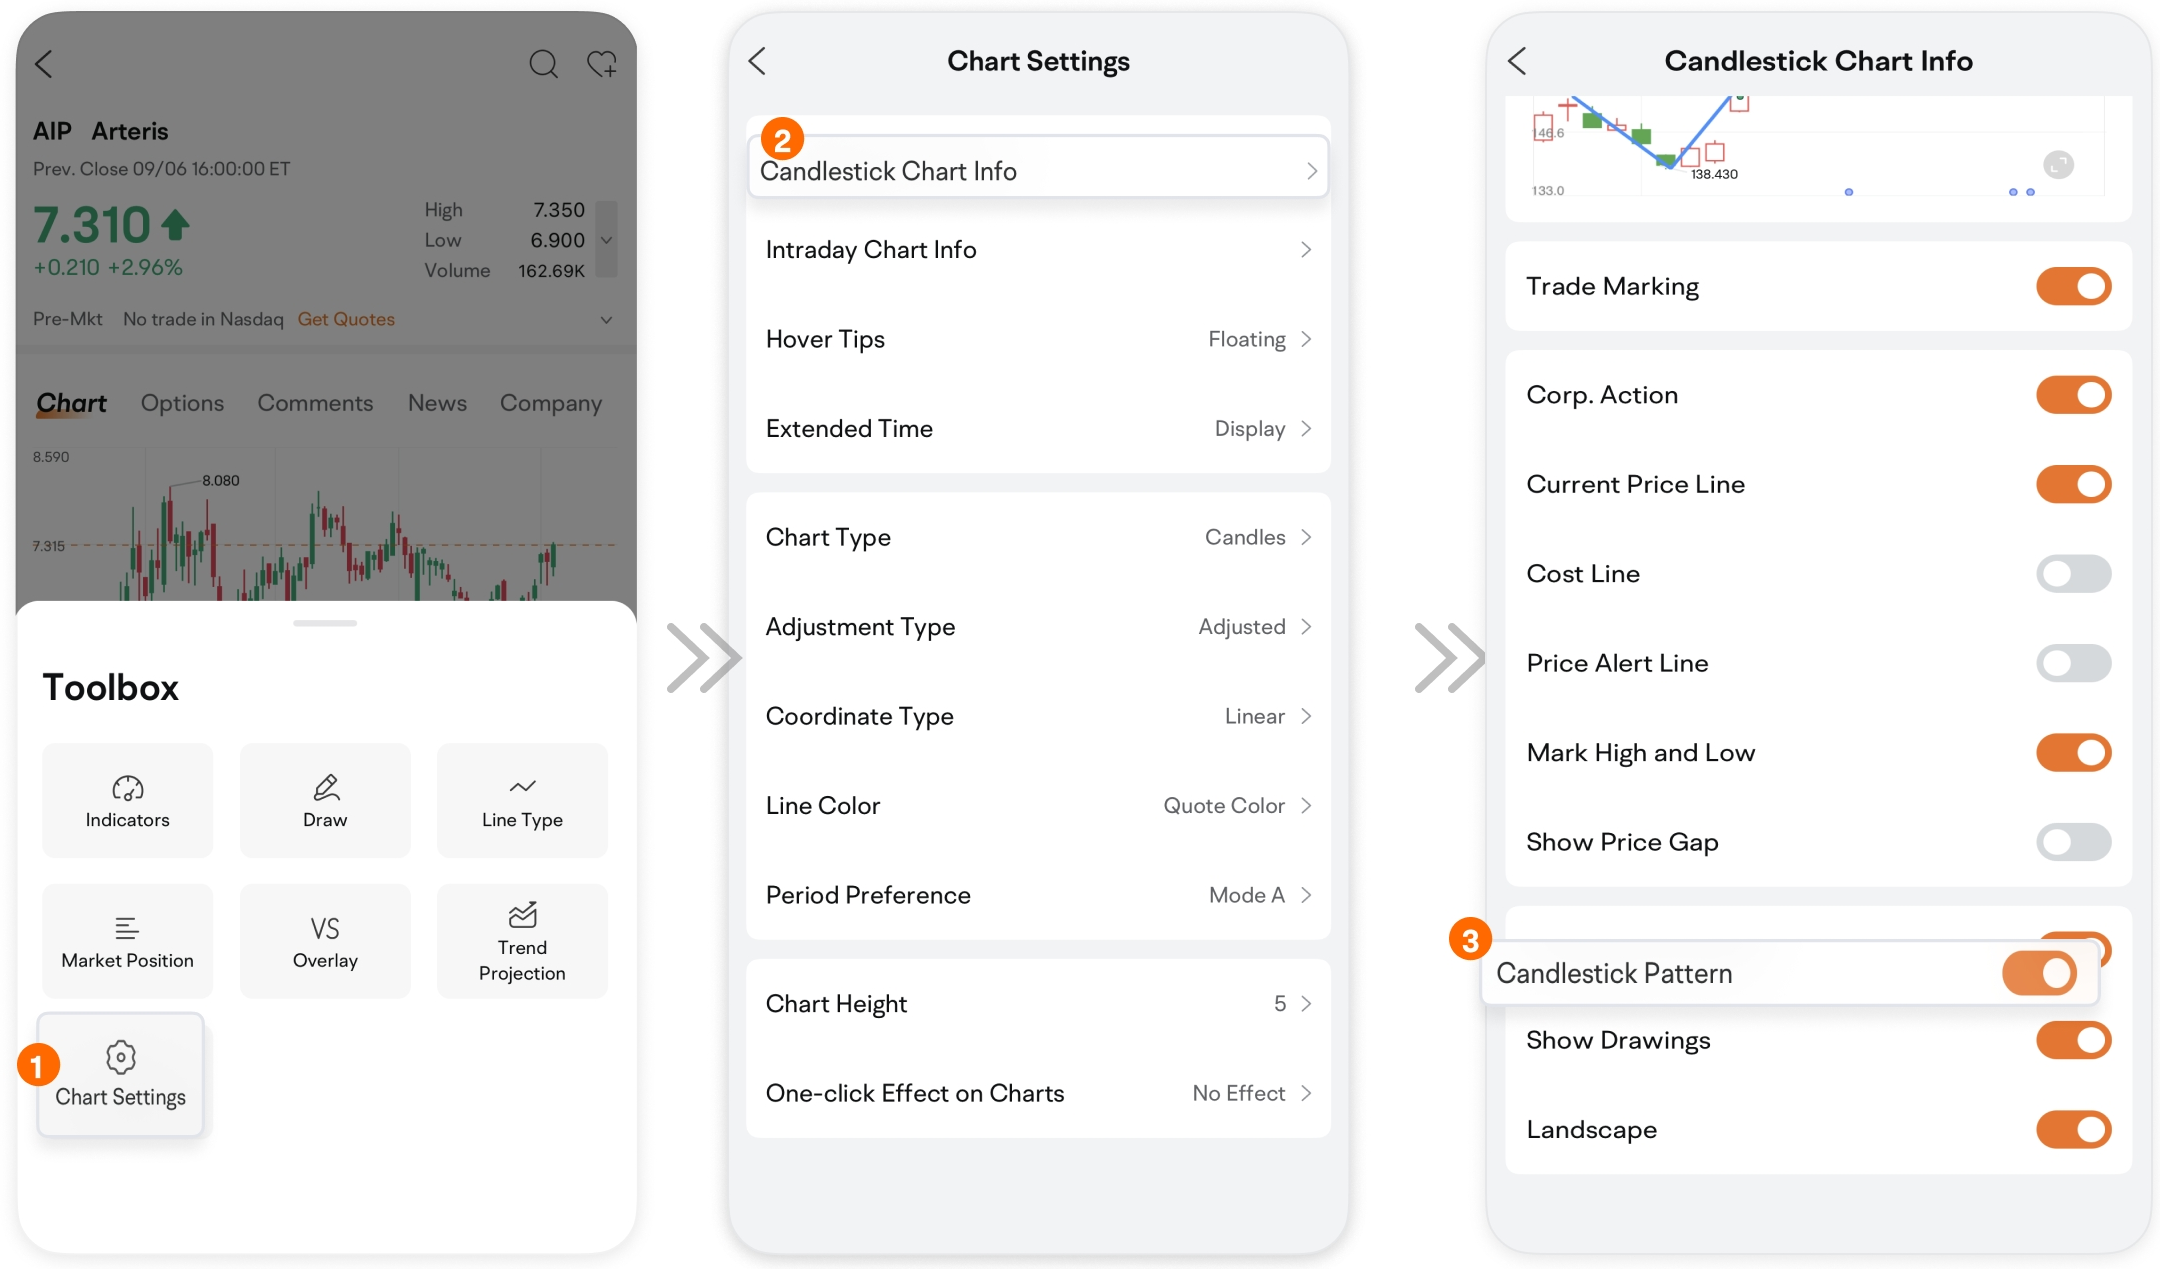
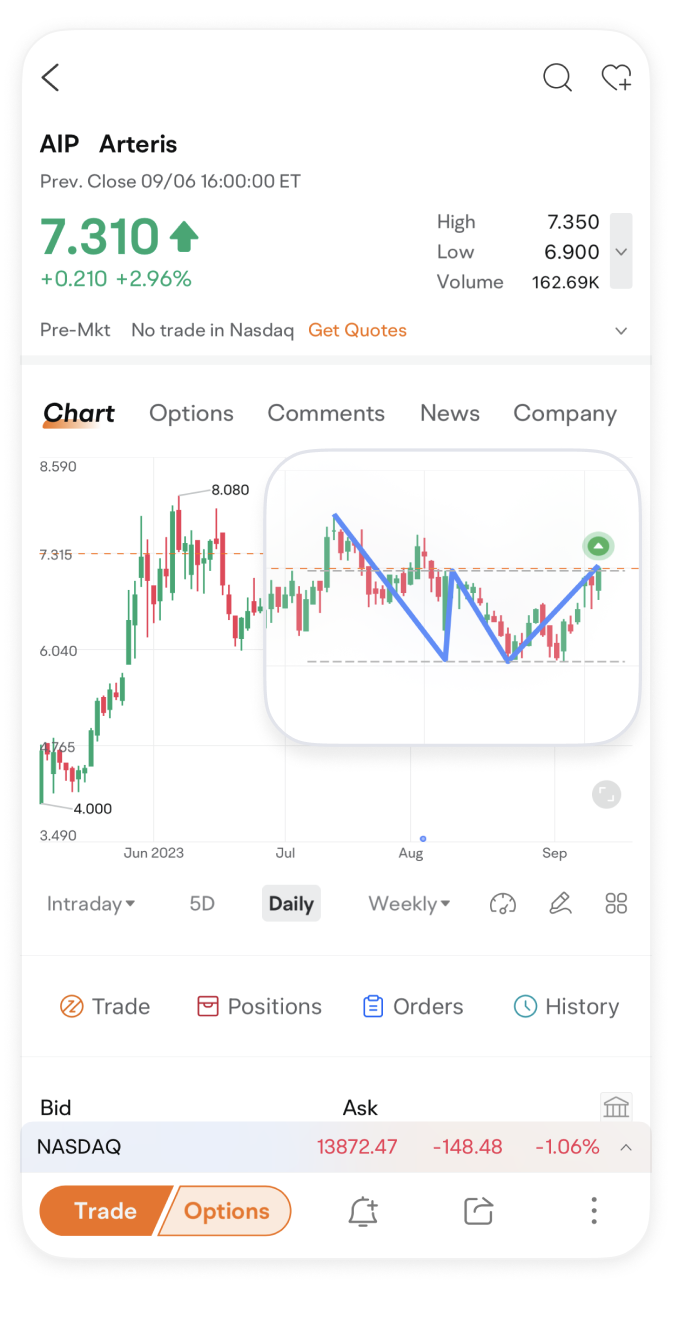
If the Candlestick Pattern switch is enabled, the pattern will be automatically depicted on the chart, saving us the trouble of drawing it on our own.
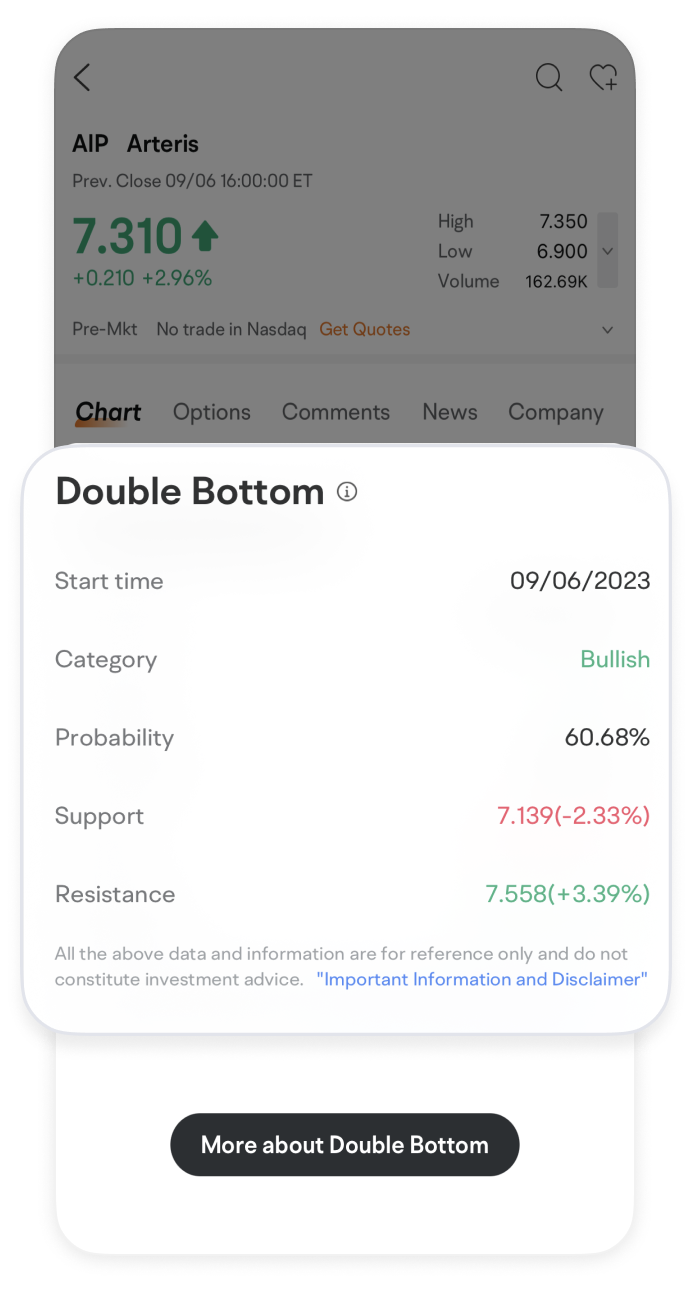
Tap on the pattern to view support and resistance level estimates and the next day's rise probability.
This feature uses big data and image recognition algorithms to quickly identify stocks that may meet your criteria.
However, it's important to remember that when making investment decisions, other factors, including fundamentals and market sentiment should also be taken into consideration.
This presentation is for informational and educational use only and is not a recommendation or endorsement of any particular investment or investment strategy. Investment information provided in this content is general in nature, strictly for illustrative purposes, and may not be appropriate for all investors. Read more
Recommend

How to Use Level 2 market data

How to Use Capital Tracking

How to Place A Bracket Order

How to Use Limit and Market Orders
How to Switch Trading Mode
How to Track Earnings Reports
How to Do Financial Analysis
How to trade with advanced order types?
How to Use Moomoo's Ticks Feature
How to Manage Watchlist
How to Use Basic Order Types
How to Use Stock Screener on moomoo?
Short Sale Analysis – Quickly Identify Market Sentiment
Customize Strategy - Pick Stocks in 4 Steps
How to Use Similar Charts
How to Use Position Cost Distribution
How to Use Heat List
How to Use Institutional Tracker
How to Use Heat Map
How to Interpret 15 Technical Indicators with 1 Feature
How to Custom Technical Indicators
How to Use Earnings Beat on moomoo
Free Real-Time Quotes: Have your Fingers on the Pulse of Short-Term Stock Prices
How to Use Short Sale Analysis
How to Paper Trade on moomoo
Evaluating Stocks with Candlestick Patterns
How to Use Options Screener
Financial analysis – Graphical presentation of data, business performance at a glance
How to Diversify Order Settings
How to Use Level 2 market data
How to Use Capital Tracking
How to Place A Bracket Order
How to Use Limit and Market Orders
How to Switch Trading Mode
How to Track Earnings Reports
How to Do Financial Analysis
How to trade with advanced order types?
How to Use Moomoo's Ticks Feature
How to Manage Watchlist
How to Use Basic Order Types
How to Use Stock Screener on moomoo?
Short Sale Analysis – Quickly Identify Market Sentiment
Customize Strategy - Pick Stocks in 4 Steps
How to Use Similar Charts
How to Use Position Cost Distribution
How to Use Heat List
How to Use Institutional Tracker
How to Use Heat Map
How to Interpret 15 Technical Indicators with 1 Feature
How to Custom Technical Indicators
How to Use Earnings Beat on moomoo
Free Real-Time Quotes: Have your Fingers on the Pulse of Short-Term Stock Prices
How to Use Short Sale Analysis
How to Paper Trade on moomoo
Evaluating Stocks with Candlestick Patterns
How to Use Options Screener
Financial analysis – Graphical presentation of data, business performance at a glance
How to Diversify Order Settings