Microsoft Recently Hit an All-Time High. Here's What Technical Analysis Says Might Happen Next
$Microsoft(MSFT.US$ hit a new all-time intraday high in March. What does technical analysis tell us about this stock's positioning?
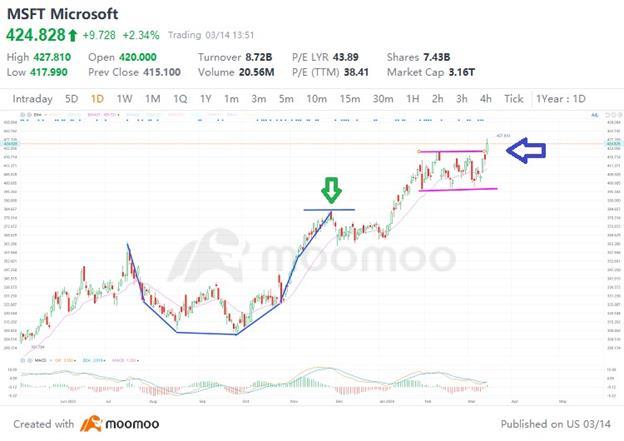
Well, readers can see in this chart prepared on March 14 that MSFT developed a nicely defined "cup-and-handle pattern" (the blue lines below) between mid-July into late November:

This potentially created a so-called "pivot point" at around $384 (denoted with a green arrow in the chart above).
Pivot points are areas on a chart where a breakout could occur or resistance might set in. They're spots where traders (or the automated investing algorithms that some institutional investors use) are likely to make trading decisions.
In a cup-and-handle pattern, the cup's right-side apex is the pivot. If there is no handle, the cup's left-side apex is the pivot.
In meeting resistance at its $384 pivot point, Microsoft formed a basing period of consolidation that lasted into January. It then entered a second basing period this February, denoted by the purple lines to the right of the chart above.
This indicated a new pivot point of about $420, which was the top of the purple lines (denoted by a blue arrow above).
On March 14, Microsoft broke through this pivot point even though that was a down day for the market as a whole. If Microsoft sustains at or above this $420 level, many technical analysts would consider that a positive.
Next let's look at a chart of Microsoft's daily Moving Average Convergence/Divergence (MACD) as of March 14:

The MACD appears in this chart to be finishing a crossover (denoted by a gray arrow) of the 26-day Exponential Moving Average (the blue line above) by the 12-day Exponential Moving Average (the orange line). That has historically been a bullish signal.
Meanwhile, a histogram of Microsoft's 9-day Exponential Moving Average (the red and green bars in the chart above) has just moved into positive territory, as denoted by the purple arrow above. That's also historically been a bullish signal.
The bottom line -- Microsofts charts were showing two historically bullish signals as of March 14, plus a potentially third bullish signal if the stock manages to sustain at or above $420.
Full disclosure: As of the time of this writing, I was long Microsoft stock.
Stephen Guilfoyle is commissioned by or affiliated with Moomoo Technologies Inc. Any comments or opinions provided are his own and do not necessarily reflect the views of MTI or its affiliated companies.
This presentation discusses technical analysis, other approaches, including fundamental analysis, may offer very different views. The examples provided are for illustrative purposes only and are not intended to be reflective of the results you can expect to achieve. Specific security charts used are for illustrative purposes only and are not a recommendation, offer to sell, or a solicitation of an offer to buy any security.
This presentation is for informational and educational use only and is not a recommendation or endorsement of any particular investment or investment strategy. Investment information provided in this content is general in nature, strictly for illustrative purposes, and may not be appropriate for all investors. It is provided without respect to individual investors’ financial sophistication, financial situation, investment objectives, investing time horizon, or risk tolerance. You should consider the appropriateness of this information having regard to your relevant personal circumstances before making any investment decisions. Past investment performance does not indicate or guarantee future success. Returns will vary, and all investments carry risks, including loss of principal. Moomoo makes no representation or warranty as to its adequacy, completeness, accuracy or timeline for any particular purpose of the above content. Moomoo is a financial information and trading app offered by Moomoo Technologies Inc. In the U.S., investment products and services available through the moomoo app are offered by Moomoo Financial Inc., a broker-dealer registered with the U.S. Securities and Exchange Commission (SEC) and a member of Financial Industry Regulatory Authority (FINRA)/Securities Investor Protection Corporation (SIPC). In Singapore, investment products and services available through the moomoo app are offered through Moomoo Financial Singapore Pte. Ltd. regulated by the Monetary Authority of Singapore (MAS). Moomoo Financial Singapore Pte. Ltd. is a Capital Markets Services Licence (License No. CMS101000) holder with the Exempt Financial Adviser Status. This advertisement has not been reviewed by the Monetary Authority of Singapore. In Australia, financial products and services available through the moomoo app are provided by Futu Securities (Australia) Ltd, an Australian Financial Services Licensee (AFSL No. 224663) regulated by the Australian Securities and Investment Commission (ASIC). Please read and understand our Financial Services Guide, Terms and Conditions, Privacy Policy and other disclosure documents which are available on our website.In Canada, order-execution only services available throughthe moomoo appare provided by Moomoo Financial Canada Inc., regulated bythe CanadianInvestment Regulatory Organization (CIRO). In Malaysia, investment products and services availablethrough the moomooapp are offered through Futu Malaysia Sdn. Bhd.("Moomoo MY") regulated bythe Securities Commission of Malaysia (SC). Futu MalaysiaSdn. Bhd. is aCapital Markets Services Licence (License No.eCMSL/A0397/2024) holder.This advertisement has not been reviewed by the SC.Moomoo Technologies Inc., Moomoo Financial Inc., MoomooFinancialSingapore Pte. Ltd., Futu Securities (Australia) Ltd,Moomoo Financial CanadaInc., and Futu Malaysia Sdn. Bhd. are affiliated companies.
Disclaimer: Community is offered by Moomoo Technologies Inc. and is for educational purposes only.
Read more
Comment
Sign in to post a comment
