Sample Name
Sample Code
Sample Name
Sample Code
Sample Name
Sample Code
4
NXP Semiconductors
NXPI
Also known as the position cost distribution of float (shares that are available for trading by the public), the Function presents the number of shares held at different prices by investors.
You can find the market position overview tab on each platform below:
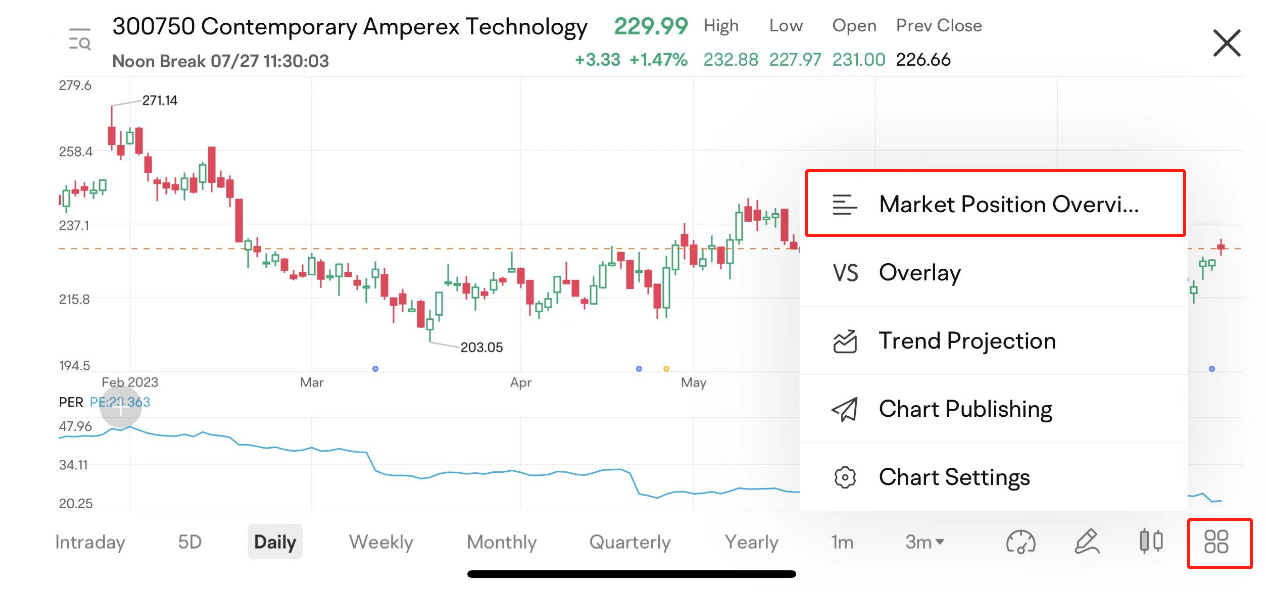
1) Select a Stock > Chart > Double tap on chart > Toolbox icon > Market Position Overview
(Please note that the application interface and its content shown above may differ from the actual application interface and content. To avoid any discrepancies, please update the application to the latest version available. The securities mentioned in the screenshot are for illustrative purposes only and should not be construed as investment advice.)
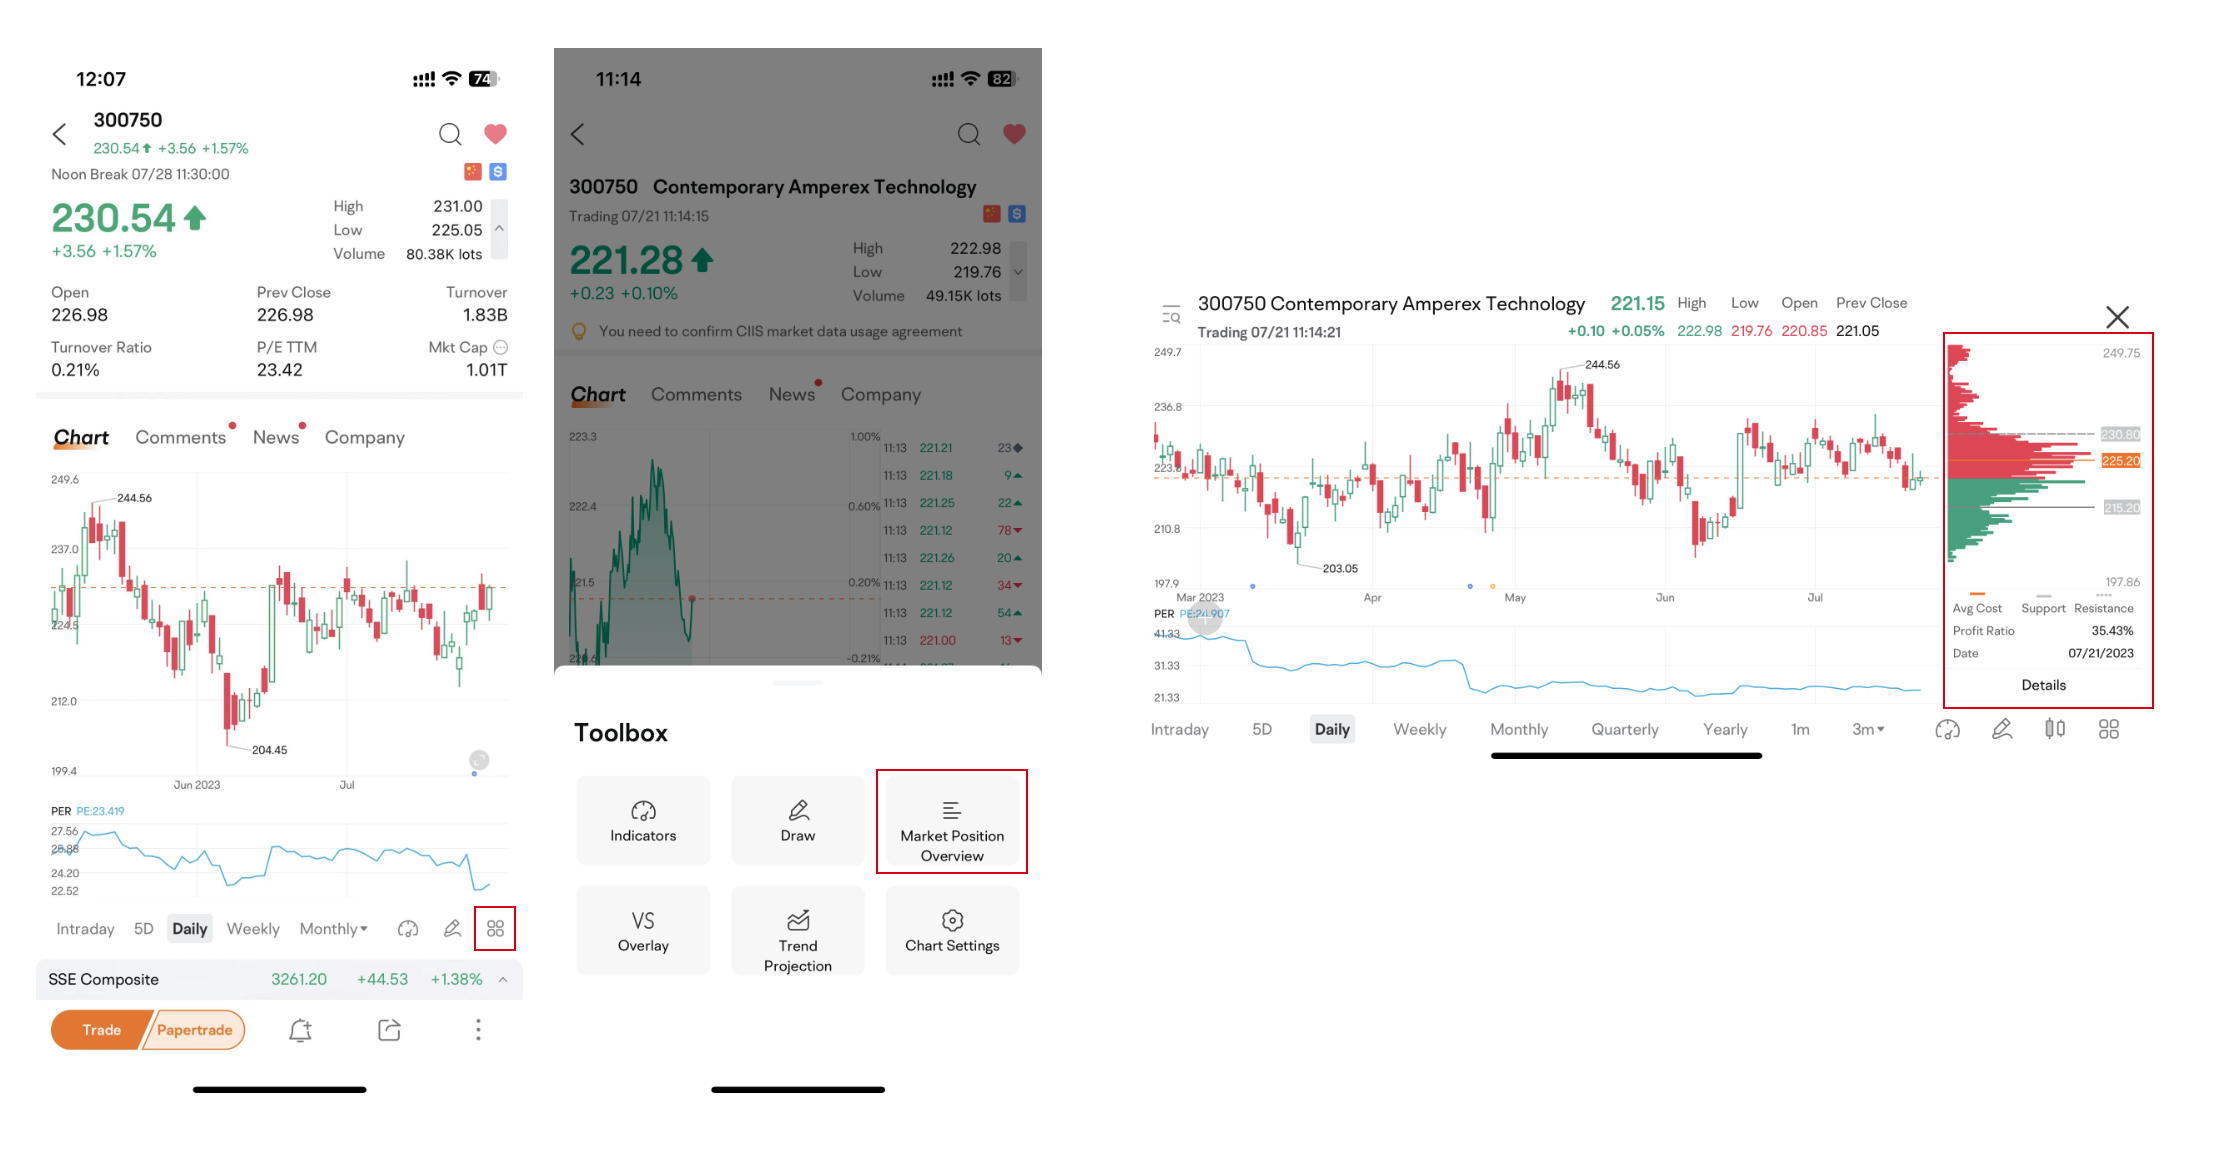
2) Select a Stock > Chart > Toolbox icon > Market Position Overview
(Please note that the application interface and its content shown above may differ from the actual application interface and content. To avoid any discrepancies, please update the application to the latest version available. The securities mentioned in the screenshot are for illustrative purposes only and should not be construed as investment advice.)
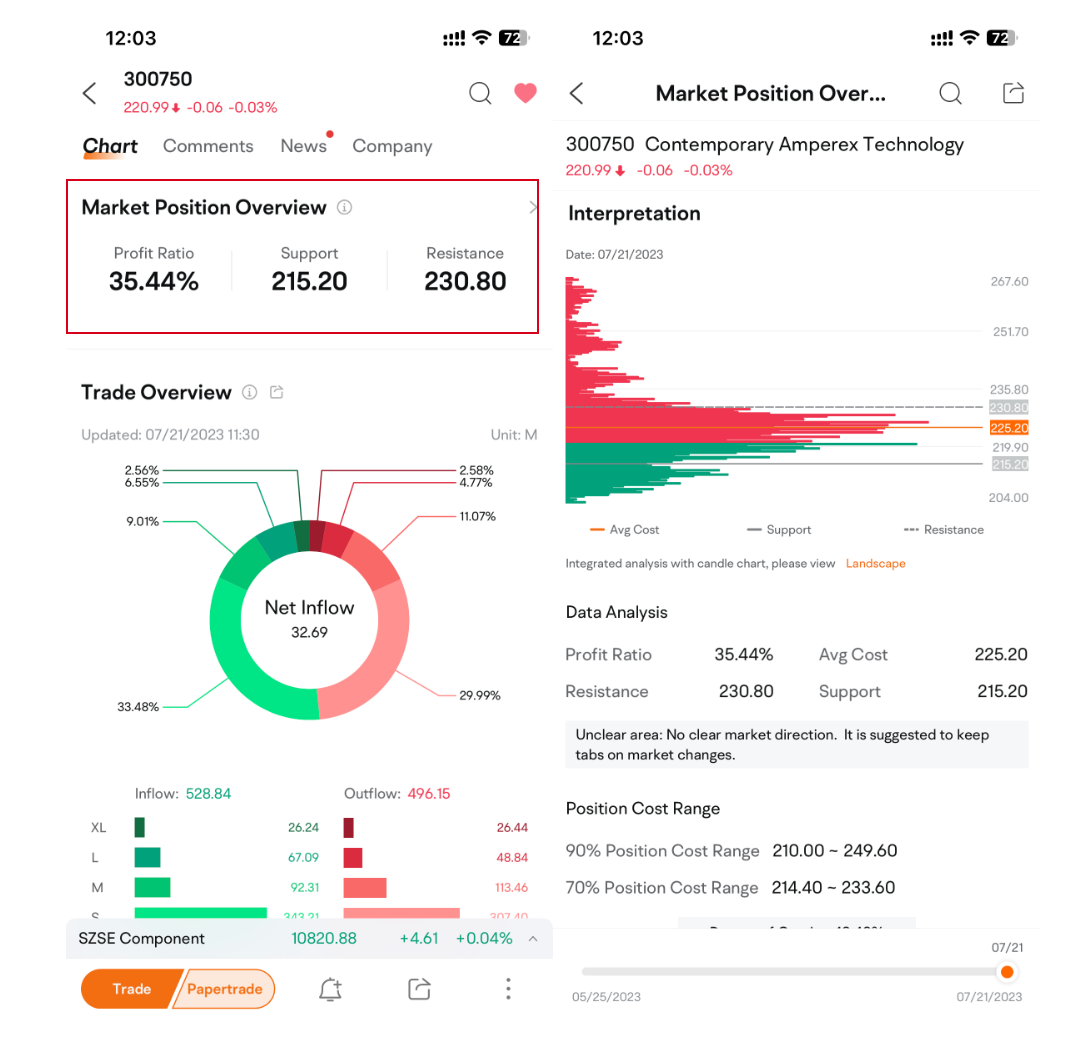
3) Select a Stock > Chart > Scroll down > Market Position Overview
(Please note that the application interface and its content shown above may differ from the actual application interface and content. To avoid any discrepancies, please update the application to the latest version available. The securities mentioned in the screenshot are for illustrative purposes only and should not be construed as investment advice.)
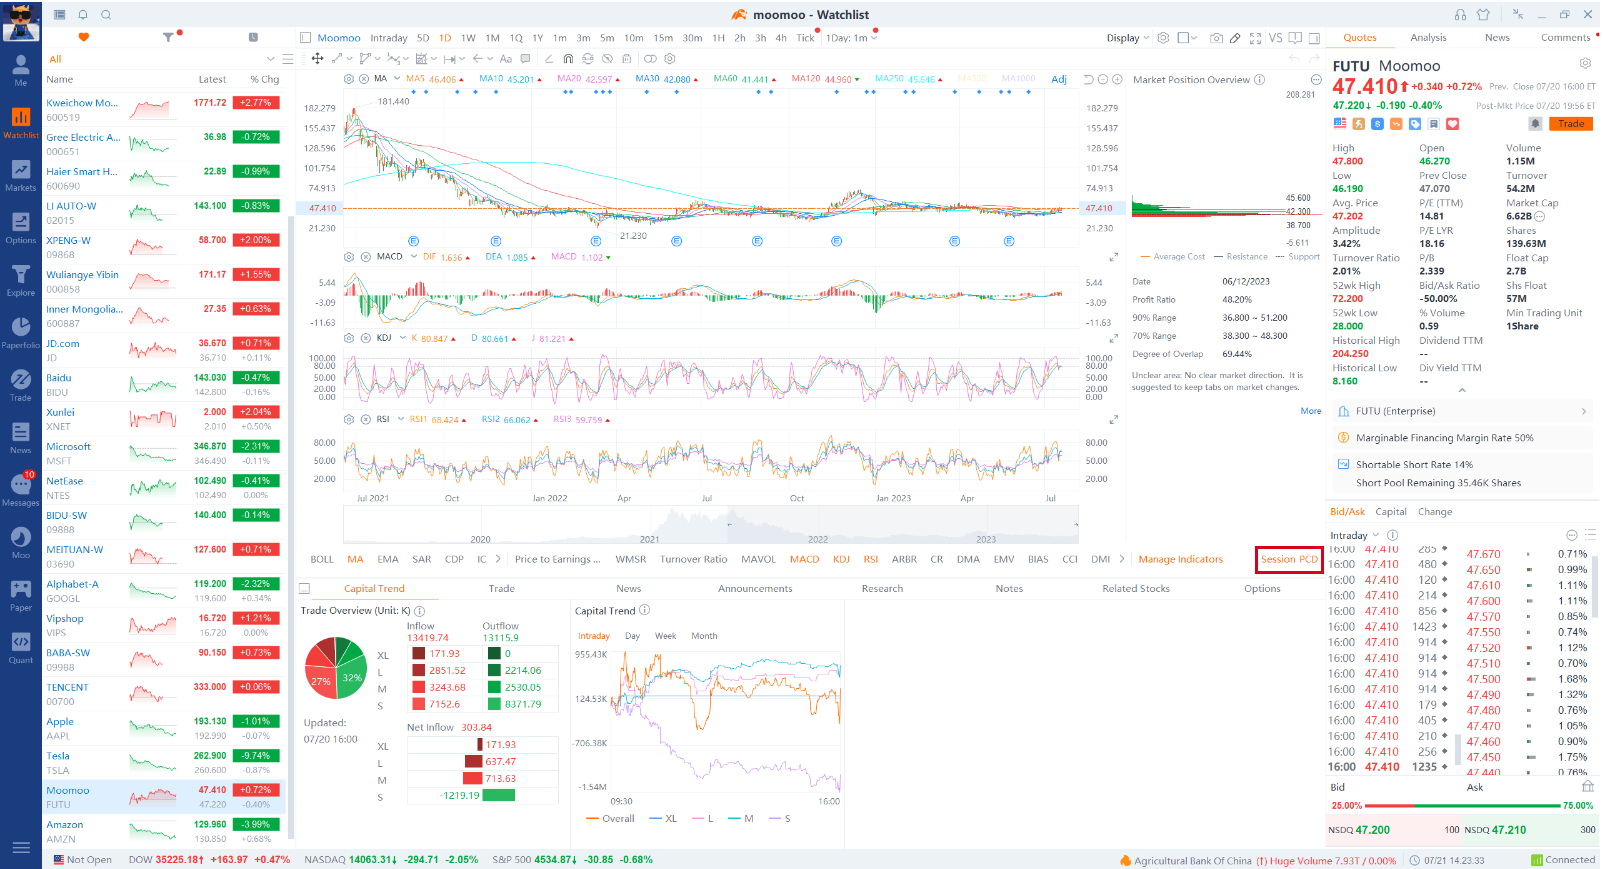
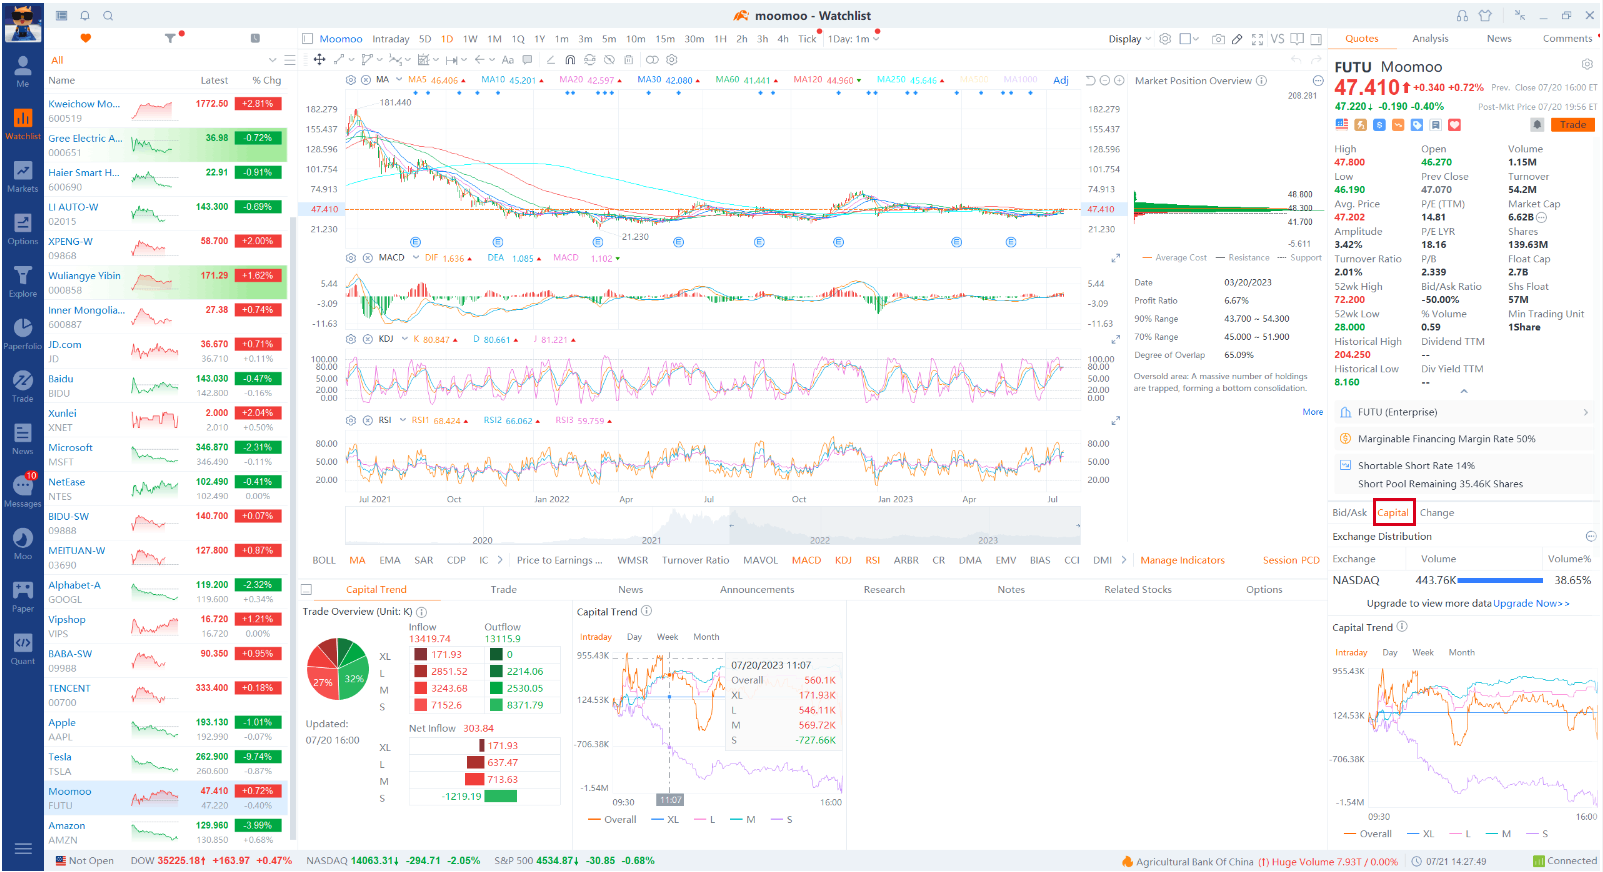
1) Select a Stock > Capital Trend > 1D on top of the Chart > PCD > Market Position Overview
(Please note that the application interface and its content shown above may differ from the actual application interface and content. To avoid any discrepancies, please update the application to the latest version available. The securities mentioned in the screenshot are for illustrative purposes only and should not be construed as investment advice.)
2) Select a Stock > Capital on the right sidebar > Scroll down > Market Position Overview
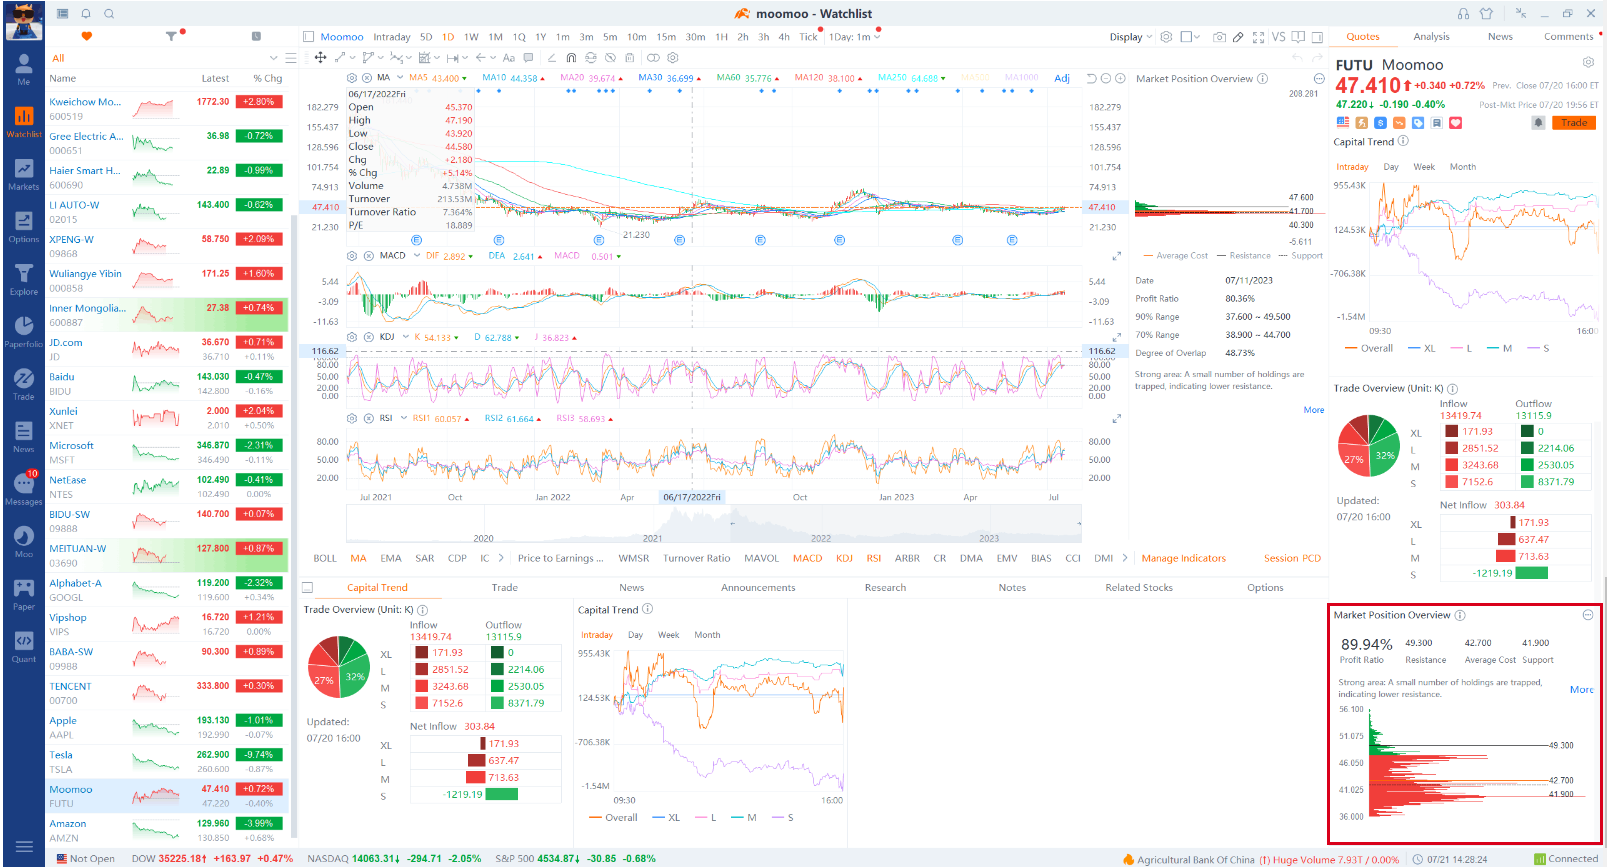
(Please note that the application interface and its content shown above may differ from the actual application interface and content. To avoid any discrepancies, please update the application to the latest version available. The securities mentioned in the screenshot are for illustrative purposes only and should not be construed as investment advice.)
1) Colors (As per the 「Quote Color」 setting in the App. Here "Green Up / Red Down" is used as an example)
Green: profitable positions; position cost < current stock price
Red: loss-making positions; position cost > current stock price
Grey: neutral positions; position cost = current stock price
Blue: current stock price
2) Terminology
Profit Ratio: the proportion of profitable positions
Average Cost: the average price of all positions
Resistance: the average price of loss-making positions
Support: the average price of profitable positions
90% Position Cost Range: the price range of 90% of all positions
70% Position Cost Range: the price range of 70% of all positions
Degree of Overlap: the extent to which the two Ranges overlap. The greater the Degree of Overlap, the more concentrated the positions and the more moderate the stock price fluctuation.
(Please note that the application interface and its content shown above may differ from the actual application interface and content. To avoid any discrepancies, please update the application to the latest version available. The securities mentioned in the screenshot are for illustrative purposes only and should not be construed as investment advice.)
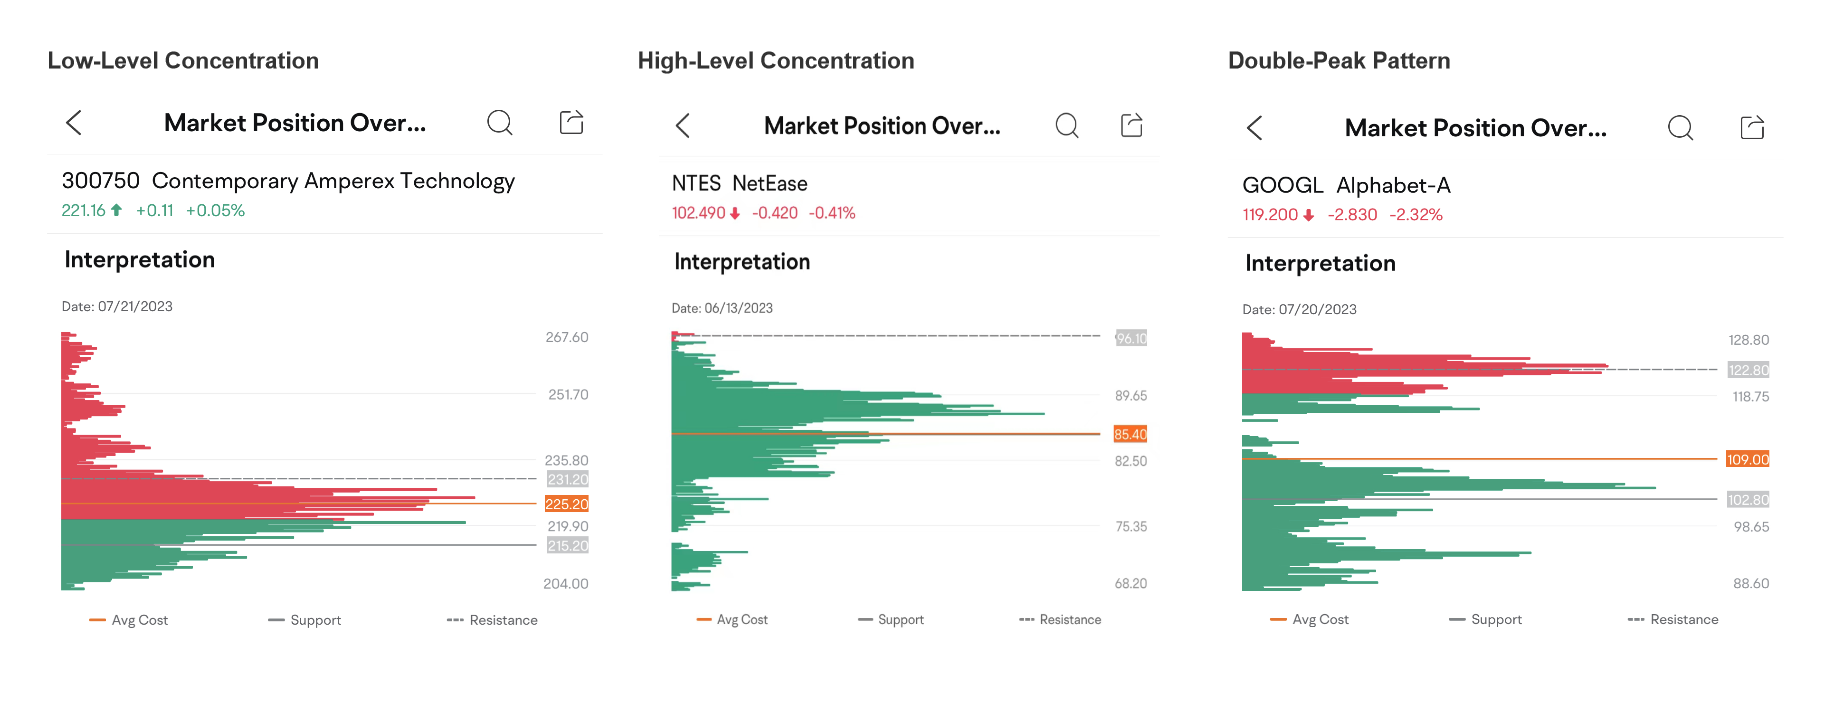
● Low-Level Concentration: As the stock price falls, position costs gradually decrease. When most of the positions are concentrated to the low price level, the resistance weakens and a rise in stock price is possible.
● High-Level Concentration: As the stock price rises, position costs gradually increase. When most of the positions are concentrated to the high price level, it may indicate that the low-cost positions have already exited after taking profit and that a momentum to fall is gathering strength.
● Double-Peak Pattern: This pattern mostly occurs in stocks with repeated price fluctuations within a certain range. The upper peak can be regarded as the resistance and the lower support. Investors may be better off if they 「sell high and buy low」 in accordance with the rhythm of price fluctuations.
Note: All the data and information above are for reference only and do not constitute any investment advice.
Risk Disclosure This presentation is for informational and educational use only and is not a recommendation or endorsement of any particular investment or investment strategy. Investment information provided in this content is general in nature, strictly for illustrative purposes, and may not be appropriate for all investors. It is provided without respect to individual investors’ financial sophistication, financial situation, investment objectives, investing time horizon, or risk tolerance. You should consider the appropriateness of this information having regard to your relevant personal circumstances before making any investment decisions. Past investment performance does not indicate or guarantee future success. Returns will vary, and all investments carry risks, including loss of principal. Moomoo makes no representation or warranty as to its adequacy, completeness, accuracy or timeliness for any particular purpose of the above content.