Bearish continuation triangle
1. Introduction
Bearish Continuation Triangle is a pattern formed by two converging trend lines. This pattern means that the current downtrend is likely to continue.
2. Feature
2.1 The bearish continuation triangle occurs after the fall of stock price, followed by several violent fluctuations;
2.2 The bearish continuation triangle is formed by two converging trend lines. The two trend lines converge into a triangle, and the lower trend line is nearly horizontal;
2.3 A bearish continuous triangle. Recently, the price has broken downward through the bottom connecting support line, and it is likely to continue to fall in the future.
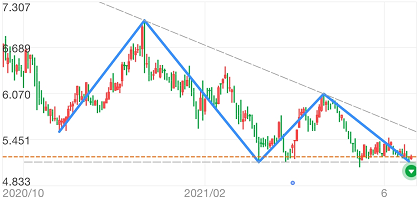
3. Example
00861 has a Bearish Continuation Triangle Pattern on June 18, 2021.
This presentation is for informational and educational use only and is not a recommendation or endorsement of any particular investment or investment strategy. Investment information provided in this content is general in nature, strictly for illustrative purposes, and may not be appropriate for all investors. It is provided without respect to individual investors’ financial sophistication, financial situation, investment objectives, investing time horizon, or risk tolerance. You should consider the appropriateness of this information having regard to your relevant personal circumstances before making any investment decisions. Past investment performance does not indicate or guarantee future success. Returns will vary, and all investments carry risks, including loss of principal. Moomoo makes no representation or warranty as to its adequacy, completeness, accuracy or timeliness for any particular purpose of the above content.