
Unfortunately for some shareholders, the Fusen Pharmaceutical Company Limited (HKG:1652) share price has dived 26% in the last thirty days, prolonging recent pain. The drop over the last 30 days has capped off a tough year for shareholders, with the share price down 30% in that time.
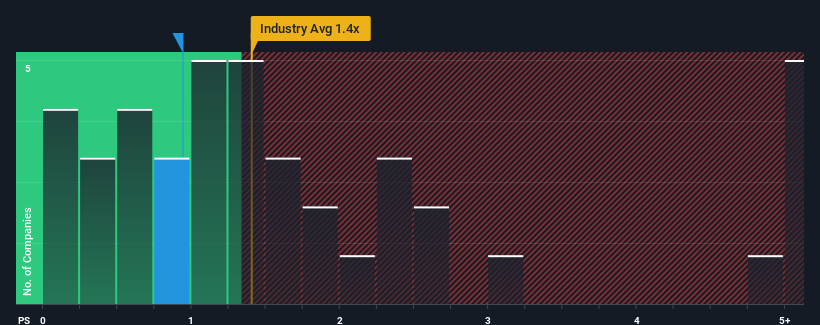
Even after such a large drop in price, it's still not a stretch to say that Fusen Pharmaceutical's price-to-sales (or "P/S") ratio of 0.9x right now seems quite "middle-of-the-road" compared to the Pharmaceuticals industry in Hong Kong, where the median P/S ratio is around 1.4x. While this might not raise any eyebrows, if the P/S ratio is not justified investors could be missing out on a potential opportunity or ignoring looming disappointment.
How Fusen Pharmaceutical Has Been Performing
Fusen Pharmaceutical certainly has been doing a great job lately as it's been growing its revenue at a really rapid pace. The P/S is probably moderate because investors think this strong revenue growth might not be enough to outperform the broader industry in the near future. If that doesn't eventuate, then existing shareholders have reason to be feeling optimistic about the future direction of the share price.
Although there are no analyst estimates available for Fusen Pharmaceutical, take a look at this free data-rich visualisation to see how the company stacks up on earnings, revenue and cash flow.Do Revenue Forecasts Match The P/S Ratio?
Fusen Pharmaceutical's P/S ratio would be typical for a company that's only expected to deliver moderate growth, and importantly, perform in line with the industry.
Retrospectively, the last year delivered an exceptional 97% gain to the company's top line. The latest three year period has also seen an excellent 45% overall rise in revenue, aided by its short-term performance. Therefore, it's fair to say the revenue growth recently has been superb for the company.
Comparing that to the industry, which is predicted to deliver 15% growth in the next 12 months, the company's momentum is weaker, based on recent medium-term annualised revenue results.
With this information, we find it interesting that Fusen Pharmaceutical is trading at a fairly similar P/S compared to the industry. Apparently many investors in the company are less bearish than recent times would indicate and aren't willing to let go of their stock right now. Maintaining these prices will be difficult to achieve as a continuation of recent revenue trends is likely to weigh down the shares eventually.
The Final Word
Following Fusen Pharmaceutical's share price tumble, its P/S is just clinging on to the industry median P/S. Generally, our preference is to limit the use of the price-to-sales ratio to establishing what the market thinks about the overall health of a company.
Our examination of Fusen Pharmaceutical revealed its poor three-year revenue trends aren't resulting in a lower P/S as per our expectations, given they look worse than current industry outlook. When we see weak revenue with slower than industry growth, we suspect the share price is at risk of declining, bringing the P/S back in line with expectations. If recent medium-term revenue trends continue, the probability of a share price decline will become quite substantial, placing shareholders at risk.
It is also worth noting that we have found 2 warning signs for Fusen Pharmaceutical (1 is concerning!) that you need to take into consideration.
If strong companies turning a profit tickle your fancy, then you'll want to check out this free list of interesting companies that trade on a low P/E (but have proven they can grow earnings).
Have feedback on this article? Concerned about the content? Get in touch with us directly. Alternatively, email editorial-team (at) simplywallst.com.
This article by Simply Wall St is general in nature. We provide commentary based on historical data and analyst forecasts only using an unbiased methodology and our articles are not intended to be financial advice. It does not constitute a recommendation to buy or sell any stock, and does not take account of your objectives, or your financial situation. We aim to bring you long-term focused analysis driven by fundamental data. Note that our analysis may not factor in the latest price-sensitive company announcements or qualitative material. Simply Wall St has no position in any stocks mentioned.