
It's easy to match the overall market return by buying an index fund. But if you buy individual stocks, you can do both better or worse than that. Investors in Kellanova (NYSE:K) have tasted that bitter downside in the last year, as the share price dropped 15%. That's well below the market return of 33%. Even if shareholders bought some time ago, they wouldn't be particularly happy: the stock is down 13% in three years.
Although the past week has been more reassuring for shareholders, they're still in the red over the last year, so let's see if the underlying business has been responsible for the decline.
While the efficient markets hypothesis continues to be taught by some, it has been proven that markets are over-reactive dynamic systems, and investors are not always rational. One flawed but reasonable way to assess how sentiment around a company has changed is to compare the earnings per share (EPS) with the share price.
During the unfortunate twelve months during which the Kellanova share price fell, it actually saw its earnings per share (EPS) improve by 5.0%. Of course, the situation might betray previous over-optimism about growth.
By glancing at these numbers, we'd posit that the the market had expectations of much higher growth, last year. But looking to other metrics might better explain the share price change.
Vibrant companies don't usually cut their dividends, so the recent reduction might help explain why the Kellanova share price has been weak.
You can see below how earnings and revenue have changed over time (discover the exact values by clicking on the image).
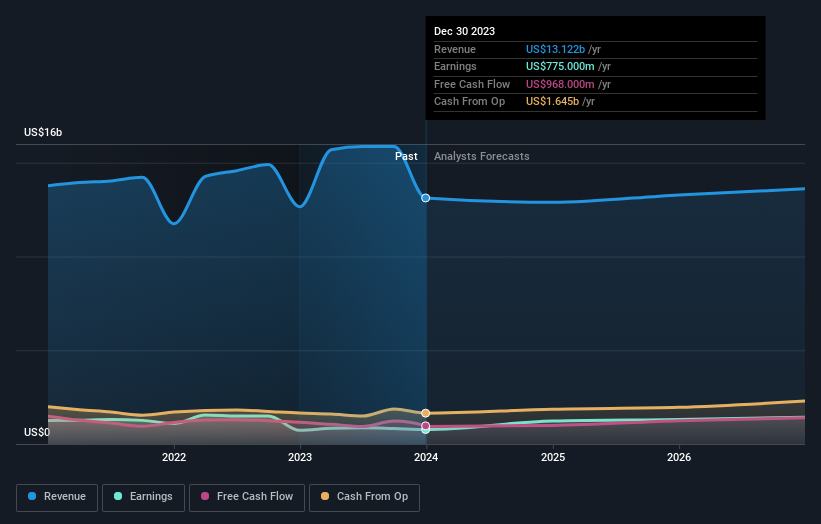
Kellanova is a well known stock, with plenty of analyst coverage, suggesting some visibility into future growth. Given we have quite a good number of analyst forecasts, it might be well worth checking out this free chart depicting consensus estimates.
What About Dividends?
As well as measuring the share price return, investors should also consider the total shareholder return (TSR). Whereas the share price return only reflects the change in the share price, the TSR includes the value of dividends (assuming they were reinvested) and the benefit of any discounted capital raising or spin-off. Arguably, the TSR gives a more comprehensive picture of the return generated by a stock. In the case of Kellanova, it has a TSR of -5.9% for the last 1 year. That exceeds its share price return that we previously mentioned. This is largely a result of its dividend payments!
A Different Perspective
While the broader market gained around 33% in the last year, Kellanova shareholders lost 5.9% (even including dividends). However, keep in mind that even the best stocks will sometimes underperform the market over a twelve month period. On the bright side, long term shareholders have made money, with a gain of 4% per year over half a decade. It could be that the recent sell-off is an opportunity, so it may be worth checking the fundamental data for signs of a long term growth trend. It's always interesting to track share price performance over the longer term. But to understand Kellanova better, we need to consider many other factors. To that end, you should be aware of the 2 warning signs we've spotted with Kellanova .
But note: Kellanova may not be the best stock to buy. So take a peek at this free list of interesting companies with past earnings growth (and further growth forecast).
Please note, the market returns quoted in this article reflect the market weighted average returns of stocks that currently trade on American exchanges.
Have feedback on this article? Concerned about the content? Get in touch with us directly. Alternatively, email editorial-team (at) simplywallst.com.
This article by Simply Wall St is general in nature. We provide commentary based on historical data and analyst forecasts only using an unbiased methodology and our articles are not intended to be financial advice. It does not constitute a recommendation to buy or sell any stock, and does not take account of your objectives, or your financial situation. We aim to bring you long-term focused analysis driven by fundamental data. Note that our analysis may not factor in the latest price-sensitive company announcements or qualitative material. Simply Wall St has no position in any stocks mentioned.