
Netjoy Holdings Limited (HKG:2131) shares have had a really impressive month, gaining 29% after a shaky period beforehand. Unfortunately, the gains of the last month did little to right the losses of the last year with the stock still down 41% over that time.
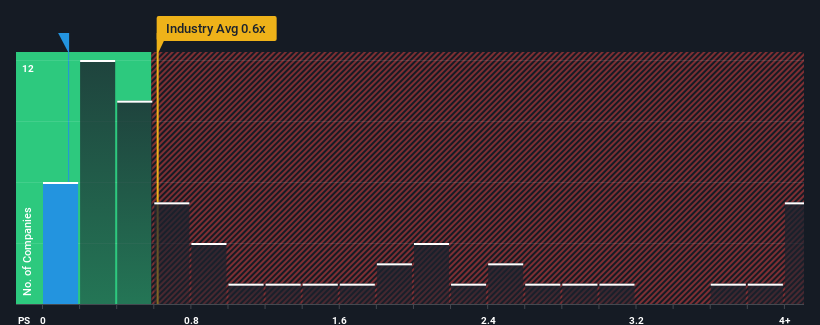
Even after such a large jump in price, there still wouldn't be many who think Netjoy Holdings' price-to-sales (or "P/S") ratio of 0.1x is worth a mention when the median P/S in Hong Kong's Media industry is similar at about 0.6x. While this might not raise any eyebrows, if the P/S ratio is not justified investors could be missing out on a potential opportunity or ignoring looming disappointment.
How Netjoy Holdings Has Been Performing
The recent revenue growth at Netjoy Holdings would have to be considered satisfactory if not spectacular. One possibility is that the P/S is moderate because investors think this good revenue growth might only be parallel to the broader industry in the near future. If you like the company, you'd be hoping this isn't the case so that you could potentially pick up some stock while it's not quite in favour.
Although there are no analyst estimates available for Netjoy Holdings, take a look at this free data-rich visualisation to see how the company stacks up on earnings, revenue and cash flow.Do Revenue Forecasts Match The P/S Ratio?
The only time you'd be comfortable seeing a P/S like Netjoy Holdings' is when the company's growth is tracking the industry closely.
Taking a look back first, we see that the company managed to grow revenues by a handy 4.5% last year. The latest three year period has also seen an excellent 82% overall rise in revenue, aided somewhat by its short-term performance. So we can start by confirming that the company has done a great job of growing revenues over that time.
This is in contrast to the rest of the industry, which is expected to grow by 9.7% over the next year, materially lower than the company's recent medium-term annualised growth rates.
With this information, we find it interesting that Netjoy Holdings is trading at a fairly similar P/S compared to the industry. Apparently some shareholders believe the recent performance is at its limits and have been accepting lower selling prices.
The Final Word
Netjoy Holdings appears to be back in favour with a solid price jump bringing its P/S back in line with other companies in the industry It's argued the price-to-sales ratio is an inferior measure of value within certain industries, but it can be a powerful business sentiment indicator.
We didn't quite envision Netjoy Holdings' P/S sitting in line with the wider industry, considering the revenue growth over the last three-year is higher than the current industry outlook. There could be some unobserved threats to revenue preventing the P/S ratio from matching this positive performance. At least the risk of a price drop looks to be subdued if recent medium-term revenue trends continue, but investors seem to think future revenue could see some volatility.
Don't forget that there may be other risks. For instance, we've identified 3 warning signs for Netjoy Holdings (1 is a bit unpleasant) you should be aware of.
If companies with solid past earnings growth is up your alley, you may wish to see this free collection of other companies with strong earnings growth and low P/E ratios.
Have feedback on this article? Concerned about the content? Get in touch with us directly. Alternatively, email editorial-team (at) simplywallst.com.
This article by Simply Wall St is general in nature. We provide commentary based on historical data and analyst forecasts only using an unbiased methodology and our articles are not intended to be financial advice. It does not constitute a recommendation to buy or sell any stock, and does not take account of your objectives, or your financial situation. We aim to bring you long-term focused analysis driven by fundamental data. Note that our analysis may not factor in the latest price-sensitive company announcements or qualitative material. Simply Wall St has no position in any stocks mentioned.