
With its stock down 16% over the past three months, it is easy to disregard Universal (NYSE:UVV). We, however decided to study the company's financials to determine if they have got anything to do with the price decline. Stock prices are usually driven by a company's financial performance over the long term, and therefore we decided to pay more attention to the company's financial performance. Specifically, we decided to study Universal's ROE in this article.
Return on equity or ROE is an important factor to be considered by a shareholder because it tells them how effectively their capital is being reinvested. In short, ROE shows the profit each dollar generates with respect to its shareholder investments.
How Is ROE Calculated?
The formula for ROE is:
Return on Equity = Net Profit (from continuing operations) ÷ Shareholders' Equity
So, based on the above formula, the ROE for Universal is:
9.8% = US$144m ÷ US$1.5b (Based on the trailing twelve months to December 2023).
The 'return' is the income the business earned over the last year. So, this means that for every $1 of its shareholder's investments, the company generates a profit of $0.10.
What Has ROE Got To Do With Earnings Growth?
We have already established that ROE serves as an efficient profit-generating gauge for a company's future earnings. Based on how much of its profits the company chooses to reinvest or "retain", we are then able to evaluate a company's future ability to generate profits. Assuming all else is equal, companies that have both a higher return on equity and higher profit retention are usually the ones that have a higher growth rate when compared to companies that don't have the same features.
Universal's Earnings Growth And 9.8% ROE
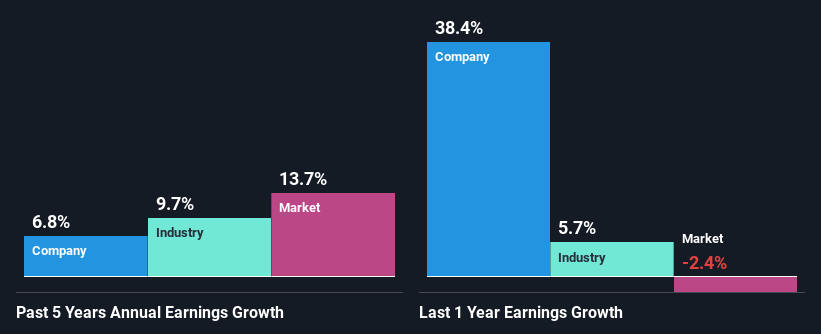
When you first look at it, Universal's ROE doesn't look that attractive. We then compared the company's ROE to the broader industry and were disappointed to see that the ROE is lower than the industry average of 22%. However, the moderate 6.8% net income growth seen by Universal over the past five years is definitely a positive. So, there might be other aspects that are positively influencing the company's earnings growth. Such as - high earnings retention or an efficient management in place.
Next, on comparing with the industry net income growth, we found that Universal's reported growth was lower than the industry growth of 9.7% over the last few years, which is not something we like to see.
The basis for attaching value to a company is, to a great extent, tied to its earnings growth. The investor should try to establish if the expected growth or decline in earnings, whichever the case may be, is priced in. Doing so will help them establish if the stock's future looks promising or ominous. If you're wondering about Universal's's valuation, check out this gauge of its price-to-earnings ratio, as compared to its industry.
Is Universal Making Efficient Use Of Its Profits?
Universal has a significant three-year median payout ratio of 81%, meaning that it is left with only 19% to reinvest into its business. This implies that the company has been able to achieve decent earnings growth despite returning most of its profits to shareholders.
Moreover, Universal is determined to keep sharing its profits with shareholders which we infer from its long history of paying a dividend for at least ten years.
Conclusion
On the whole, we feel that the performance shown by Universal can be open to many interpretations. Although the company has shown a fair bit of growth in earnings, the reinvestment rate is low. Meaning, the earnings growth number could have been significantly higher had the company been retaining more of its profits and reinvesting that at a higher rate of return. Until now, we have only just grazed the surface of the company's past performance by looking at the company's fundamentals. So it may be worth checking this free detailed graph of Universal's past earnings, as well as revenue and cash flows to get a deeper insight into the company's performance.
Have feedback on this article? Concerned about the content? Get in touch with us directly. Alternatively, email editorial-team (at) simplywallst.com.
This article by Simply Wall St is general in nature. We provide commentary based on historical data and analyst forecasts only using an unbiased methodology and our articles are not intended to be financial advice. It does not constitute a recommendation to buy or sell any stock, and does not take account of your objectives, or your financial situation. We aim to bring you long-term focused analysis driven by fundamental data. Note that our analysis may not factor in the latest price-sensitive company announcements or qualitative material. Simply Wall St has no position in any stocks mentioned.