
It is hard to get excited after looking at Duckhorn Portfolio's (NYSE:NAPA) recent performance, when its stock has declined 9.8% over the past week. But if you pay close attention, you might find that its key financial indicators look quite decent, which could mean that the stock could potentially rise in the long-term given how markets usually reward more resilient long-term fundamentals. Particularly, we will be paying attention to Duckhorn Portfolio's ROE today.
Return on Equity or ROE is a test of how effectively a company is growing its value and managing investors' money. Simply put, it is used to assess the profitability of a company in relation to its equity capital.
How Is ROE Calculated?
The formula for return on equity is:
Return on Equity = Net Profit (from continuing operations) ÷ Shareholders' Equity
So, based on the above formula, the ROE for Duckhorn Portfolio is:
6.8% = US$66m ÷ US$977m (Based on the trailing twelve months to January 2024).
The 'return' is the income the business earned over the last year. So, this means that for every $1 of its shareholder's investments, the company generates a profit of $0.07.
What Has ROE Got To Do With Earnings Growth?
Thus far, we have learned that ROE measures how efficiently a company is generating its profits. Depending on how much of these profits the company reinvests or "retains", and how effectively it does so, we are then able to assess a company's earnings growth potential. Generally speaking, other things being equal, firms with a high return on equity and profit retention, have a higher growth rate than firms that don't share these attributes.
A Side By Side comparison of Duckhorn Portfolio's Earnings Growth And 6.8% ROE
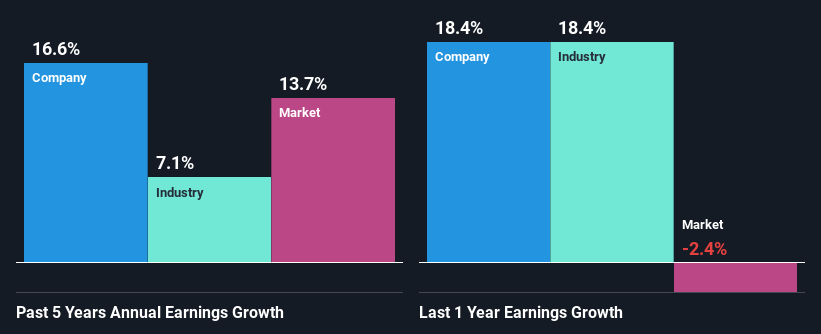
At first glance, Duckhorn Portfolio's ROE doesn't look very promising. Next, when compared to the average industry ROE of 18%, the company's ROE leaves us feeling even less enthusiastic. However, the moderate 17% net income growth seen by Duckhorn Portfolio over the past five years is definitely a positive. We reckon that there could be other factors at play here. For instance, the company has a low payout ratio or is being managed efficiently.
We then compared Duckhorn Portfolio's net income growth with the industry and we're pleased to see that the company's growth figure is higher when compared with the industry which has a growth rate of 7.1% in the same 5-year period.
The basis for attaching value to a company is, to a great extent, tied to its earnings growth. The investor should try to establish if the expected growth or decline in earnings, whichever the case may be, is priced in. This then helps them determine if the stock is placed for a bright or bleak future. What is NAPA worth today? The intrinsic value infographic in our free research report helps visualize whether NAPA is currently mispriced by the market.
Is Duckhorn Portfolio Using Its Retained Earnings Effectively?
Given that Duckhorn Portfolio doesn't pay any dividend to its shareholders, we infer that the company has been reinvesting all of its profits to grow its business.
Conclusion
Overall, we feel that Duckhorn Portfolio certainly does have some positive factors to consider. Even in spite of the low rate of return, the company has posted impressive earnings growth as a result of reinvesting heavily into its business. On studying current analyst estimates, we found that analysts expect the company to continue its recent growth streak. Are these analysts expectations based on the broad expectations for the industry, or on the company's fundamentals? Click here to be taken to our analyst's forecasts page for the company.
Have feedback on this article? Concerned about the content? Get in touch with us directly. Alternatively, email editorial-team (at) simplywallst.com.
This article by Simply Wall St is general in nature. We provide commentary based on historical data and analyst forecasts only using an unbiased methodology and our articles are not intended to be financial advice. It does not constitute a recommendation to buy or sell any stock, and does not take account of your objectives, or your financial situation. We aim to bring you long-term focused analysis driven by fundamental data. Note that our analysis may not factor in the latest price-sensitive company announcements or qualitative material. Simply Wall St has no position in any stocks mentioned.