
If you buy and hold a stock for many years, you'd hope to be making a profit. Furthermore, you'd generally like to see the share price rise faster than the market. But Spectrum Brands Holdings, Inc. (NYSE:SPB) has fallen short of that second goal, with a share price rise of 48% over five years, which is below the market return. On a brighter note, more newer shareholders are probably rather content with the 26% share price gain over twelve months.
While the stock has fallen 6.8% this week, it's worth focusing on the longer term and seeing if the stocks historical returns have been driven by the underlying fundamentals.
In his essay The Superinvestors of Graham-and-Doddsville Warren Buffett described how share prices do not always rationally reflect the value of a business. One way to examine how market sentiment has changed over time is to look at the interaction between a company's share price and its earnings per share (EPS).
Spectrum Brands Holdings has made a profit in the past. However, it made a loss in the last twelve months, suggesting profit may be an unreliable metric at this stage. So we might find other metrics can better explain the share price movements.
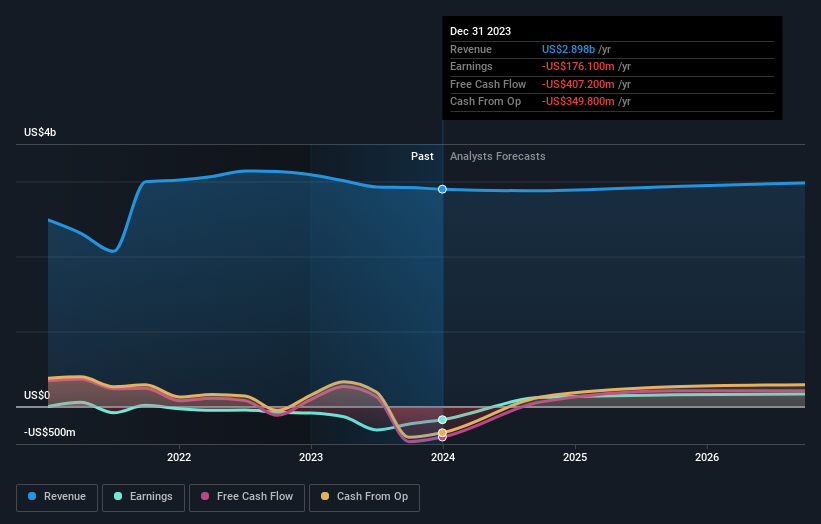
It is not great to see that revenue has dropped by 4.5% per year over five years. It certainly surprises us that the share price is up, but perhaps a closer examination of the data will yield answers.
The graphic below depicts how earnings and revenue have changed over time (unveil the exact values by clicking on the image).
It's good to see that there was some significant insider buying in the last three months. That's a positive. On the other hand, we think the revenue and earnings trends are much more meaningful measures of the business. So we recommend checking out this free report showing consensus forecasts
What About Dividends?
It is important to consider the total shareholder return, as well as the share price return, for any given stock. Whereas the share price return only reflects the change in the share price, the TSR includes the value of dividends (assuming they were reinvested) and the benefit of any discounted capital raising or spin-off. Arguably, the TSR gives a more comprehensive picture of the return generated by a stock. We note that for Spectrum Brands Holdings the TSR over the last 5 years was 67%, which is better than the share price return mentioned above. The dividends paid by the company have thusly boosted the total shareholder return.
A Different Perspective
We're pleased to report that Spectrum Brands Holdings shareholders have received a total shareholder return of 28% over one year. Of course, that includes the dividend. That gain is better than the annual TSR over five years, which is 11%. Therefore it seems like sentiment around the company has been positive lately. Given the share price momentum remains strong, it might be worth taking a closer look at the stock, lest you miss an opportunity. I find it very interesting to look at share price over the long term as a proxy for business performance. But to truly gain insight, we need to consider other information, too. Even so, be aware that Spectrum Brands Holdings is showing 1 warning sign in our investment analysis , you should know about...
If you like to buy stocks alongside management, then you might just love this free list of companies. (Hint: insiders have been buying them).
Please note, the market returns quoted in this article reflect the market weighted average returns of stocks that currently trade on American exchanges.
Have feedback on this article? Concerned about the content? Get in touch with us directly. Alternatively, email editorial-team (at) simplywallst.com.
This article by Simply Wall St is general in nature. We provide commentary based on historical data and analyst forecasts only using an unbiased methodology and our articles are not intended to be financial advice. It does not constitute a recommendation to buy or sell any stock, and does not take account of your objectives, or your financial situation. We aim to bring you long-term focused analysis driven by fundamental data. Note that our analysis may not factor in the latest price-sensitive company announcements or qualitative material. Simply Wall St has no position in any stocks mentioned.