
Despite an already strong run, Kaisun Holdings Limited (HKG:8203) shares have been powering on, with a gain of 31% in the last thirty days. The last 30 days bring the annual gain to a very sharp 70%.
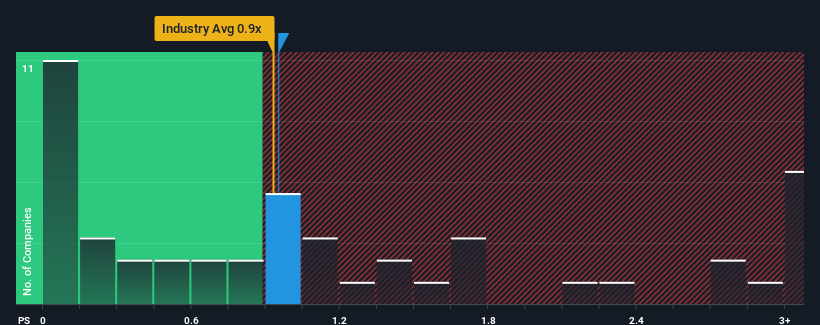
Although its price has surged higher, it's still not a stretch to say that Kaisun Holdings' price-to-sales (or "P/S") ratio of 1x right now seems quite "middle-of-the-road" compared to the Oil and Gas industry in Hong Kong, where the median P/S ratio is around 0.9x. However, investors might be overlooking a clear opportunity or potential setback if there is no rational basis for the P/S.
How Kaisun Holdings Has Been Performing
For example, consider that Kaisun Holdings' financial performance has been poor lately as its revenue has been in decline. Perhaps investors believe the recent revenue performance is enough to keep in line with the industry, which is keeping the P/S from dropping off. If not, then existing shareholders may be a little nervous about the viability of the share price.
We don't have analyst forecasts, but you can see how recent trends are setting up the company for the future by checking out our free report on Kaisun Holdings' earnings, revenue and cash flow.How Is Kaisun Holdings' Revenue Growth Trending?
There's an inherent assumption that a company should be matching the industry for P/S ratios like Kaisun Holdings' to be considered reasonable.
Taking a look back first, the company's revenue growth last year wasn't something to get excited about as it posted a disappointing decline of 15%. Spectacularly, three year revenue growth has ballooned by several orders of magnitude, despite the drawbacks experienced in the last 12 months. Accordingly, shareholders will be pleased, but also have some serious questions to ponder about the last 12 months.
This is in contrast to the rest of the industry, which is expected to grow by 0.4% over the next year, materially lower than the company's recent medium-term annualised growth rates.
With this information, we find it interesting that Kaisun Holdings is trading at a fairly similar P/S compared to the industry. It may be that most investors are not convinced the company can maintain its recent growth rates.
The Key Takeaway
Kaisun Holdings appears to be back in favour with a solid price jump bringing its P/S back in line with other companies in the industry While the price-to-sales ratio shouldn't be the defining factor in whether you buy a stock or not, it's quite a capable barometer of revenue expectations.
We've established that Kaisun Holdings currently trades on a lower than expected P/S since its recent three-year growth is higher than the wider industry forecast. When we see strong revenue with faster-than-industry growth, we can only assume potential risks are what might be placing pressure on the P/S ratio. At least the risk of a price drop looks to be subdued if recent medium-term revenue trends continue, but investors seem to think future revenue could see some volatility.
And what about other risks? Every company has them, and we've spotted 2 warning signs for Kaisun Holdings (of which 1 doesn't sit too well with us!) you should know about.
If companies with solid past earnings growth is up your alley, you may wish to see this free collection of other companies with strong earnings growth and low P/E ratios.
Have feedback on this article? Concerned about the content? Get in touch with us directly. Alternatively, email editorial-team (at) simplywallst.com.
This article by Simply Wall St is general in nature. We provide commentary based on historical data and analyst forecasts only using an unbiased methodology and our articles are not intended to be financial advice. It does not constitute a recommendation to buy or sell any stock, and does not take account of your objectives, or your financial situation. We aim to bring you long-term focused analysis driven by fundamental data. Note that our analysis may not factor in the latest price-sensitive company announcements or qualitative material. Simply Wall St has no position in any stocks mentioned.