
The Elife Holdings Limited (HKG:223) share price has softened a substantial 31% over the previous 30 days, handing back much of the gains the stock has made lately. Of course, over the longer-term many would still wish they owned shares as the stock's price has soared 111% in the last twelve months.
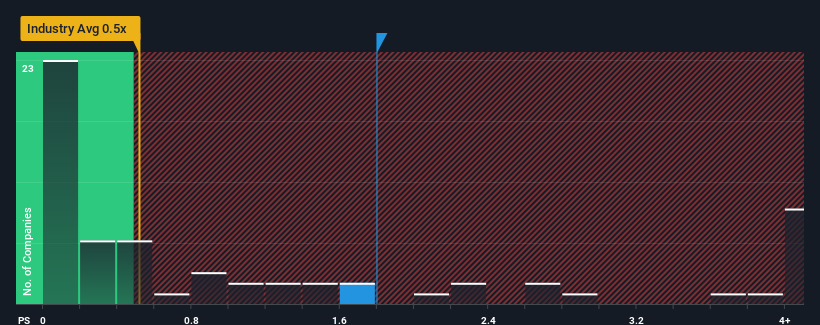
Although its price has dipped substantially, given close to half the companies operating in Hong Kong's Trade Distributors industry have price-to-sales ratios (or "P/S") below 0.5x, you may still consider Elife Holdings as a stock to potentially avoid with its 1.8x P/S ratio. Nonetheless, we'd need to dig a little deeper to determine if there is a rational basis for the elevated P/S.
Check out our latest analysis for Elife Holdings
What Does Elife Holdings' Recent Performance Look Like?
It looks like revenue growth has deserted Elife Holdings recently, which is not something to boast about. One possibility is that the P/S is high because investors think the benign revenue growth will improve to outperform the broader industry in the near future. You'd really hope so, otherwise you're paying a pretty hefty price for no particular reason.
Want the full picture on earnings, revenue and cash flow for the company? Then our free report on Elife Holdings will help you shine a light on its historical performance.What Are Revenue Growth Metrics Telling Us About The High P/S?
The only time you'd be truly comfortable seeing a P/S as high as Elife Holdings' is when the company's growth is on track to outshine the industry.
If we review the last year of revenue, the company posted a result that saw barely any deviation from a year ago. Still, the latest three year period was better as it's delivered a decent 26% overall rise in revenue. Accordingly, shareholders probably wouldn't have been overly satisfied with the unstable medium-term growth rates.
Comparing that recent medium-term revenue trajectory with the industry's one-year growth forecast of 3.6% shows it's noticeably more attractive.
In light of this, it's understandable that Elife Holdings' P/S sits above the majority of other companies. Presumably shareholders aren't keen to offload something they believe will continue to outmanoeuvre the wider industry.
What Does Elife Holdings' P/S Mean For Investors?
Despite the recent share price weakness, Elife Holdings' P/S remains higher than most other companies in the industry. We'd say the price-to-sales ratio's power isn't primarily as a valuation instrument but rather to gauge current investor sentiment and future expectations.
It's no surprise that Elife Holdings can support its high P/S given the strong revenue growth its experienced over the last three-year is superior to the current industry outlook. In the eyes of shareholders, the probability of a continued growth trajectory is great enough to prevent the P/S from pulling back. If recent medium-term revenue trends continue, it's hard to see the share price falling strongly in the near future under these circumstances.
It's always necessary to consider the ever-present spectre of investment risk. We've identified 3 warning signs with Elife Holdings (at least 1 which is concerning), and understanding them should be part of your investment process.
Of course, profitable companies with a history of great earnings growth are generally safer bets. So you may wish to see this free collection of other companies that have reasonable P/E ratios and have grown earnings strongly.
Have feedback on this article? Concerned about the content? Get in touch with us directly. Alternatively, email editorial-team (at) simplywallst.com.
This article by Simply Wall St is general in nature. We provide commentary based on historical data and analyst forecasts only using an unbiased methodology and our articles are not intended to be financial advice. It does not constitute a recommendation to buy or sell any stock, and does not take account of your objectives, or your financial situation. We aim to bring you long-term focused analysis driven by fundamental data. Note that our analysis may not factor in the latest price-sensitive company announcements or qualitative material. Simply Wall St has no position in any stocks mentioned.